Petrological characteristics and origin of the sandstone−type uranium deposits in the northern Sichuan Basin
-
摘要:研究目的
铀资源是中国重要的战略资源和能源矿产,为更好地勘探和开发四川盆地北部砂岩型铀矿,有必要深入了解其地质特征和成矿模式。
研究方法本文通过野外调查、岩矿鉴定和地球化学分析研究了砂岩型铀矿的岩石学特征,分析了其成矿过程。
研究结果含矿主岩主要为下白垩统苍溪组钙质胶结中—细粒砂岩和砾岩。铀以自生铀矿物的形式存在,铀矿物主要为铀石,呈他形、半自形和自形柱状。
结论米仓山铁船山组变质酸性火山岩和花岗岩为盆地砂岩型铀矿的形成提供了初始铀源。铀在水溶液中以碳酸铀酰离子的形式迁移,富含有机质和黄铁矿的沼泽和停滞水还原环境破坏了碳酸铀酰离子,使铀元素以沉积成岩为主局部叠加后生富集作用成矿。
创新点:依据砂岩型铀矿岩石学特征辨识了成矿物源,厘定了成矿过程。
Abstract:This paper is the result of mineral exploration engineering.
ObjectiveUranium resources are China's important strategic resources and energy minerals. The thorough understanding of geological characteristics and metallogenic models of sandstone–type uranium deposits in the northern Sichuan Basin is to the benefit of exploration and development.
MethodsThe petrological characteristics of sandstone–type uranium deposits are studied through field investigation, rock and mineral identification and geochemical analysis, and the mineralization process is analyzed.
ResultsThe ore–bearing rocks are mainly the calcareous cementation medium–fine–grained sandstone and conglomerate of the Lower Cretaceous Cangxi Formation. Uranium exists in the form of authigenic uranium minerals. Uranium minerals are mainly coffinite, which are in xenomorphic, euhedral and hypautomorphic granular.
ConclusionsThe metamorphic acidic volcanic rocks and granites of the Tiechuanshan Formation in Micangshan provided the initial uranium source for the formation of sandstone–type uranium deposits in the basin. Uranium migrates in the form of carbonic acid containing uranyl ions in the aqueous solution. The reductive environment of swamps and stagnant water rich in organic matter and pyrite destroys the carbonic acid containing uranyl ions, causing uranium to precipitate and accumulate in the primary diagenesis stage and secondary epigenesis stage.
Highlights:Based on the petrological characteristics of sandstone–type uranium deposits, the metallogenic source was identified and the metallogenic process was determined.
-
1. 引 言
世界卫生组织及中国饮用水标准规定砷浓度不可超过10 μg/L(WHO, 2017)。长期饮用高砷地下水可导致慢性砷中毒及皮肤癌等疾病,全球有70多个国家,超过1.5亿人的饮用水安全受到高砷地下水的威胁(韩双宝等,2010;郭华明等,2013;Wang et al., 2020;曹文庚等,2022; 张卓等,2023a)。沉积物中的固相砷是地下水中砷的主要来源。多数岩石中砷含量范围为0.5~2.5 μg/g(Mandal and Suzuki, 2002),松散沉积物中砷的含量范围通常为3~10 μg/g(Smedley and Kinniburgh, 2002; 何锦等,2020;马雪梅等,2020),富含砷矿物的沉积物中砷含量可达170 μg/g(Cook et al., 1995)。研究含水层中砷的迁移转化,除了查明沉积物总固态砷的含量,还需分析砷在沉积物中的赋存形态(van Herreweghe et al., 2003;朱丹尼等,2021;Drahota et al., 2021)。沉积物中固相砷赋存形态的微小差别可能引起地下水砷浓度的显著差异(Meharg et al., 2006; 张卓等,2023b)。分步提取实验是获取沉积物中砷赋存状态信息的主要手段。在之前的研究中,已经在分步提取过程中研究了萃取剂溶液的最优选择性(Paul et al., 2009;Eiche et al., 2010)。国外学者就河流三角洲沉积物中砷的赋存形态开展了大量研究。Eiche et al.(2008)研究表明,磷酸盐提取释放的强吸附砷是越南红河三角洲沉积物中砷的主要赋存形态。印度孟加拉三角洲平原的含水层中也发现了类似的结果(Neidhardt et al., 2014)。然而在内陆盆地,有关沉积物砷赋存形态的系统性研究相对缺乏。
河套盆地是中国西北地区典型的内陆盆地,地下水As浓度高达857 μg/L,远超中国饮用水标准(Guo et al., 2008)。因此,本研究选取河套盆地,通过刻画岩性与地球化学特征和开展砷的分步提取与解吸附实验,对比分析低砷和高砷含水层中沉积物砷的赋存形态与吸附特征。研究结果将有助于查明内陆盆地高砷地下水的形成机理,为合理开发可饮用地下水提供科学依据。
2. 研究区概况
河套盆地地处阴山隆起与鄂尔多斯台地之间,西界和北界均为狼山山前断裂,南界为鄂尔多斯北缘断裂,东界为乌梁素海断裂。研究区位于河套盆地西北侧,地处狼山山脉与主排干渠之间,包括山前冲洪积扇区和南部平原区,地理坐标为40°55′31″N~41°08′15″N,106°46′30″E~107°03′28″E(图1)。受沉积条件制约,研究区含水层具有明显的分带性。山前冲洪积扇区含水层沉积物主要由中砂、细砂组成,黏土在其中所占比重小于5%;平原区含水层沉积物主要由细砂、粉砂、粉质黏土和偶有泥炭夹层的淤泥质黏土组成,粉土和不同种类的黏土是其中的主要组成部分。
研究区浅层地下水受到大气降雨入渗补给、灌溉水补给和渠水的侧渗补给,深层地下水受到山前裂隙水的侧向补给和浅层地下水的垂向入渗。浅层地下水的排泄途径是蒸发作用、人工抽取、流入排干沟和垂向入渗到深层地下水,深层地下水的排泄路径是农业开采。原来研究区地下水流向大体是由西北向东南,但过度开采导致地下水流向逐渐转变为山前冲洪积扇由北向南、平原区由南向北的流动方向。地下水水化学类型受地势地貌、气候条件影响明显,具有显著的差异性。浅层地下水受强烈蒸发运移影响,水化学类型有HCO3−(Cl)−Na、Cl−HCO3−Na·Mg和Cl−SO4(HCO3)−Na·Mg型。深层地下水由山前冲洪积扇的Cl−HCO3−Ca·Mg型转变为平原区的Cl−Na型。高砷地下水主要分布在平原区(Zhang et al., 2020)。
3. 材料与方法
3.1 沉积物样品采集与测试
本研究从钻孔K02和K01中分别取出25和26个沉积物样品(图1)。其中,K2钻孔位于山前冲洪积扇区,坐标为41°01′07.37″N、106°57′41.41″E,钻孔深度约为80 m;K1钻孔位于平原区,位置坐标为41°00′13.73″N、106°58′16.85″E,钻孔深度约为81 m。获取的沉积物去掉外层沉积物后,马上用锡箔纸包裹,密封在装有纯N2(> 99.999%)的无菌塑料袋中,尽可能减少与O2的接触,并在−20℃的条件下保存。带回到实验室后,样品分装为两份,一份储存于−20℃的冰箱中,另一份进行冷冻干燥。
在色度分析和含水率测试之前,−20 ℃条件下保存的样品放入厌氧箱解冻。色度分析采用光谱色度计(CM-700d,Konica Minolta),测试之前对光谱色度计进行白板校正和零点校正。测试过程中保证切面平整,并在切口表面铺上一层高净度聚乙烯薄膜,每个样品测试3次。测试结束后计算出530 nm和520 nm的光谱反射差(R530-520),该差值能够指示沉积物的氧化还原环境(Horneman et al., 2004)。含水率测试采用通用的烘干法,用铝盒准确称取烘干前的原状土样质量,放入105℃恒温干燥箱中烘干后放入干燥器冷却,准确称量烘干后的土样质量,通过计算得出含水率。
沉积物电导率和pH的测量采用Bélanger and VanRees(2007)的方法。冷冻干燥后的沉积物与去离子水以1∶5的比例置于PE离心管中,25℃状态下以150 rpm转速震荡1 h。震荡完毕后,将离心管置于离心机中以5000 rpm转速离心20 min并取上清液用0.22 μm纤维滤膜过滤。所得部分滤液通过电导率仪(DDS-307A, SHKY)进行电导率的检测,所得电导率值可以反映出沉积物的可溶性组分含量。沉积物样品与超纯水以1∶2.5比例充分混合后,摇匀,静置1 h使用pH检测仪(HI 8424,HANNA)对其进行pH测定。
沉积物样品中的主量和微量元素的测定采用手持便携式XRF仪(XL3t800, Thermo Niton)进行测定,测试元素主要包括Ca、Sr、As、Fe和Mn。测试之前将样品冷冻干燥,并研磨至200目,取适量于专用测量杯中,压实后放置在手持XRF仪光源处,每个样品测试3次。2个标准物质(GBW07303,GBW07305)用于确保数据的准确性,测试偏差均小于20%,其中As元素的测试偏差均小于5%。
3.2 室内实验
3.2.1 分步提取实验
为查明沉积物中砷的赋存状态,本研究开展了分步提取实验(Sequential extraction procedure,SEP)。分步提取方法参照Eiche et al.(2008, 2010)的研究,该提取方法也是基于Keon et al.(2001)和Wenzel et al.(2001)等研究的改进(表1)。每个新鲜沉积物样称取0.5 g,放入离心管中,加入适量的提取剂。由于分步提取后提取液盐度较高,需稀释测试,这就要求测试仪器需要较低的检出限和较高的分析精度。ICP−MS的分析精度为±3.0%,检出限为0.01 μg/L,能够满足测试要求。其中分步提取第六步(F6)的提取液中含有高浓度的HF,会损坏仪器影响测试精度。因此,F6的提取液在测试之前,需要在电热板加热进行赶酸处理。
表 1 分步提取实验具体步骤Table 1. Sequential extraction procedure步骤 目标物 提取剂 条件 F1 弱吸附态砷 0.05 mol/L (NH4)2SO4 25 mL,25℃,4 h,重复一次,水洗一次 F2 强吸附态砷 0.5 mol/L NaH2PO4 40 mL,25℃,16 h及24 h各一次,每个时间段重复一次,水洗一次 F3 与可挥发硫化物、碳酸盐、锰氧化物和完全无定形态的铁氧化物或氢氧化物共存的砷 1 mol/L HCl 40 mL,25℃,1 h,重复一次,水洗一次 F4 与无定形态铁氧化物或氢氧化物共存的砷 0.2 mol/L NH4H2C2O3 40 mL,25℃,2 h,pH=3,黑暗条件下,重复一次,水洗一次 F5 与结晶态铁氧化物或氢氧化物
共存的砷0.5 mol/L NaC6H8O7
1 mol/L NaHCO3,Na2S2O4XH2O35 mL NaC6H8O7+2.5 mL NaHCO3(加热至85℃),加0.5 g Na2S2O4XH2O,15 min在85℃,重复一次,水洗一次 F6 与硅酸盐有关的砷 10 mol/L HF,H3BO3 40 mL,25℃,1 h、24 h、16 h后各加5 g硼酸,每个时间段重复一次,热水洗一次 F7 含砷硫化物,与硫化物和有机质
共沉淀的砷16 mol/L HNO3,30% H2O2 先加入10 mL HNO3,反应过后加入多次30%过氧化氢,加热,冷却后稀释到100 mL,离心、过滤、测试 3.2.2 解吸附实验
本研究从钻孔K02和K01各选取一个典型沉积物进行pH和反离子效应对砷的解吸附影响的批实验。该实验主要包括三部分内容:解吸附动力学实验、pH对解吸附影响的实验、反离子效应(Na/Ca0.5(M/M))对砷解吸附影响的实验。
(1)解吸附动力学实验
为查明砷解吸附达到平衡的时间,本研究开展了解吸附动力学实验。分别称取0.6 g新鲜沉积物放入厌氧瓶中,然后加入24 mL、125 mmol/L NaCl和1.5 mmol/L CaCl2的混合溶液,用橡胶塞封闭,整个过程在厌氧箱中操作,设置3个平行样。混合溶液离子强度约为130 mmol/L,Na/Ca0.5比值约为102,pH值为7.6。为保证沉积物颗粒与溶液均匀混合,超声15 min后放入150 r/min的恒温振荡箱中。取样间隔为1 h、3 h、5 h、7 h、10 h、14 h、20 h、28 h、36 h、48 h和60 h。取样之前保证溶液混合均匀,每次取样量为2 mL,用0.22 μm过滤器过滤到2 mL离心管中,放入4℃冰箱中保存,一周之内完成测试工作。
(2)pH对解吸附影响的实验
控制Na/Ca0.5(M/M)比值约为102和离子强度约为130 mmol/L,探究不同pH值对沉积物中砷解吸附的影响。将Na/Ca0.5比值为102的NaCl和CaCl2的混合溶液分装为5份,并将溶液pH值分别调到5.4、6.7、7.6、8.6和9.6。在5个厌氧瓶中,分别称取0.6g新鲜沉积物,并加入24 mL不同pH值梯度的NaCl和CaCl2的混合溶液,用橡胶塞封闭,整个过程在厌氧箱中操作,设置3个平行样。所有加入沉积物和混合溶液的厌氧瓶,超声15 min后放入150 r/min的恒温振荡箱中。60 h后取样,用0.22 μm过滤器过滤到离心管中,放入4℃冰箱中保存,一周之内完成测试工作。
(3)反离子效应对砷解吸附影响的实验
控制离子强度为(130±5)mmol/L,通过改变NaCl和CaCl2的浓度来改变Na/Ca0.5比值(表2)。在7个厌氧瓶中,分别称取0.6 g新鲜沉积物,并分别加入24 mL不同Na/Ca0.5比值梯度的NaCl和CaCl2的混合溶液,用橡胶塞封闭,整个过程在厌氧箱中操作,设置3个平行样。所有加入沉积物和混合溶液的厌氧瓶,超声15 min后放入150 r/min的恒温振荡箱中。60 h后取样,用0.22 μm过滤器过滤到离心管中,放入4℃冰箱中保存,一周之内完成测试工作。
表 2 离子强度为(130±5)mmol/L条件下,不同浓度NaCl和CaCl2混合液的Na/Ca0.5(M/M)比值Table 2. Na/Ca0.5(M/M) ratio of the mixed solution of different concentrations of NaCl and CaCl2 under the condition of ionic strength of about (130±5) mmol/LNaCl/(mmol/L) CaCl2/(mmol/L) Na/Ca0.5 2 43 0.3 5 42 0.7 10 40 1.6 30 35 5.0 60 23 13 110 7 42 125 1.5 102 4. 结果与讨论
4.1 沉积物的岩性特征
研究区的山前冲洪积扇区钻孔K02和平原区钻孔K01沉积物的岩性特征如图2所示。钻孔K02沉积物的组成是从粗砂到黏土,而钻孔K01主要从中砂到黏土。对于钻孔K02,14 m以上的沉积物主要由砂质黏土和粉质黏土组成,14~42 m主要以砂质含水层为主。在42~44 m存在约2 m厚的黏土层,42 m以下主要以砂质含水层为主同时伴有砂质黏土互层(图2a)。与钻孔K02不同,位于平原区的钻孔K01沉积物颗粒整体较细且含有大量的黏土互层。其中,8 m以上主要以黏土为主,8~40 m则主要以砂质含水层为主并且常常伴有砂质黏土互层,40~42 m出现黏土层,42 m以下为颗粒较细的细砂含水层,这个研究结果与Shen et al.(2018)一致。总体来看,研究区近表层沉积物主要以粉质黏土为主,地表以下10~40 m是砂质含水层,地表以下40 m处存在1~2 m厚的相对连续的黏土层将40 m以上和约42 m以下的含水层隔开。
沉积物的色度特征能够指示沉积物的氧化还原环境和铁氧化物的还原程度(Horneman et al., 2004)。钻孔K02和K01沉积物色度随深度的变化均是由浅黄色变为深灰色,说明深部含水层处于一个相对还原的环境当中,铁氧化物的还原程度也较强。而从整体来看,两个钻孔的色度特征有较大差异,相对于钻孔K02,钻孔K01的沉积物色度更深,这可能是因为平原沉积物颗粒较细,含水层处于更封闭的还原环境,铁锰氧化物的还原程度更强(van Geen et al., 2013)。
沉积物含水率主要受其岩性控制。两个钻孔表层5 m以上沉积物尽管颗粒较细,含水率仍然较低,主要由于其处于非饱和带。而在饱和带,沉积物含水率随深度的变化主要受岩性影响,沉积物岩性颗粒越细,含水率越高。两个钻孔沉积物电导率在近地表较高(图2),主要是因为研究区为干旱半干旱气候,蒸发蒸腾作用较强,使得近地表沉积物含有大量的可溶盐(Yuan et al., 2017)。沿深度随沉积物岩性的变化而波动,沉积物岩性越细,电导率越大,这是由于颗粒较细的黏土颗粒表面有大量可交换的离子。此外,由于钻孔K01位于平原区,沉积物颗粒整体较细且地下水水位埋深较浅蒸发作用强,导致其沉积物电导率(均值为395 μS/cm)大于钻孔K02(均值为308 μS/cm)。
4.2 沉积物的地球化学特征
研究区沉积物中0~10 m、40~45 m和75~80 m含水层位的Ca和Sr的含量明显高于其他含水层(图3)。微量元素As、Fe和Mn也有相似的分布特征。沉积物的岩性特征表明,10 m以上的沉积物主要以黏土和粉质黏土为主,40~45 m是不连续的黏土层,而75~80 m也是颗粒较细的黏土层。对比钻孔的黏土层和砂层沉积物的地球化学特征发现,K02钻孔黏土层沉积物Ca含量中值为53.6 mg/g,而砂层沉积物Ca含量中值为33.0 mg/g;K01钻孔中两者中值分别为48.3 mg/g和31.6 mg/g。黏土层和砂层沉积物中微量元素的含量差异更为明显,K02钻孔黏土层沉积物As含量中值为17.6 μg/g,而砂层沉积物As含量中值为8.6 μg/g;K01钻孔中两者中值分别为20.1 μg/g和7.9 μg/g。这主要是因为砂层沉积物中富含石英,含Ca和Sr矿物的含量低于黏土层(李晓峰,2018)。其次是因为黏土层表面吸附能力强,能够吸附As、Fe和Mn等微量元素(崔邢涛等,2015)。
两个钻孔沉积物的地球化学特征也有一定的差异。普遍表现为钻孔K02的Ca、Sr、As、Fe和Mn含量大于钻孔K01,且在深层沉积物中表现更为明显(图3)。钻孔K02沉积物中Ca的含量范围为12.2~86.9 mg/g,平均值为37.9 mg/g,钻孔K01沉积物中Ca的含量范围为9.6~68.7 mg/g,平均值为35.7 mg/g。K02钻孔沉积物中As的浓度范围为4.6~33.1 μg/g,平均值13.1 μg/g;K01钻孔沉积物中As的浓度范围为5.3~34.0 μg/g,平均值12.9 μg/g,表明冲洪积扇边缘地区沉积物总As的含量略大于平原区。两个钻孔沉积物中Fe和Mn含量的差异更为明显,钻孔K02沉积物中Fe的含量比K01高13.7%,其Mn的含量比K01高14.1%。这主要是由于钻孔K01位于平原区,沉积物经历了更强的风化作用,且积物颗粒整体较细,地下水流速慢,水岩作用强烈,有利于沉积物中化学组分向地下水中释放(张文凯等,2020)。此外,平原区含水层较为封闭,沉积物的色度特征也表明含水层长期处于较为还原的环境中,变价微量元素被还原为较低价态,易于向地下水中迁移。因此,钻孔K02和K01沉积物地球化学的微小差异主要受沉积环境和水动力条件控制。
4.3 沉积物中砷的赋存形态
山前冲洪积扇的含水层的沉积物岩性主要以中砂、细砂和黏土为主,平原区含水层的沉积物则以细砂、粉砂和黏土为主。因此,本研究从钻孔K02和K01各选取3个不同岩性的代表性沉积物用于分步提取实验(SEP)(表3)。实验过程选用GBW07303和GBW07305作为标准样品检验回收率,结果表明:对于GBW07303不同状态As的提取实验的回收率分别为81%,GBW07305不同状态As的提取实验的回收率分别为88%。分步提取实验获取的7种形态砷的总和与XRF测得的总固相砷的相对偏差均小于10%。
表 3 用于分步提取的沉积物信息Table 3. Sediment information for SEP编号 岩性 采样深度/m K02−M 中砂 38.35 K02−F 细砂 62.25 K02−C 黏土 41.95 K01−F 细砂 55.15 K01−S 粉砂 30.95 K01−C 黏土 37.85 分步提取结果表明,K02钻孔中砂、细砂和黏土沉积物固相砷主要以与可挥发硫化物、碳酸盐、锰氧化物和完全无定形态的铁氧化物或氢氧化物共存的砷(F4)为主,占比分别为33%、40%和43%(图4a、b、c)。其次是结晶态铁氧化物或氢氧化物结合态(F5)和强吸附态砷(F2)。砂层沉积物中与无定形态铁氧化物或氢氧化物结合的固相砷(F3)占比大于与硅酸盐结合的砷(F6),前者占比均大于10%,后者均小于5%,而黏土沉积物中两者的占比分别为7%和12%。最容易释放到地下水中的弱吸附态砷(F1)和最顽固的与硫化物和有机质共沉淀的固相砷(F7)占比较小,均低于5%。钻孔K01细砂沉积物的固相砷以F4为主(35%),其次分别是F2(32%)和F6(16%)(图4d)。粉砂和黏土沉积物则以F2为主(分别为43%和40%),其次以F4为主(分别为12%和18%);两个沉积物中F3所占的比例均超过10%(图4e、f)。细砂、粉砂和黏土沉积物中F1和F7均小于5%。
对比山前冲洪积扇的钻孔K02和平原区的钻孔K01发现,前者沉积物中固相砷主要以F4为主,后者则主要以F2为主。钻孔K02黏土沉积物中F4达到11.3 μg/g,明显高于K01的4.6 μg/g。而钻孔K02黏土沉积物中F2仅有5.8 μg/g,低于钻孔K01的10.3 μg/g(图4c、f)。钻孔K01砂层沉积物中的F2也明显大于K02。此外,平原区沉积物的F3含量也大于山前冲洪积扇沉积物。这说明平原区沉积物经历更强的风化侵蚀作用后,固相砷活性增强,向更具迁移性的吸附态和完全无定形铁氧化物或氢氧化物结合态转化。大量研究表明吸附态的砷迁移性较强,通过竞争解吸附或者弱碱条件下的解吸附,更容易释放到地下水中,而无定形态铁氧化物或氢氧化物结合态砷相对稳定,需要通过还原性溶解才能释放到地下水中(Smedley and Kinniburgh, 2002)。这也解释了为何平原区地下水砷浓度普遍高于山前冲洪扇的地下水(李晓峰,2018; Zhang et al., 2020)。除了含水层沉积物本身物源的影响,含水层所处的环境和地下水的化学特征也会影响砷的解吸附。
4.4 砷的解吸附
以往的研究表明,研究区地下水pH和Na/Ca0.5(M/M)与砷浓度均有较好的正相关关系(Zhang et al., 2020),因此,本研究选取钻孔K02和K01的沉积物(表3),分别探讨了pH和Na/Ca0.5(M/M)对砷解吸附的影响。动力学实验结果表明,在pH为7.6、离子强度为130 mmol/L和Na/Ca0.5比值为102的条件下,砷解吸附能够48 h时基本达到平衡(图5a)。为确定砷解吸附达到平衡,实验设定反应时间为60 h。
4.4.1 pH的影响
实验设定离子强度为130 mmol/L,Na/Ca0.5比值为102。pH条件分别设定为5.4、6.7、7.6、8.6和9.6。当pH为5.4时,K02−F和K01−F沉积物释放的砷占总吸附砷的比值分别为0.54和0.44;当pH升高至6.7时,砷释放量所占总吸附砷比值分别降为0.32和0.30(图5b),这可能是因为较低的pH可能使铁氧化物发生少量溶解导致砷的释放。pH从6.7上升至8.6的过程中,沉积物砷的释放量并没有明显增加,仅上升0.03左右。而pH由8.6上升至9.6,沉积物砷的释放量显著增加,释放量上升0.15。这是由于随着pH升高沉积物颗粒表面带负电荷,与含砷阴离子形成静电斥力导致吸附态的砷发生解吸附,进入水溶液中(Masue et al., 2007)。
4.4.2 反离子效应的影响
许多学者认为,沉积物颗粒表面存在扩散双电子层(Dzombak and Morel, 1990; 刘新敏,2014),相比于以Na+为主的地下水系统,以Ca2+为主的地下水系统能够导致带负电的沉积物颗粒表面与带负电的含砷弱阴离子之间的斥力减小,有利于砷的吸附,这种现象被称为反离子效应(Masue et al., 2007; Fakhreddine et al., 2015)。当水中离子强度一定时,带有两个正电荷Ca2+被单电荷Na+替换时,即Na/Ca0.5比值增加时,这种反离子效应就会减弱,促进吸附态的砷释放到地下水中。
实验过程中保持pH和离子强度不变,通过调节溶液中Na+和Ca2+浓度改变Na/Ca0.5比值。结果表明,砷解吸附的量随Na/Ca0.5比值的增加而增加(图5c)。当Na/Ca0.5比值为0.3时,K02−F和K01−F沉积物砷的解吸附量占总吸附态砷的比值分别为0.12和0.11。而当Na/Ca0.5比值增加到102时,K02−F沉积物砷的解吸附量占总吸附态砷的比值能够达到0.37,在K01−F沉积物中这一比值为0.47。
4.5 地下水开发利用建议
河套盆地是中国的塞上粮仓,对水资源的需求较大。研究区地势较高,引黄河入河套盆地并难以满足居民的农业和生活需求,因此,居民普遍开采地下水用于农业灌溉和日常生活,这虽然解决水量的问题,却忽视了原生劣质地下水的危害。根据国家《生活饮用水卫生标准》(GB 5749—2022)和《地下水质量标准》(GB/T14848—2017),砷浓度大于10 μg/L的地下水为高砷地下水,摄入后对人体有害。以往的研究发现高砷地下水主要集中在平原区,浓度高达857 μg/L(Guo et al., 2008)。本研究发现,山前冲洪积扇区的含水层沉积物固相砷相对稳定,而平原区的含水层沉积物固相砷迁移性相对较强,且平原区沉积物吸附态砷在弱碱性和高Na/Ca0.5摩尔比值条件下,容易向地下水迁移,导致砷的富集。因此,当地居民种植农作物时避免使用碱性复合肥,从而减少碱性水的向下补给。此外,生活污水中Na+较高,建议适当处理后排放。用于日常生活的地下水,建议采用混凝沉淀或吸附法降砷。
5. 结 论
山前冲洪积扇区含水层处于相对氧化的环境中,其沉积物以细砂和中粗砂为主,而平原区含水层处于封闭的还原环境中,沉积物以粉细砂为主。两者沉积物总固相砷含量相差不大,但固相砷的赋存形态差别较大。山前冲洪积扇区含水层沉积物固相砷以与可挥发硫化物、碳酸盐、锰氧化物和完全无定形态的铁氧化物或氢氧化物共存的砷为主(33%~43%),平原区含水层沉积物固相砷则以强吸附态砷为主(32%~43%),后者沉积物的中固相砷迁移性更强,容易通过解吸附释放到地下水中。此外,当pH值由6.1上升到9.6时,山前和平原区沉积物解吸附砷占总吸附砷的比值分别上升0.16和0.22。同时,Na/Ca0.5摩尔比值的增加,会导致反离子效应减弱,比值由0.3增加到102时,山前沉积物和平原区解吸附砷占总吸附砷的比值分别上升0.26和0.36。可见含水层中pH的升高和Na/Ca0.5摩尔比值的增加,都会促使沉积物中的砷发生解吸附,导致地下水中砷的富集。因此,当地居民应减少碱性以及富含Na+的生产生活用水的排放,同时平原区用于日常生活的地下水,建议当地居民采用混凝沉淀或吸附法降砷。
1 ➊四川省核工业地质局二八二大队. 2018. 川东北铀、石墨矿远景调查报告[R].2 ➋核工业部西南地勘局二八〇研究所. 1985. 新华向斜南翼东段铀矿化特征及形成条件[R].3 ➌四川省核工业地质局二八二大队. 1981. 三〇二地区铀矿普查区域评价报告[R]. -
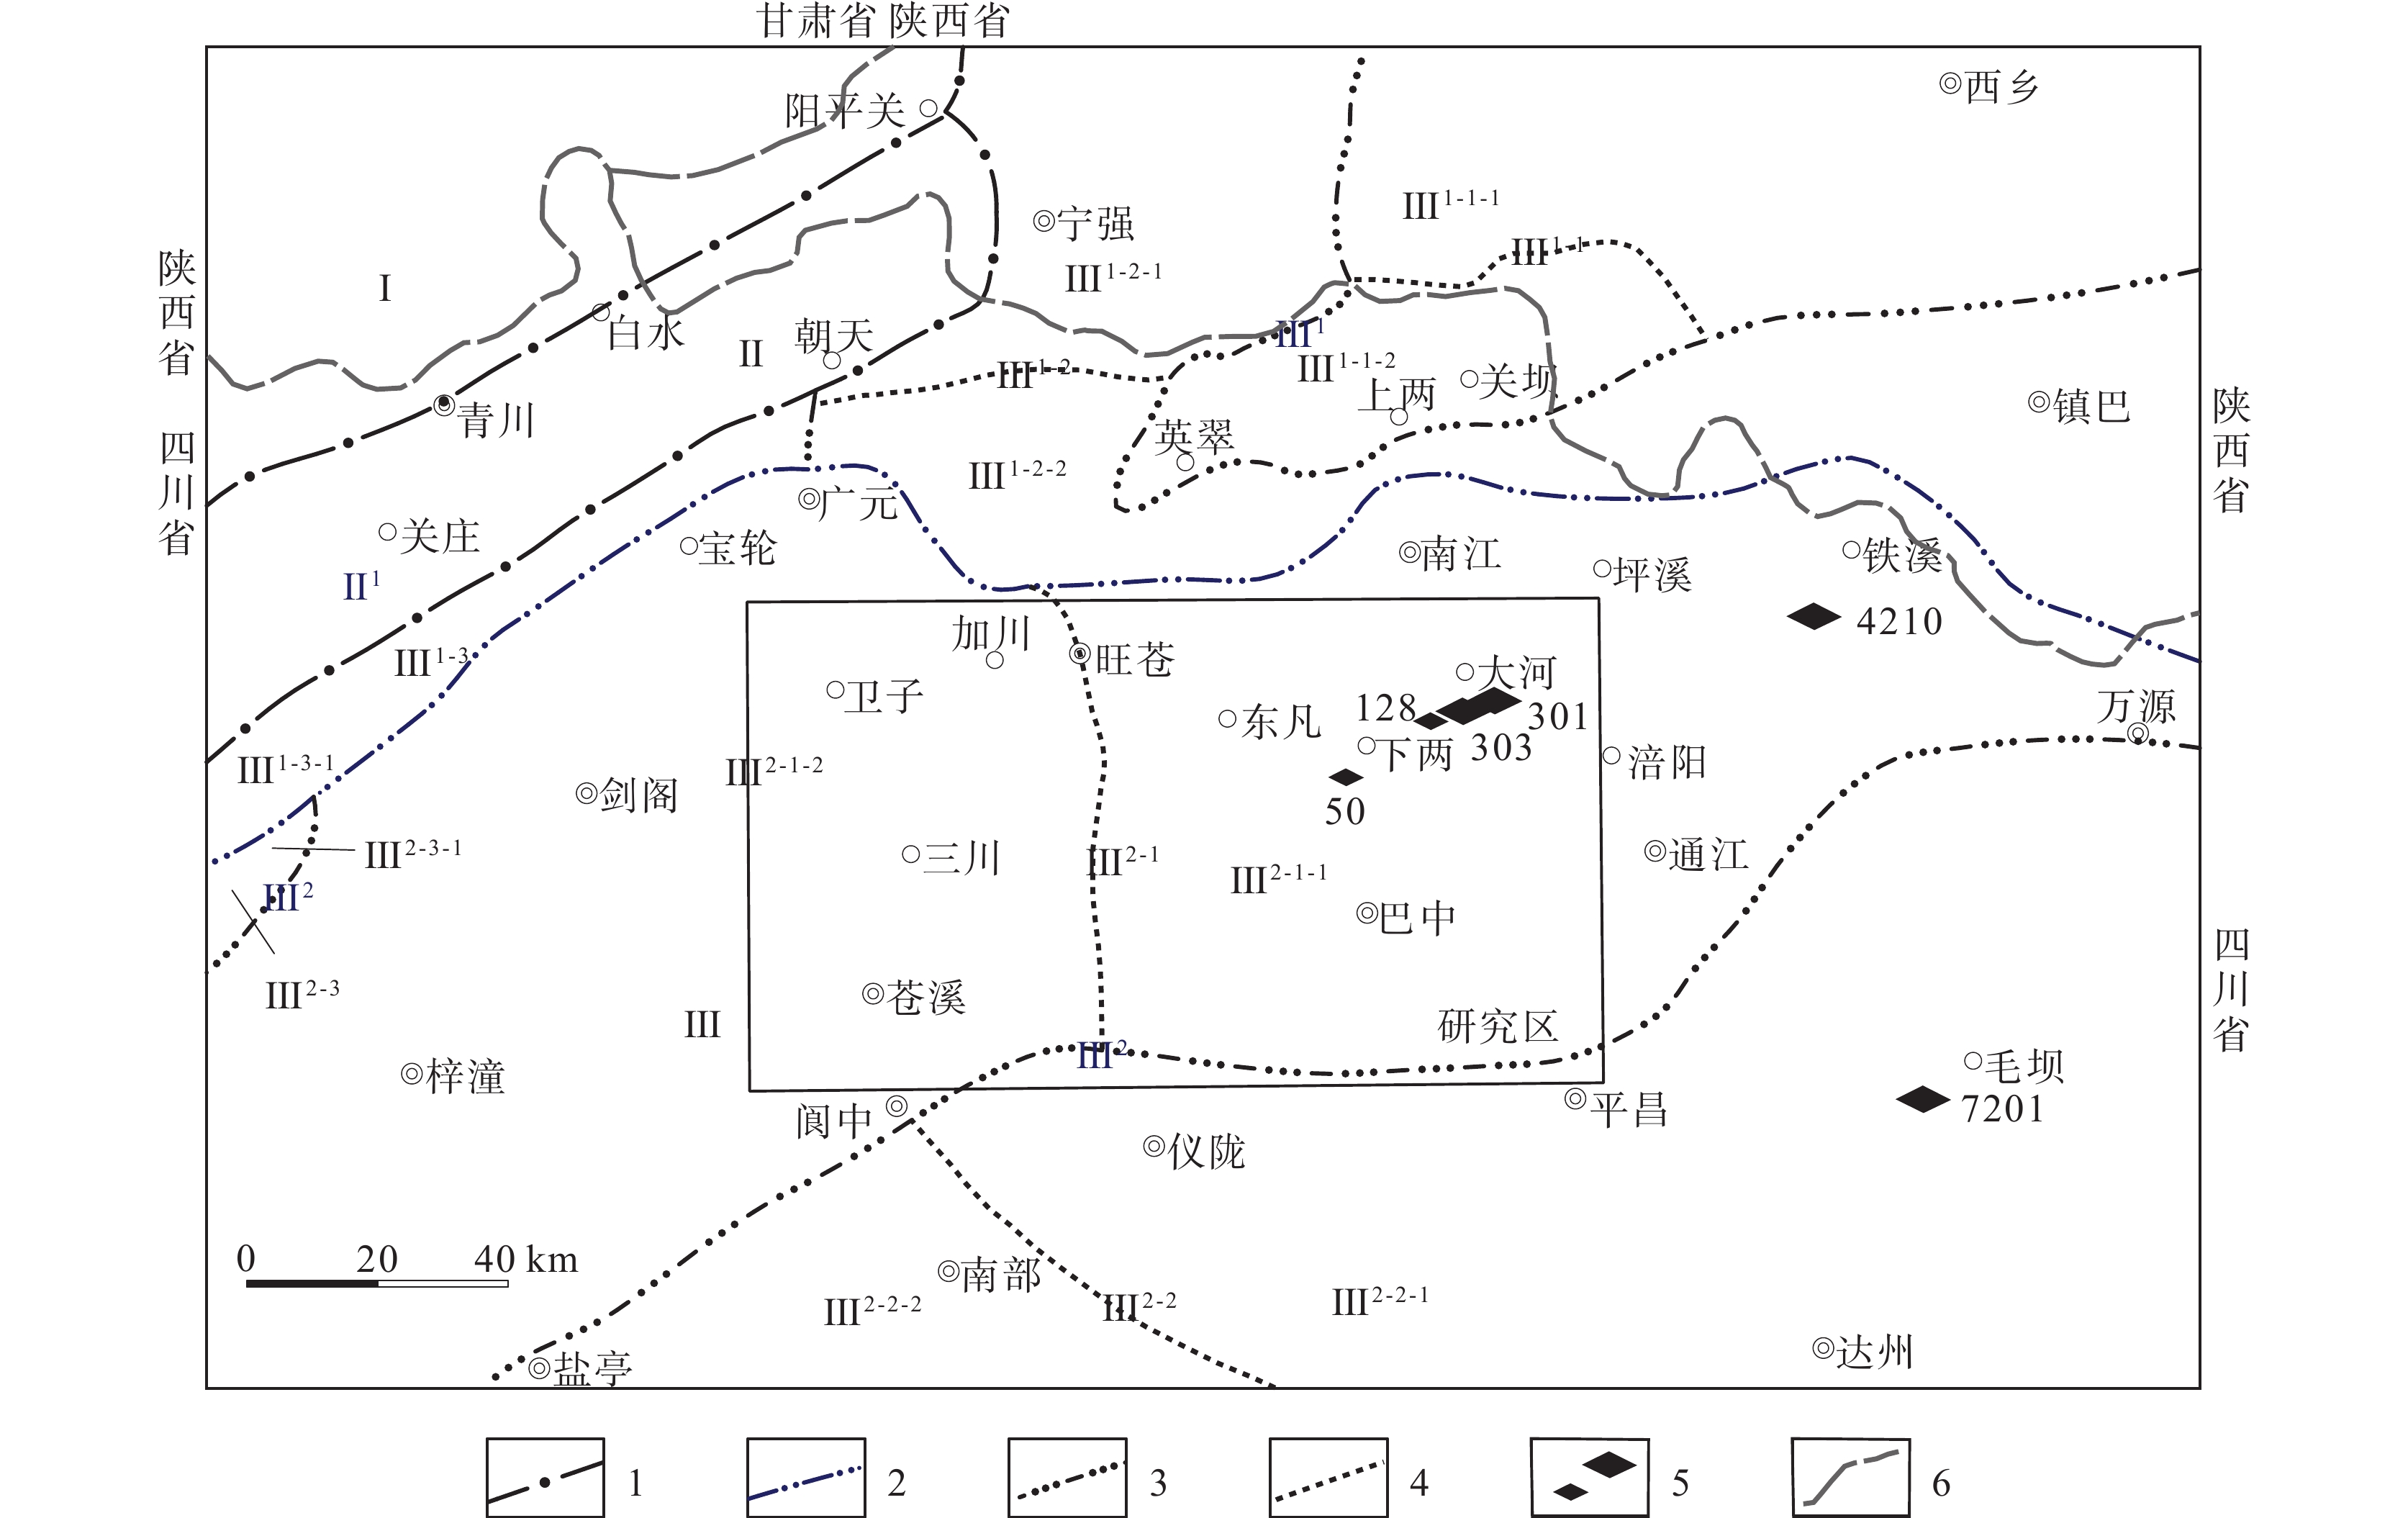
图 1 研究区大地构造位置图
1 1—一级构造单元界线;2—二级构造单元界线;3—三级构造单元界线;4—四级构造单元界线;5—铀矿床和铀矿点;6—省界;Ⅰ—秦岭地槽褶皱系;Ⅱ—松潘甘孜地槽褶皱系;Ⅱ1—龙门山褶皱带;Ⅲ—杨子准地台;Ⅲ1—大巴山龙门山台缘凹陷;Ⅲ1-1—汉南元古拱起;Ⅲ1-1-1—汉中凸起;Ⅲ1-1-2—米仓山凸起;Ⅲ1-2—宁镇古台陷;Ⅲ1-2-1—宁强台凹;Ⅲ1-2-2—大两会台褶束;Ⅲ1-3—广元名山边缘凹陷;Ⅲ1-3-1—白石凹褶束;Ⅲ2—四川台坳;Ⅲ2-1—川北台陷;Ⅲ2-1-1—通江台凹;Ⅲ2-1-2—梓潼台凹;Ⅲ2-2—川中台拱;Ⅲ2-2-1—达县台穹;Ⅲ2-2-2—盐亭台穹;Ⅲ2-3—川西台陷;Ⅲ2-3-1—江油穹褶束
Figure 1. Geotectonic map of study area
1 1–First order tectonic unit boundary; 2–Second order tectonic unit boundary; 3–Third order tectonic unit boundary; 4–Fourth order tectonic unit boundary; 5–Uranium deposit and uranium ore occurrence; 6–Provincial boundary;Ⅰ–Qinling geosyncline fold system;Ⅱ–Songpan–Ganzi geosyncline fold system; Ⅱ1–Longmenshan fold belt; Ⅲ–Yangzi paraplatform; Ⅲ1–Dabashan–Longmenshan platform margin depression; Ⅲ1-1–Arch of Proterozoic in Hannan; Ⅲ1-1-1–Hanzhong bulge; Ⅲ1-1-2–Micangshan bulge; Ⅲ1-2–Ningzhen ancient platform subsidence; Ⅲ1-2-1–Ningqiang platform depression; Ⅲ1-2-2–Dalianghui platform fold bundle; Ⅲ1-3–Guangyuan–Mingshan edge depression; Ⅲ1-3-1–Baishi depression fold bundle; Ⅲ2–Sichuan platform depression; Ⅲ2-1–North Sichuan platform subsidence; Ⅲ2-1-1–Tongjiang platform depression; Ⅲ2-1-2–Zitong platform depressionⅢ2-2–Central Sichuan platform arch; Ⅲ2-2-1–Daxian platform dome; Ⅲ2-2-2–Yanting platform dome; Ⅲ2-3–Western Sichuan platform subsidence; Ⅲ2-3-1–Jiangyou dome fold bundle
图 2 研究区地质图
1—下白垩统七曲寺组;2—下白垩统白龙组;3—下白垩统苍溪组;4—上侏罗统蓬莱镇组;5—中侏罗统遂宁组;6—中侏罗统沙溪庙组和千佛岩组、下侏罗统白田坝组;7—三叠系;8—二叠系;9—元古界—志留系;10—整合接触界线;11—不整合接触界线;12—逆断层;13—圈闭构造;14—背斜轴线;15—向斜轴线;16—铀矿床及编号;17—铀矿点及编号;18—研究区范围
Figure 2. Geological map of study area
1–Qiqusi Formation of Lower Cretaceous; 2–Bailong Formation of Lower Cretaceous; 3–Cangxi Formation of Lower Cretaceous; 4–Penglaizhen Formation of Upper Jurassic; 5–Suining Formation of Middle Jurassic; 6–Shaximiao Formation and Qianfoyan Formation of Middle Jurassic, Baitianba Formation of Lower Jurassic; 7–Triassic; 8–Permian; 9–Proterozoic–Silurian; 10–Conformity boundary; 11–Unconformity boundary; 12–Reverse fault; 13–Trap structure; 14–Anticline axis; 15–Syncline axis; 16–Uranium deposit and number; 17–Uranium ore occurrence and number; 18–The study area
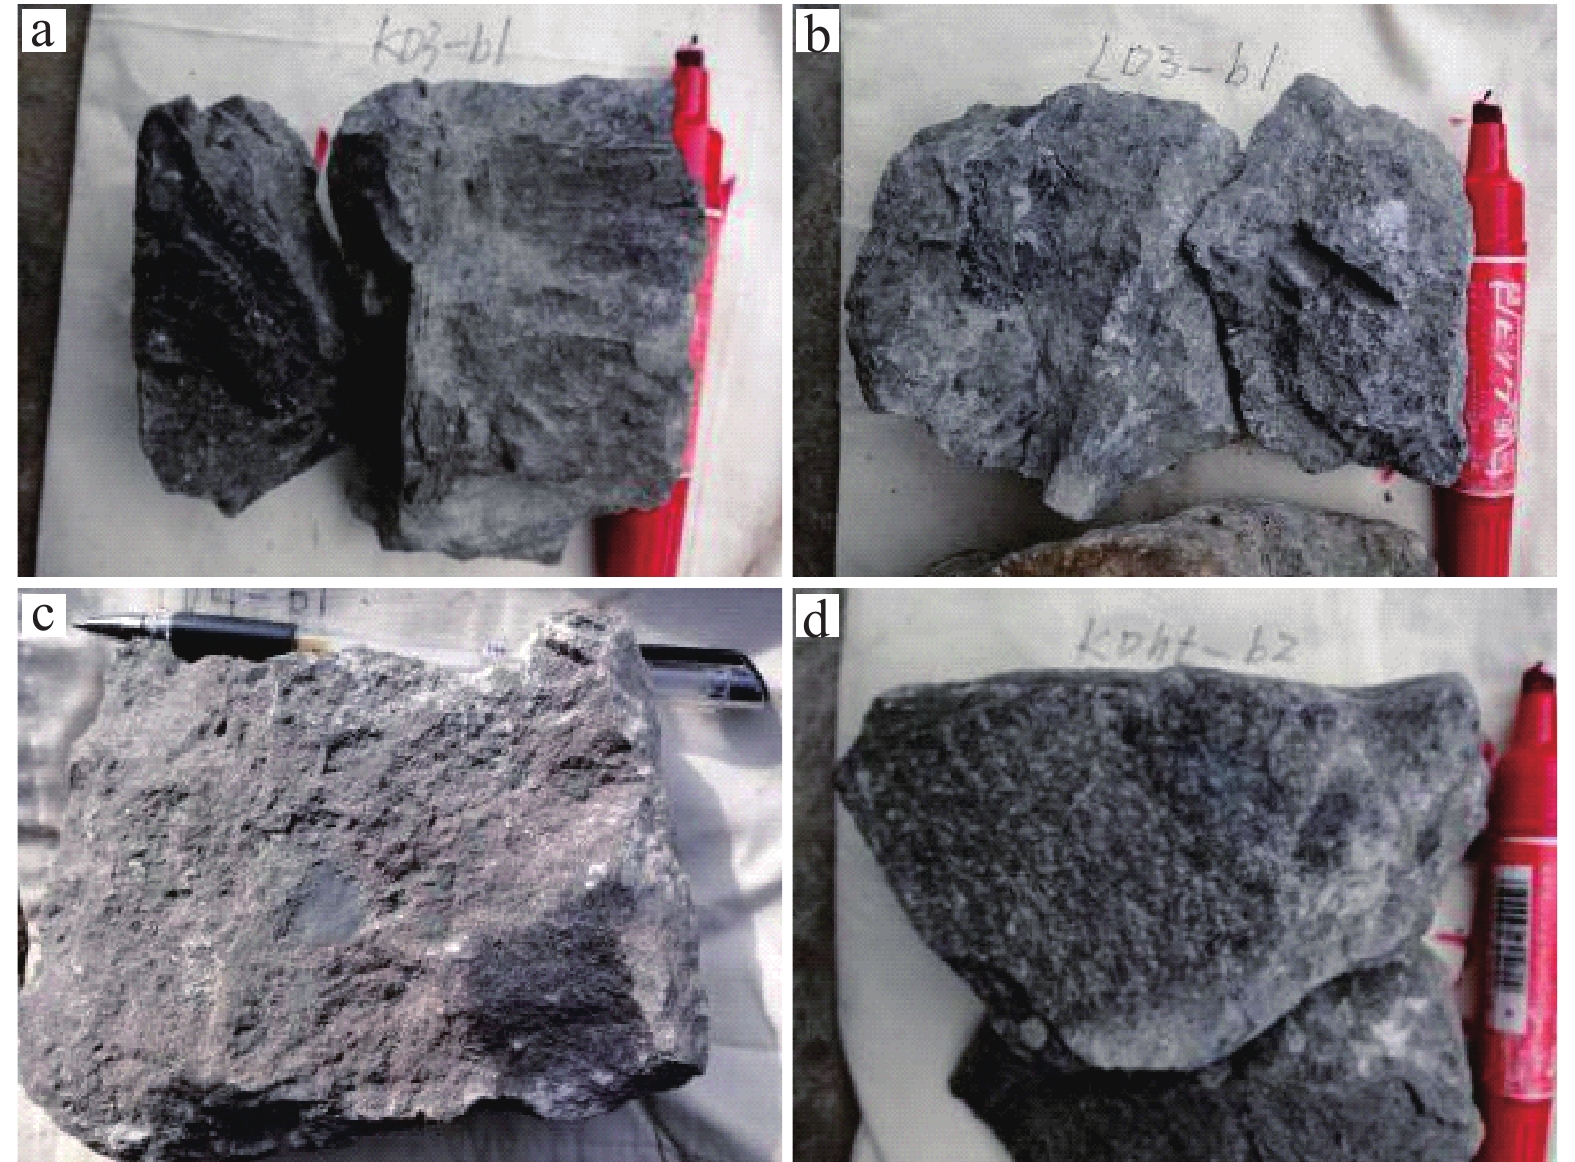
图 3 典型样品照片
a—含黄铁矿和碳化植物碎屑钙质胶结细砂岩(301范家山铀矿床,KD3–b1);b—含钙质结核的钙质胶结细砂岩(128桅杆树铀矿点,LD3–b1);c—含钙质团块的钙质胶结细砂岩,岩石弱氧化,有较多氧化物斑点(128桅杆树铀矿点,LD4–b1);d—钙质胶结中粒砂岩(50黑滩铀矿点,KDht–b2)
Figure 3. Photos of typical samples
a–Calcareous cementation fine sandstone containing pyrite and clastic carbonized plant (301 Fanjiashan uranium deposit, KD3–b1); b–Calcareous cementation fine sandstone with calcareous concretion (128 Weiganshu uranium ore occurrence, LD3–b1); c–Calcareous cementation fine sandstone with calcareous lump, rocks is weakly oxidized with more oxide spots (128 Weiganshu uranium ore occurrence, LD4–b1); d–Calcareous cementation medium grained sandstone (50 Heitan uranium ore occurrence, KDht–b2)
图 4 铀矿石偏光显微镜和电子探针图
a—钙质胶结中粒砂岩,碎屑以石英及岩屑为主,被方解石呈孔隙式–基底式胶结(KDht−b2);b—钙质胶结中细粒砂岩,斜长石碎屑具聚片双晶及弱水云母化,其右下角为石英绢云母片岩(KD3−b2−2);c—具格子双晶的微斜长石碎屑,其上为具聚片双晶的斜长石碎屑(KDht−b2);d—斜长石碎屑,具聚片双晶(KD3−b2);e—显微条纹长石碎屑,其中较亮的为钠长石条带(LD3−b1);f—锆石碎屑,磨圆较好(LD4−b1);g—电气石碎屑(LD4−b1);h—具霏细结构的火山岩碎屑(KD3−b2);i—具流动构造的流纹岩碎屑(KD3−b2);j—岩石中含许多碳酸盐矿物细粒集合体团块,多呈球形或椭球形,为钙质结核,钙质结核之间为钙质胶结的细砂岩(LD3−b1);k—黄铁矿细粒集合体团块(KD3−b1);l—网脉状的重晶石交代石英(LD3−b1)
Figure 4. Polarizing microscope and electron probe image of uranium ore
a–Calcareous cementation medium grained sandstone, the clastics are mainly quartz and lithic fragments, and cemented by calcite in porous−basal type (KDht−b2); b–Calcareous cementation medium–fine–grained sandstone, clastic plagioclase with polysynthetic twin and weak hydromicatization, and the lower right corner is quartz sericite schist (KD3−b2−2); c–Clastic microcline with tartan twinning, on which is clastic plagioclase with polysynthetic twin (KDht−b2); d–Clastic plagioclase with polysynthetic twin (KD3−b2); e–Microscopic clastic perthite, in which the brighter is albite strip (LD3−b1); f–Clastic zircon, better roundness (LD4−b1); g–Clastic tourmaline (LD4−b1); h–Volcanic rock clastics with felsitic texture (KD3−b2); i–Rhyolite clastics with flow structure (KD3−b2); j–Rocks contain many fine−grained aggregates of carbonate minerals, mostly spherical or ellipsoidal, with calcareous cementation, and fine sandstone with calcareous cementation between calcareous concretion (LD3−b1); k–Fine–grained aggregates of pyrite (KD3−b1); l–Reticulate barite metasomatic quartz (LD3−b1)
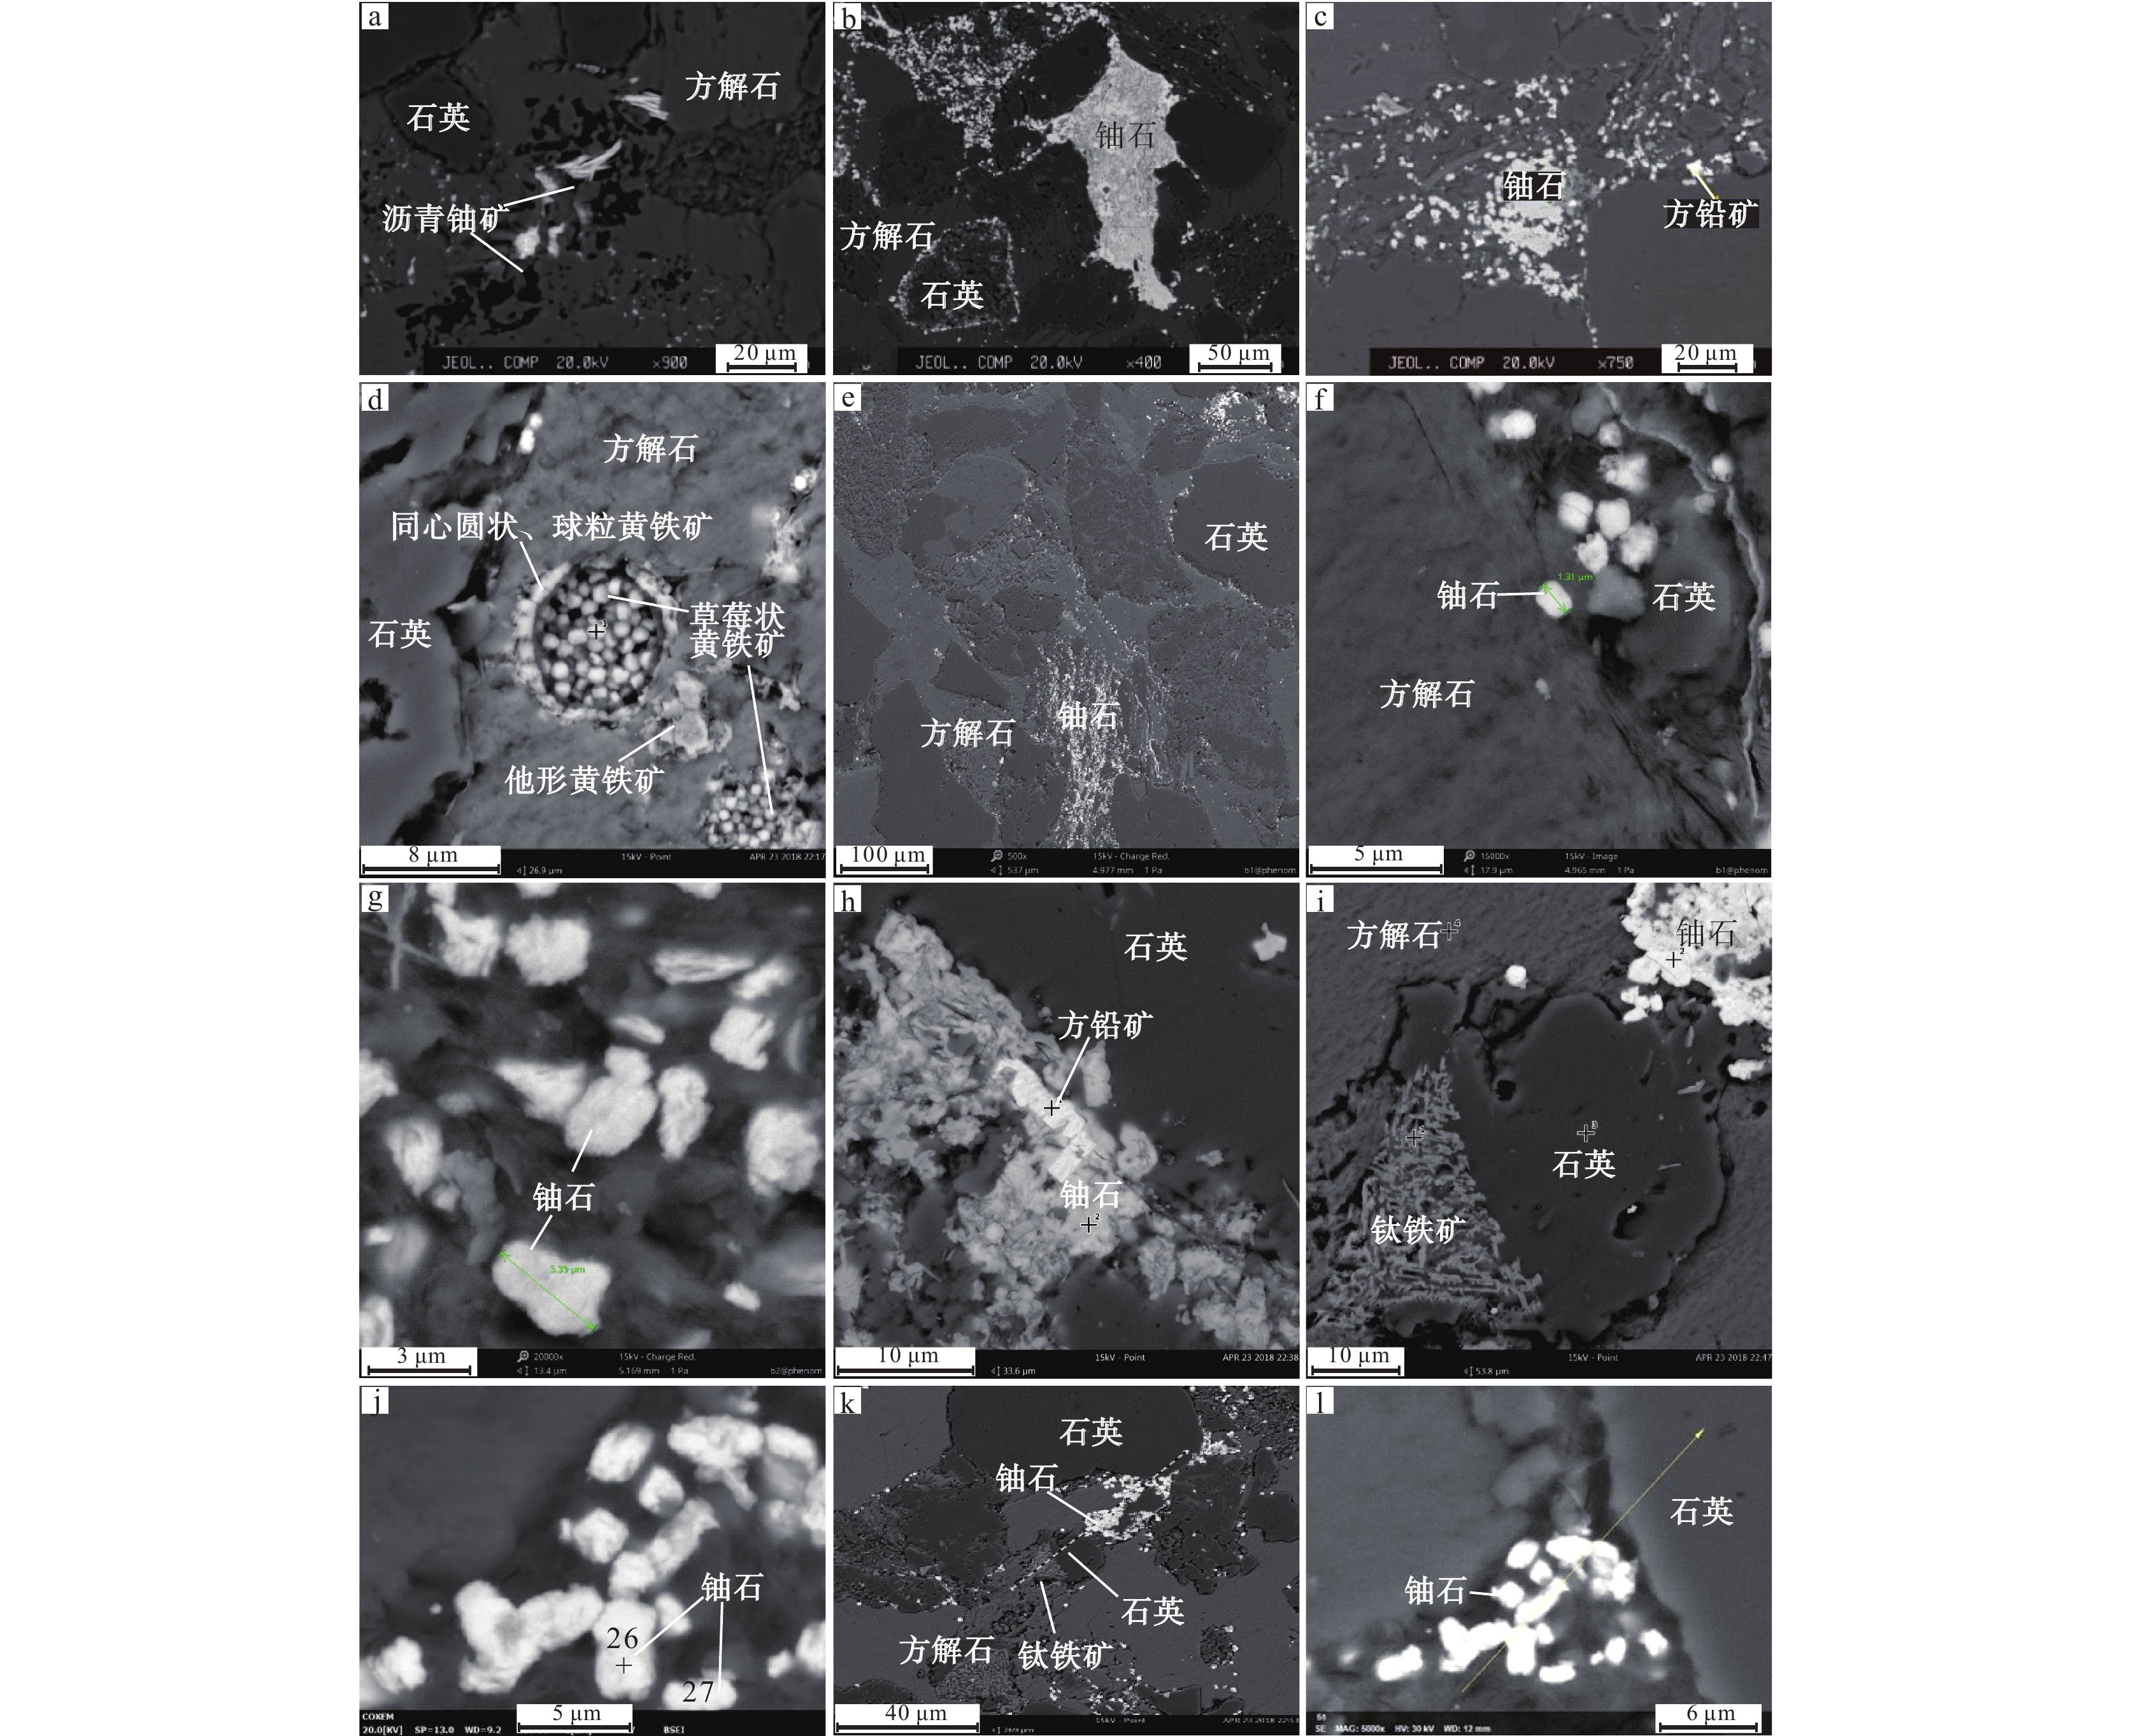
图 5 铀矿石电子探针和扫描电镜图
a—亮的部分均为沥青铀矿(LD4−b1−1,电子探针背散射图像);b—铀石位于石英和方解石粒间(KD3−b1−3,电子探针背散射图像);c—铀石位于粒间(KDht−b2−1,电子探针背散射图像);d—草莓状黄铁矿被方解石嵌布和包裹(KD3−b1−2,二次电子图像);e—粒状铀石位于石英和方解石粒间,且分布不均匀(KD3−b1,二次电子图像);f—短柱状铀石位于石英和方解石粒间,测得铀石粒径1.31 μm(KD3−b1,二次电子图像);g—铀石呈他形到半自形柱状,测得最大粒径3.39 μm(KDht−b2,二次电子图像);h—他形半自形的铀石和立方体状的方铅矿位于石英粒间(KDht−b2−2,二次电子图像);i—自形柱状铀石和网状钛铁矿位于石英边缘方解石胶结物中(KDht−b2−3,二次电子图像);j—铀石呈自形柱状(KDht−b2−COXEM−6,电子探针背散射图像);k—胶结物为方解石,能谱线扫描从左到右的矿物为钛铁矿、石英、铀石和石英(KDht−b2−4,二次电子图像);l—能谱线扫描从左往右的矿物为铀石和石英,铀石为自形柱状(KDht−b2−COXEM−11,二次电子图像);“+”和数字表示测点位置及编号,数据见表2和表4
Figure 5. Electronic probe and scanning electron microscope image of uranium ore
a–The bright parts are pitchblende (LD4−b1−1, back−scattered image of electron probe); b–Coffinite is located between the quartz and calcite grains (KD3−b1−3, back−scattered image of electron probe); c–Coffinite is located between grains (KDht−b2−1, back−scattered image of electron probe); d–Strawberry pyrite embedded and wrapped by calcite (KD3−b1−2, secondary electron image); e–Ranular coffinite is distributed unevenly between quartz and calcite grains (KD3−b1, secondary electron image); f–Short columnar coffinite is located between quartz and calcite grains with a particle size of 1.31 μm (KD3−b1, secondary electron image); g–Coffinite is in the shape of xenomorphic−hypidiomorphic columnar with a maximum particle size of 3.39 μm (KDht−b2, secondary electron image); h–Xenomorphic−hypidiomorphic coffinite and cubic galena are located between the quartz grains (KDht−b2−2, secondary electron image); i–Euhedral columnar coffinite and reticular ilmenite are located in the calcite cement at the edge of quartz (KDht−b2−3, secondary electron image); j–Coffinite is euhedral columnar (KDht−b2−COXEM−6, back−scattered image of electron probe); k–The cement is calcite, and the minerals from left to right are ilmenite, quartz, coffinite and quartz by energy spectral line scanning (KDht−b2−4, secondary electron image); l–The minerals from left to right in the energy spectrum line scan are coffinite and quartz, and coffinite is euhedral columnar (KDht−b2−COXEM−11, secondary electron image); “+” and the number indicate the location of the measuring point and number, the data are shown in Table 2 and Table 4
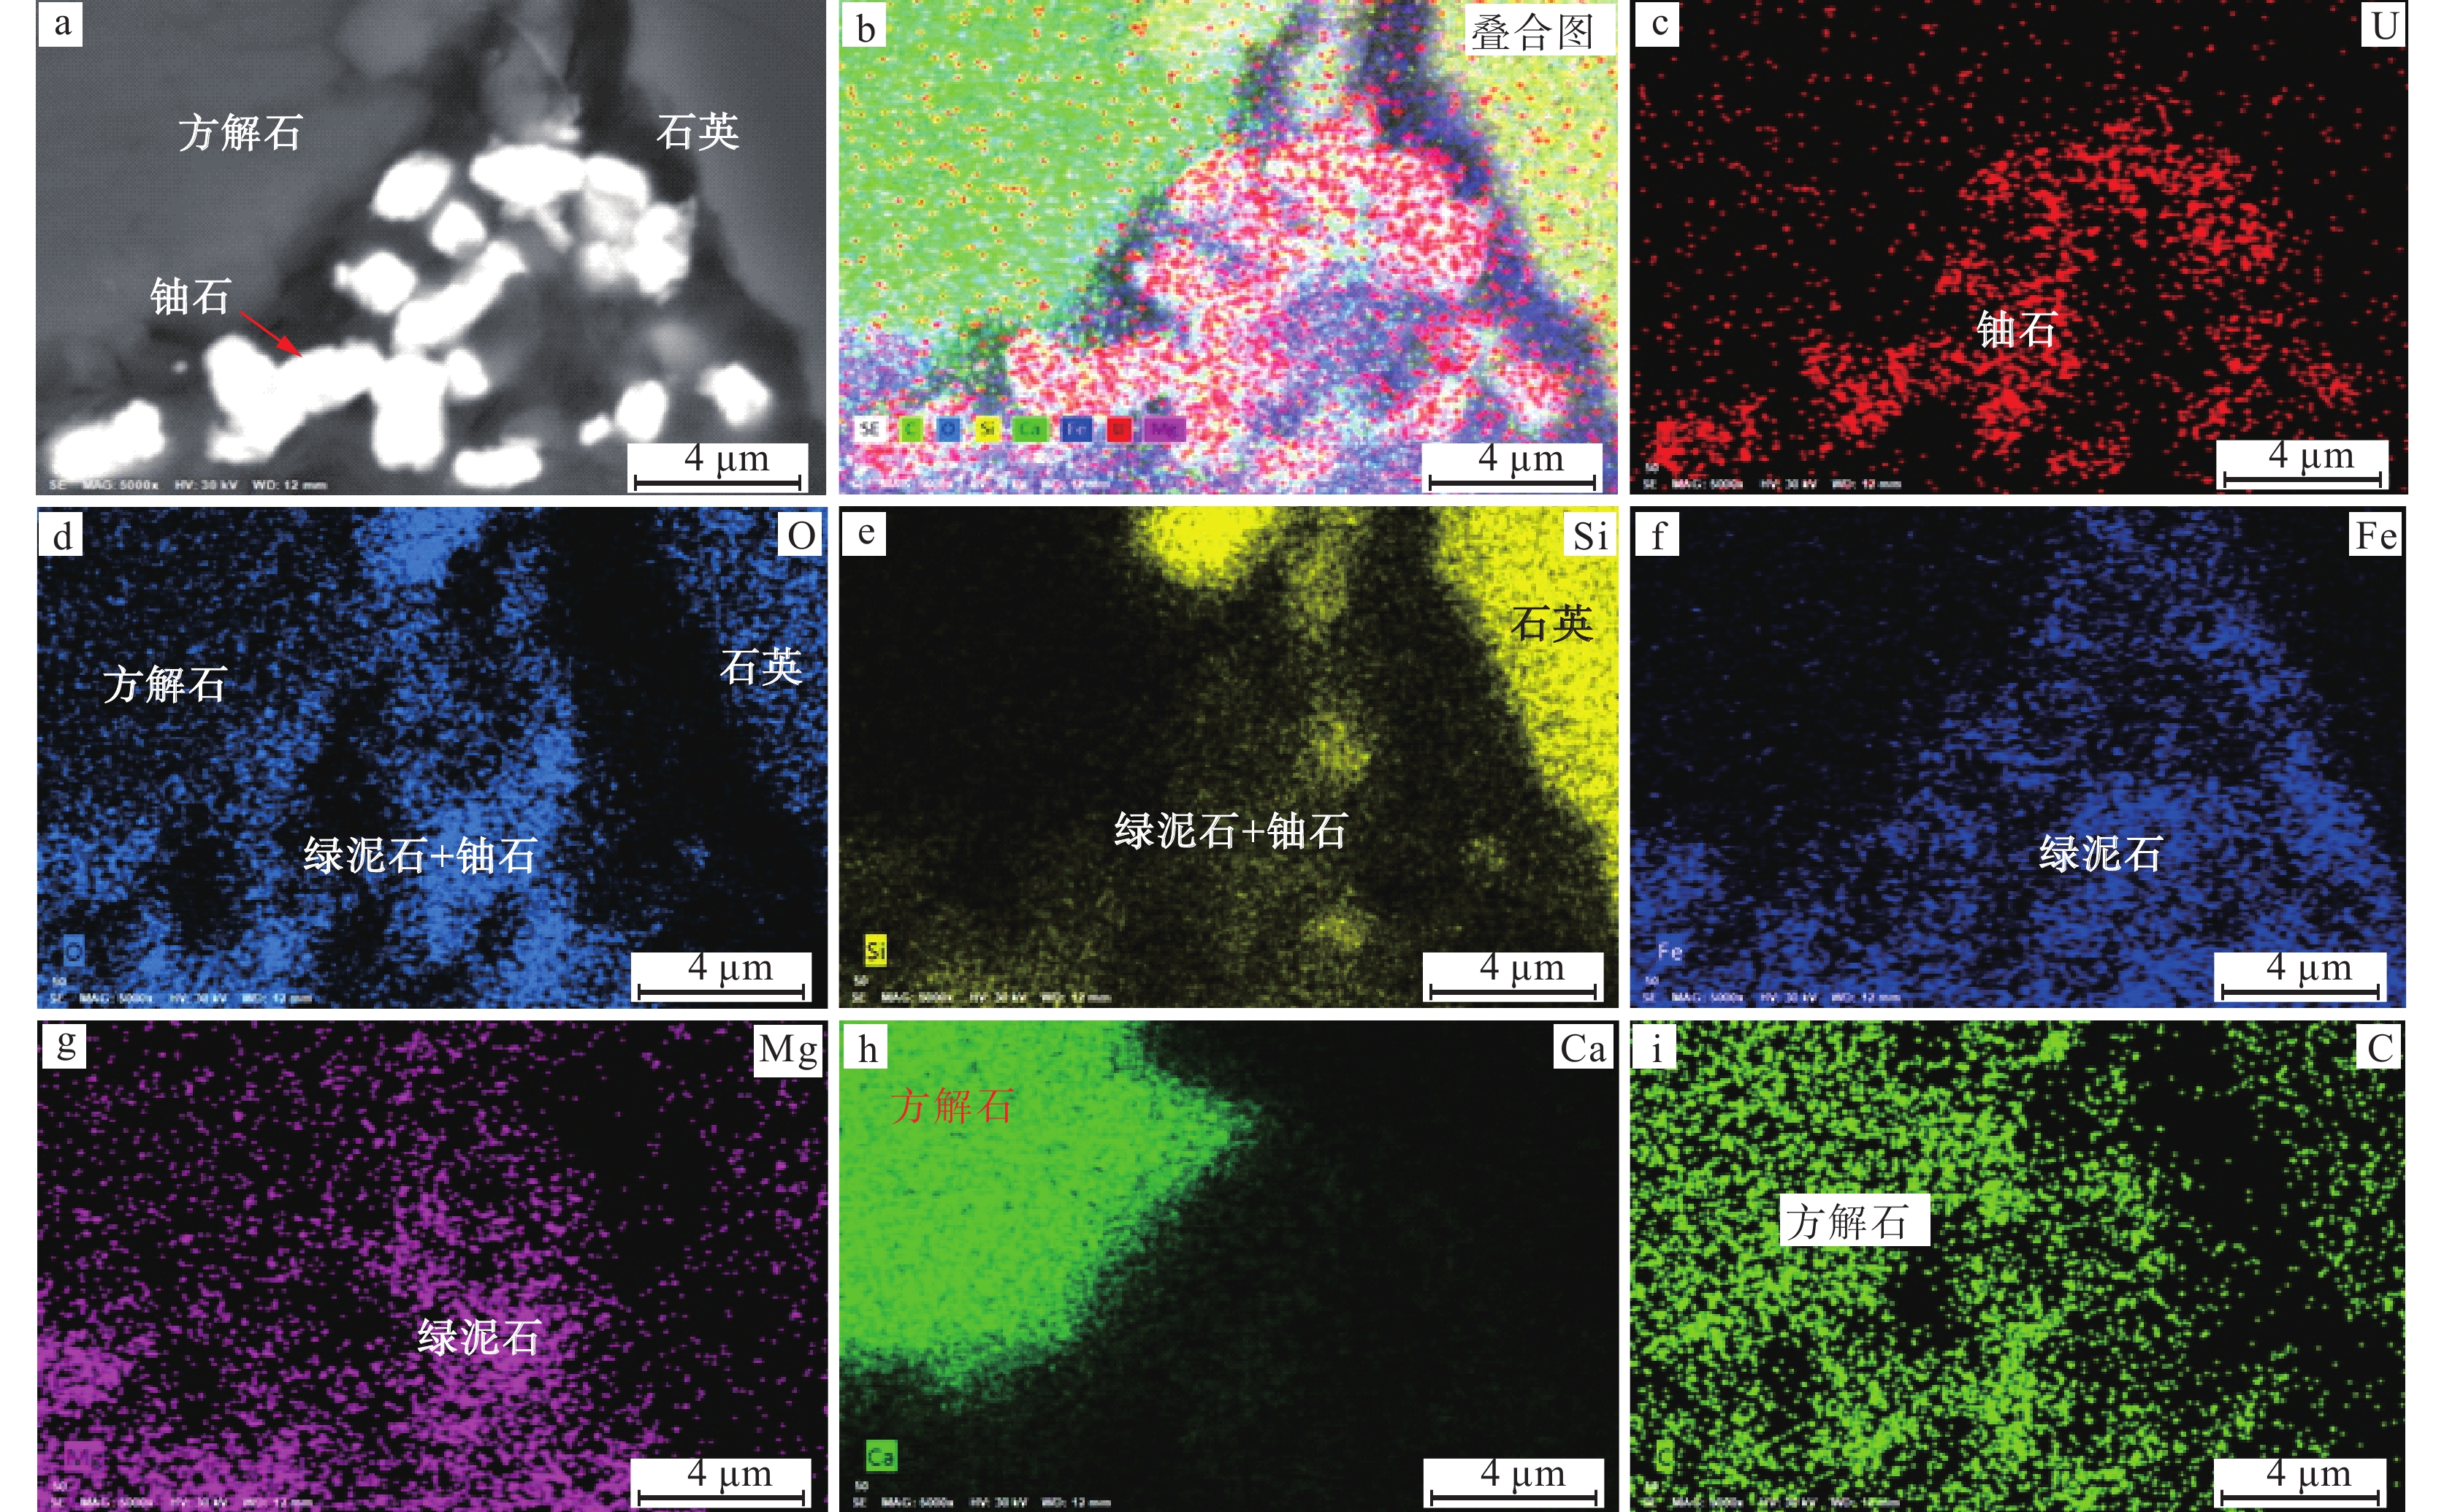
图 6 50铀矿点铀矿石能谱面扫描图
a~i—自形柱状铀石位于方解石和石英粒间,铀石粒间为铁镁硅酸盐矿物绿泥石和少量方解石充填;a—KDht−b2−COXEM−11,二次电子图像;b—U–O–Si–Fe–Mg–Ca–C元素叠合图;c~i—分别为U、O、Si、Fe、Mg、Ca、C元素能谱面扫描图
Figure 6. Scanning image of uranium ore energy spectrum surface of 50 uranium ore occurrence
a–i–Euhedral columnar coffinite is located between calcite and quartz grains, coffinite grains are filled with iron−magnesium silicate mineral chlorite and a small amount of calcite; a–KDht−b2−COXEM−11, secondary electron image; b–U–O–Si–Fe–Mg–Ca–C elements superposition diagram, c–i–Scanning images of the energy spectrum surface of U, O, Si, Fe, Mg, Ca, and C elements, respectively
图 7 301铀矿床铀矿石能谱面扫描图
a—KD3-b1-3,二次电子图像;b~k—分别为Ca、C、Fe、S、U、O、Si、Tb、Al、Ti元素能谱面扫描图;l—Ca–C–Fe–S–U–O–Si–Tb–Al–Ti元素叠合图
Figure 7. Scanning image of uranium ore energy spectrum surface of 301 uranium deposit
a–KD3-b1-3, secondary electron image; b–k–Scanning images of the energy spectrum surface of Ca, C, Fe, S, U, O, Si, Tb, Al and Ti elements respectively; l–Ca–C–Fe–S–U–O–Si–Tb–Al–Ti elements superposition diagram
图 8 米仓山含铀火山岩扫描电镜图像
a—硅化碎裂蚀变流纹岩,造岩矿物是钠长石,金属矿物主要是锐钛矿,少量锆石和钛铀矿,钛铀矿呈星散状分布于锐钛矿内部和周围,锆石呈自形长方形状分布于钠长石粒间;图a:①—锆石;②—钛铀矿;③、⑤—锐钛矿;④—钠长石;b—硅化碎裂蚀变流纹岩;造岩矿物主要是石英,少量绢云母,金属矿物主要是锐钛矿和铁氧化物,少量独居石和铀石,铀石呈星点状分布于石英粒间,与铁氧化物伴生;图b:①—铀石;②、③—铁氧化物;④、⑤—独居石;⑥—铁氧化物(含有钴可能为磁铁矿);⑦—石英;⑧—锐钛矿;⑨—绢云母;“+”和数字表示测点位置及编号
Figure 8. Scanning electron microscopic image of uranium−bearing volcanic rock in Micangshan
a–Silicified cataclastic altered rhyolite, rock–forming mineral is albite, metallic minerals are mainly anatase with a small amount of zircon and brannerite, brannerite is scattered in and around anatase, zircons are distributed among the albite grains in a euhedral rectangular shape; Fig.a: ①–Zircon; ②–Brannerite; ③, ⑤–Anatase; ④–Albite; b–Silicified cataclastic altered rhyolite, rock–forming minerals are mainly quartz with a small amount of sericite, metallic minerals are mainly anatase and iron oxides with a small amount of monazite and coffinite, coffinite is distributed among the quartz grains in the form of star or dot, coexisting with iron oxide; Fig.b: ①–Coffinite; ②, ③–Iron oxide; ④, ⑤–Monazite; ⑥–Iron oxide (containing cobalt may be magnetite); ⑦–Quartz; ⑧–Anatase; ⑨–Sericite; “+” and the position number indicate the location of measuring point and number
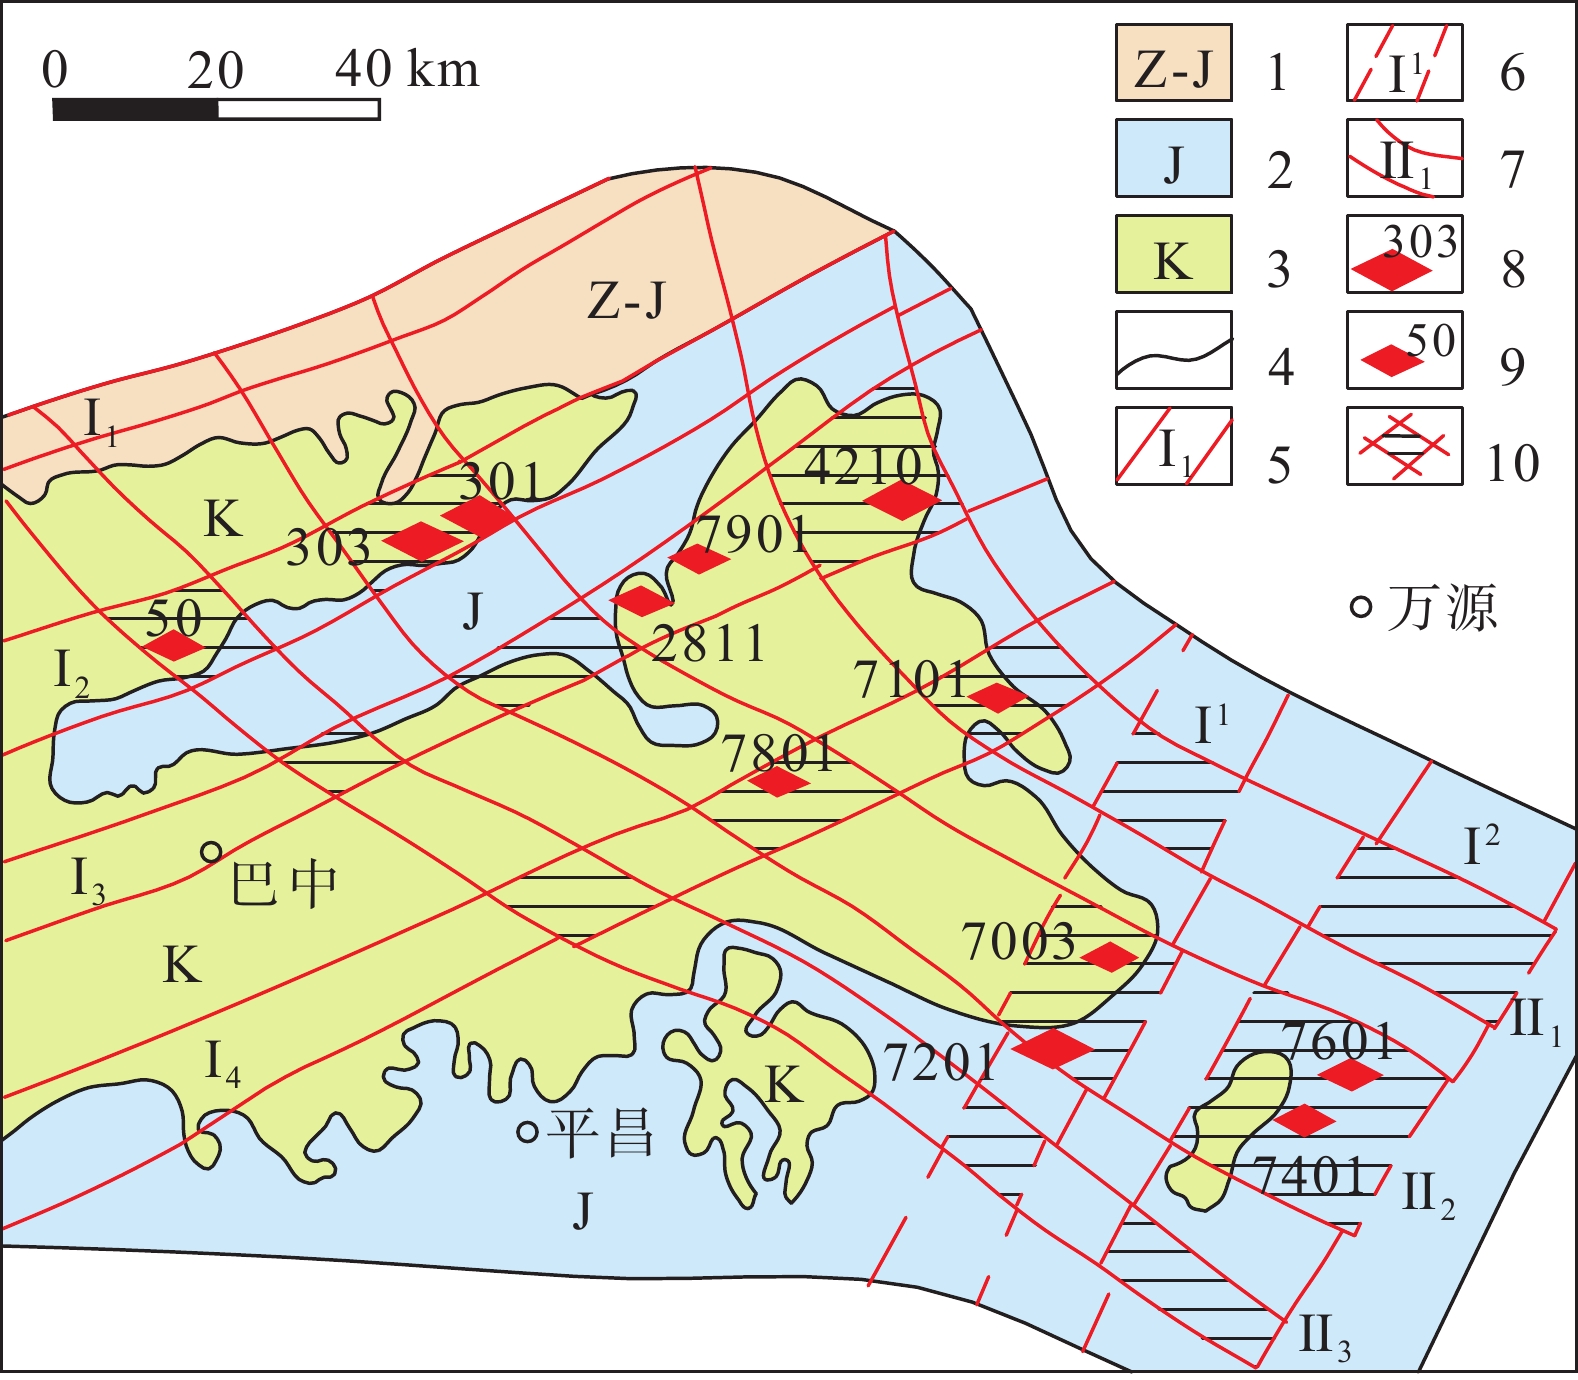
图 10 四川盆地东北部断裂构造分布及构造控矿示意图(据陶卫中, 1989修改)
1—震旦系—侏罗系;2—侏罗系;3—白垩系;4—地质界线;5—NE向断裂带及编号;6—NNE向断裂带及编号;7—NW向断裂带及编号;8—铀矿床位置及编号;9—铀矿点位置及编号;10—远景区;Ⅰ1—龙门山断裂带;Ⅰ2—苍溪—下两断裂带;Ⅰ3—三台—巴中断裂带;Ⅰ4—南部—通江断裂带;Ⅰ1、Ⅰ2—华蓥山断裂带;Ⅱ1—长坪—大沙断褶带;Ⅱ2—涪阳—河口断褶带;Ⅱ3—下两—石板店断褶带
Figure 10. Schematic diagram of faults tectonic distribution and tectonic ore control in northeastern Sichuan basin (modified from Tao Weizhong, 1989)
1–Sinian–Jurassic; 2–Jurassic; 3–Cretaceous; 4–Geological boundary; 5–NE trending fault zone and number; 6–NNE trending fault zone and number; 7–NW trending fault zone and number; 8–Location and number of uranium deposits; 9–Location and number of uranium ore occurrence; 10–Prospective area; Ⅰ1–Longmenshan fault zone; Ⅰ2–Cangxi–Xialiang fault zone; Ⅰ3–Santai–Bazhong fault zone; Ⅰ4–Nanbu–Tongjiang fault zone; Ⅰ1, Ⅰ2–Huayingshan fault zone; Ⅱ1–Changping–Dasha fault fold belt; Ⅱ2–Fuyang–Hekou fault fold belt; Ⅱ3–Xialiang–Shibandian fault fold belt
表 1 样品采取位置及分析鉴定
Table 1 Sampling position and analysis identification
样品编号 采样位置 铀含量/% 铀矿石品级 分析类型 KD3–b1 301铀矿床坑道KD–3坑口铀矿体露头 1.400 富矿石 电子探针、扫描电镜 LD3–b1 128铀矿点坑道KD–2坑口铀矿体露头 0.091 贫矿石 — LD4–b1 128铀矿点坑道KD–3坑口铀矿体露头 0.286 普通矿石 电子探针 KDht–b2 50铀矿点坑道KD–1铀矿体 0.522 富矿石 电子探针、扫描电镜 注:铀矿石品级,富矿石≥0.3%;普通矿石0.1%~0.3%;贫矿石<0.1%。 表 2 铀矿石扫描电镜能谱分析结果(%)
Table 2 Scanning electron microscopy energy spectrum analysis results of uranium ore (%)
编号 测点 U O Si Al Ti C Fe Ca Na K Mg N P S Pb Tc 总计 矿物名称 KDht−b2 b2−1 1 5.39 1.16 5.79 8.7 76.9 2.06 100.00 方铅矿 2 72.52 16.42 6.55 1.3 1.88 1.33 100.00 沥青铀矿 b2−2 1 5.78 1.58 3.05 9.98 77.78 1.83 100.00 方铅矿 2 61.24 24.22 8.46 1.86 1.77 1.72 0.72 99.99 铀石 b2−3 1 46.61 4.34 2.61 39.47 1.9 2.43 0.65 2.01 100.02 钛铁矿 2 74.76 17.46 4.38 0.7 1.05 1.31 0.34 100.00 沥青铀矿 3 54.99 43.22 1.79 100.00 石英 4 36.14 1.85 62.01 100.00 方解石 b2−4 线扫描 21.21 42.09 20.61 2.35 4.63 1.31 2.77 2.95 2.07 99.99 铀石 b2−
COXEM−
1126 25.62 43.03 9.29 2.27 13.02 1.68 2.27 1.82 1.01 100.01 铀石 27微区 19.63 38.10 12.36 4.85 14.85 5.09 1.80 0.70 2.61 99.99 铀石 KD3−b1 b1−1 1 52.18 29.13 9.84 2.53 1.85 1.04 0.99 0.93 0.61 0.51 0.39 100.00 铀石 2 48.27 0.69 2.33 47.29 1.41 99.99 方解石 3 54.92 40.61 4.46 99.99 石英 4 47.57 31.13 7.67 4.19 2.03 3.47 0.88 2.77 0.29 100.00 铀石 b1−2 1 14.87 2.24 1 4.77 35.37 0.89 40.86 100.00 黄铁矿
(部分褐
铁矿化)b1−3 1 43.12 53.74 2.72 99.58 锐钛矿 2 53.53 43.41 3.06 100.00 石英 3 9.39 4.93 36.83 48.85 100.00 黄铁矿 4 41.89 2.71 55.4 100.00 方解石 5 69.97 21.61 5.79 0.93 1.24 0.46 100.00 铀石 b2−5 b1−3的
面扫描3.91 49.07 21.56 3.09 6.37 3.03 2.99 7.56 2.41 99.99 表 3 含铀砂岩硅酸盐分析结果(%)
Table 3 Silicate analysis results of uranium−bearing sandstone (%)
样号 LD2-b1 KD1-b2 铀异常岩石平均 LD3-b1 LD4-b1 KDht-b1 KDht-b2 KD3-b1 铀矿石平均 SiO2 46.85 62.36 54.605 42.82 47.18 62.67 55.71 53.78 52.43 Al2O3 8.52 9.61 9.065 5.95 6.81 10.15 7.65 8.11 7.73 Fe2O3 1.37 1.81 1.59 0.935 0.879 1.56 0.871 1.5 1.15 TFe 2.01 2.83 2.42 1.45 1.53 3.2 2 2.94 2.22 FeO 1.36 2.02 1.69 1.03 1.18 2.71 1.79 2.44 1.83 CaO 18.25 7.98 13.115 23.58 20.18 6.85 14.37 11.08 15.21 MgO 1.91 2.11 2.01 1.43 1.47 2.82 1.46 1.64 1.76 K2O 1.89 1.66 1.775 1.06 1.23 1.76 1.27 1.35 1.33 Na2O 1.06 1.7 1.38 1.2 1.23 1.66 1.57 1.41 1.41 TiO2 0.507 0.639 0.573 0.344 0.463 0.597 0.498 0.44 0.47 P2O5 0.102 0.12 0.111 0.077 0.113 0.116 0.176 0.108 0.12 MnO 0.16 0.088 0.124 0.129 0.127 0.067 0.121 0.141 0.12 灼失 17.24 8.9 13.07 20.74 17.93 7.84 12.74 13.64 14.58 H2O+ 2.72 2.66 2.69 1.98 2.06 3.14 2.42 3.1 2.54 总和 103.95 104.49 104.218 102.73 102.38 105.14 102.65 101.68 102.91 铀含量 0.018 0.021 0.01945 0.091 0.286 0.303 0.522 1.400 矿石品级 贫矿石 普通矿石 富矿石 富矿石 富矿石 表 4 铀矿物电子探针分析结果(%)
Table 4 Electron probe analysis results of uranium minerals (%)
样品编号 LD4-b1 KD3-b1 KDht-b2 测点 1 2 1 2 3 1 2 3 Y2O3 / / 0.15 / / / / / SiO2 / 11.78 15.68 13.12 13.43 16.64 13.86 17.27 FeO / / 0.68 0.65 0.46 0.39 0.34 0.57 UO2 57.52 58.32 66.71 69.26 60.52 67.94 72.57 67.6 MgO 0.03 0.08 0.39 0.08 0.08 0.05 0.03 0.08 Na2O 0.1 / / 0.07 / 0.07 / / TiO2 / / / 0.49 0.31 0.62 / 0.28 K2O 0.57 0.19 0.33 0.14 0.19 0.24 0.25 0.23 As2O5 / 0.34 0.06 0.06 / / 0.07 0.04 Al2O3 / 0.06 1.39 0.55 0.95 0.78 0.3 0.93 MnO / / / / 0.08 0.18 / 0.26 ThO2 / / / / / / / / V2O3 15.15 0.18 / / 0.11 0.1 / / CaO 10.4 14.49 0.59 1.03 1.18 1.21 0.84 1.72 Nd2O3 0.5 / 0.37 / / / / / SO3 / / 0.05 / 0.06 / 0.08 / Ce2O3 / / 0.44 0.47 0.18 0.18 0.48 0.18 P2O5 / 0.45 0.94 1.24 0.91 1.63 0.97 1.34 La2O3 / / / / 0.29 / / 0.22 PbO / / 0.31 0.1 10 / 0.41 / Pr2O3 / / 0.07 / / / 0.21 0.11 SnO2 / / / / / / / / ZrO2 / / 0.17 0.1 0.06 / 0.16 0.03 总量 84.27 85.89 88.33 87.36 88.81 90.03 90.57 90.86 矿物 铀石 铀石 铀石 铀石 铀石 铀石 沥青铀矿 铀石 注:“/”表示元素含量低于检测限,未检出。 -
[1] Berner R A, Westrich J T. 1985. Bioturbation and the early diagenesis of carbon and sulfur[J]. American Journal of Science, 285: 3(3): 193−206.
[2] Bonnetti C, Cuney M, Michels R, Truche L, Malartre F, Liu X D, Yang J X. 2015. The multiple roles of sulfate−reducing bacteria and Fe−Ti oxides in the genesis of the Bayinwula roll front−type uranium deposit, Erlian Basin, NE China[J]. Economic Geology, 110(4): 1059−1081. doi: 10.2113/econgeo.110.4.1059
[3] Cai Yuqi, Zhang Jindai, Guo Qingyin, Song Jiye, Fan Honghai, Liu Wusheng, Qi Fucheng, Zhang Minglin. 2015. Outline of uranium resources characteristics and metallogenetic regularity in China[J]. Acta Geologica Sinica, 89(6): 1051−1069 (in Chinese with English abstract).
[4] Goswami S, Upadhyay P K, Saravanan B, Natarajan V, Verma M B. 2019. Two types of uranium mineralization in Gulcheru quartzite: Fracture−controlled in Ambakapalle area and litho−controlled in Tummalapalle area, Cuddapah Basin, Andhra Pradesh, India[J]. China Geology, 2(2): 142−156. doi: 10.31035/cg2018099
[5] Guo Ning, Sun Zexuan. 2017. Types and prospecting direction of sandstone−type uranium deposits in the northern margin of the Sichuan Basin[J]. Geology and Exploration, 53(1): 54−62 (in Chinese with English abstract).
[6] Jin R S, Feng X X, Teng X M, Nie F J, Cao H Y, Hou H Q, Liu H X, Miao P S, Zhao H L, Chen L L, Zhu Q, Zhou X X. 2020. Genesis of green sandstone/mudstone from Middle Jurassic Zhiluo Formation in the Dongsheng Uranium Orefield, Ordos Basin and its enlightenment for uranium mineralization[J]. China Geology, 3(1): 52−66. doi: 10.31035/cg2020002
[7] Li D P, Chen Y L, Wang Z, Lin Y, Zhou J. 2012. Paleozoic sedimentary record of the Xing Meng Orogenic Belt, Inner Mongolia: Implications for the provenances and tectonic evolution of the Central Asian Orogenic Belt[J]. Chinese Science Bulletin, 57: 776−785.
[8] Liu Baojun. 1980. Sedimentary Petrology[M]. Beijing: Geological Publishing House, 60−65 (in Chinese).
[9] Lovley D R. 1993. Dissimilatory metal reduction[J]. Annual Review of Microbiology, 47(3): 263−290.
[10] Lovley D R, Phillips E J. 1992. Reduction of uranium by Desulfovibrio desulfuricans[J]. Applied & Environment Microbiology, 58(3): 850−856.
[11] Lu Chao, Peng Yunbiao, Liu Xinyang, Jiao Yangquan, Yang Jianxin, Chen Fazheng, Shen Kefeng, Li Ronglin. 2013. Sedimentary backgrounds of sandstone−type uranium deposits in western Manite Depression of Erlian Basin[J]. Uranium Geology, 29(6): 336−343 (in Chinese with English abstract).
[12] Pan Chunrong, Mou Ping, Zhong Fujun, Huang Guangwen, Li haidong, Pan Jiayong. 2020. Genesis of chlorite in the Huangsha uranium deposit, middle part of Nanling Mountains and its relationship with uranium mineralization[J]. Geology in China, 47(2): 348−361 (in Chinese with English abstract).
[13] Qidwa H A, Jensen M L. 1979. Methodology and exploration for sandstone−type uranium deposits[J]. Mineralium Deposita, 14(2): 137−152.
[14] Shen Chuanbo, Mei Lianfu, Xu Zhenping, Tang Jiguang. 2007. Architecture and tectonic evolution of composite basin−mountain system in Sichuan Basin and its adjacent areas[J]. Geotectonica et Metallogenia, 31(3): 288−299 (in Chinese with English abstract).
[15] Tao Weizhong. 1989. Control of faulted structure over the sandstone−type uranium deposit in the northeastern part of Sichuan Province[J]. Uranium Geology, 5(2): 86−94 (in Chinese with English abstract).
[16] Watson M P, Hayward A B, Parkinson D N, Zhang Z M. 1987. Plate tectonic history, basin development and petroleum source rock deposition onshore China[J]. Marine and Petroleum Geology, 4(3): 205−225. doi: 10.1016/0264-8172(87)90045-6
[17] Wilkin R T, Barnes H L, Brantley S L. 1996. The size distribution of framboidal pyrite in modern modern sediments: An indicator of redox conditions[J]. Geochimica et Cosmochimica Acta, 60(20): 3897−3912. doi: 10.1016/0016-7037(96)00209-8
[18] Wu Bailin, Sun Bin, Cheng Xianghu, Zhang Wanying, Liu Mingyi, Hao Xin, Liu Chiyang. 2017. Study and prospect for sedimentology of uranium deposit[J]. Acta Sedimentologica Sinica, 35(5): 1044−1053 (in Chinese with English abstract).
[19] Wu Bolin, Xu Gaozhong. 2004. Evolution feature of palaeoclimate and significance of sequence stratigraphy in Suixigou Group in the southwest edge of Turpan−Ham Basin[J]. Journal of East China University of Technology (Natural Science), 27(2): 135−140 (in Chinese with English abstract).
[20] Wu Rengui, Zhu Minqiang, Yu Dagan, Chen Anping. 2002. Analyses of depositional system and studies on metallogenic condition of basal−channel sandstone uranium deposit[J]. Mineral Deposits, 21(Z1): 878−880 (in Chinese with English abstract).
[21] Xiao Z H, Xiong S B, Li C H, Liu Y, Yang Z D, Feng X X, Liu X W. 2020. Types of uranium deposits in central Zhuguang Mountains in Hunan Province, South China and their metallogenic regularity and prospecting directions[J]. China Geology, 3(3): 411−424.
[22] Yang Ruoli, Sun Qunli. 1985. Uranium Deposit[M]. Nanchang: East China Institute of Geology Press (in Chinese).
[23] Yao Genshun, Li Dacheng, Lu Wenzhong, Xu Zhengyu. 2006. Characters of coupling between Mesozoic sedimentary basin and orogenic belt in Sichuan overlain basin and its adjacent area[J]. Geotectonica et Metallogenia, 30(4): 435−444 (in Chinese with English abstract).
[24] Ye Sujuan, Li Rong, Zhang Zhuang. 2014. Provenance analysis and depositional system of the Upper Jurassic Penglaizhen Formation in the middle part of western Sichuan, China[J]. Acta Sedimentologica Sinica, 32(5): 930−940 (in Chinese with English abstract).
[25] Zeng Yunfu, Xia Wenjie. 1986. Sedimentary Petrology[M]. Beijing: Geological Publishing House, 94−95 (in Chinese).
[26] Zhang Zuhuan, Zhao Yiying, Zhang Bangtong, Shen Weizhou. 1984. Uranium Geochemistry[M]. Beijing: Atomic Energy Press, 280−283 (in Chinese).
[27] Zhao Fengmin, Chen Zhangru, Zhang Jingyi, Wang Wenguang. 1988. Uranium Mineral Identification Manual[M]. Beijing: Atomic Energy Press, 118−121 (in Chinese).
[28] Zhong Jun, Fan Honghai, Gu Dazhao, Wang Shengyun, Chen Jingui, Shi Changhao, Li Hengqiang. 2016. Major and trace element migration and metallogenic processes of the Xinshuijing U−Th deposit in the Longshoushan metallogenic belt, Gansu Province[J]. Geology in China, 43(4): 1393−1408 (in Chinese with English abstract).
[29] Zhu Xiyang, Sun Zexuan, Chen Hongde, Hou Mingcai, Li Guoxin. 2004. Characteristics of sedimentary system and sandstone−type uranium mineralization in Longchuanjiang basin, western Yunnan[J]. Journal of Chengdu University of Technology (Science & Technology of Edition), 31(3): 267−272 (in Chinese with English abstract).
[30] 蔡煜琦, 张金带, 郭庆银, 宋继叶, 范洪海, 刘武生, 漆富成, 张明林. 2015. 中国铀矿资源特征及成矿规律概要[J]. 地质学报, 89(6): 1051−1069. doi: 10.3969/j.issn.0001-5717.2015.06.005 [31] 郭宁, 孙泽轩. 2017. 川北砂岩铀矿类型及找矿方向[J]. 地质与勘探, 53(1): 54−62. doi: 10.12134/j.dzykt.2017.01.006 [32] 刘宝珺. 1980. 沉积岩石学[M]. 北京: 地质出版社, 60−65. [33] 鲁超, 彭云彪, 刘鑫扬, 焦养泉, 杨建新, 陈法正, 申科峰, 李荣林. 2013. 二连盆地马尼特坳陷西部砂岩型铀矿成矿的沉积学背景[J]. 铀矿地质, 29(6): 336−343. doi: 10.3969/j.issn.1000-0658.2013.06.003 [34] 潘春蓉, 牟平, 钟福军, 黄广文, 李海东, 潘家永. 2020. 南岭中段黄沙铀矿区绿泥石成因及其与铀成矿关系[J]. 中国地质, 47(2): 348−361. doi: 10.12029/gc20200206 [35] 沈传波, 梅廉夫, 徐振平, 汤济广. 2007. 四川盆地复合盆山体系的结构构造和演化[J]. 大地构造与成矿学, 31(3): 288−299. doi: 10.3969/j.issn.1001-1552.2007.03.004 [36] 陶卫中. 1989. 川东北地区断裂构造对砂岩型铀矿床的控制作用[J]. 铀矿地质, 5(2): 86−94. [37] 吴柏林, 孙斌, 程相虎, 张婉莹, 刘明义, 郝欣, 刘池洋. 2017. 铀矿沉积学研究与发展[J]. 沉积学报, 35(5): 1044−1053. [38] 吴伯林, 徐高中. 2004. 吐哈盆地西南缘水西沟群古气候演变特征及其层序地层学意义[J]. 东华理工学院学报(自然科学版), 27(2): 135−140. [39] 吴仁贵, 祝民强, 余达淦, 陈安平. 2002. 沉积体系分析与底河道型砂岩铀矿成矿条件讨论: 以鄂尔多斯中生代盆地北部东胜地区为例[J]. 矿床地质, 21(Z1): 878−880. [40] 杨若利, 孙群力. 1985. 铀矿床学[M]. 南昌: 华东地质学院出版社. [41] 姚根顺, 李大成, 卢文忠, 徐政语. 2006. 四川叠合盆地盆山耦合特征分析[J]. 大地构造与成矿学, 30(4): 435−444. doi: 10.3969/j.issn.1001-1552.2006.04.005 [42] 叶素娟, 李嵘, 张庄. 2014. 川西坳陷中段上侏罗统蓬莱镇组物源及沉积体系研究[J]. 沉积学报, 32(5): 930−940. [43] 曾允孚, 夏文杰. 1986. 沉积岩石学[M]. 北京: 地质出版社, 94−95. [44] 张祖还, 赵懿英, 章邦桐, 沈渭洲. 1984. 铀地球化学[M]. 北京: 原子能出版社, 280−283. [45] 赵凤民, 陈章如, 张静宜, 王文广. 1988. 铀矿物鉴定手册[M]. 北京: 原子能出版社, 118−121. [46] 钟军, 范洪海, 顾大钊, 王生云, 陈金勇, 史长昊, 李恒强. 2016. 甘肃龙首山成矿带新水井铀(钍)矿床元素迁移规律及成矿作用过程研究[J]. 中国地质, 43(4): 1393−1408. doi: 10.12029/gc20160423 [47] 朱西养, 孙泽轩, 陈洪德, 侯明才, 李国新. 2004. 滇西龙川江盆地沉积体系特征及与砂岩铀矿成矿[J]. 成都理工大学学报(自然科学版), 31(3): 267−272.


 下载:
下载:


