Sediment recycling in the northern Qaidam Basin margin during the Cenozoic: A case study from the Dahonggou section
-
摘要:研究目的
近来,越来越多的研究显示沉积物再旋回作用在构造事件反演、沉积物源区识别以及风尘沉积溯源等方面具有重要作用。
研究方法为了探究柴达木盆地新生代沉积物再旋回作用,本文对柴北缘大红沟剖面的砂岩进行了薄片鉴定、碎屑颗粒统计和重矿物等分析,以及对泥岩进行了主微量与稀土元素、黏土矿物等分析。
研究结果大红沟剖面泥岩的主微量元素与稀土元素分别表现出相似的大陆上地壳(UCC)和球粒陨石标准化配分模式,可能表明沉积物已完全混合或发生再旋回作用;砂岩的主要成分为石英以及少量的长石和岩屑,其中岩屑主要由沉积岩屑组成,表明其源区主要为再旋回造山带;剖面上部稳定重矿物的含量和锆石、电气石和金红石(ZTR)指数突然降低,这表明后期可能主要为近源堆积;相反,黏土矿物中易发生分解的绿泥石的含量在剖面上部突然增加,这也表明此时的物源区更近,有更多的绿泥石保存下来。
结论综合已有的地层沉积相、砂岩薄片以及碎屑锆石U−Pb年龄等资料,认为柴北缘逆冲褶皱带内广泛分布的侏罗系和白垩系沉积岩曾经历过大规模的沉积物再旋回作用,是盆地新生代地层的重要源区之一;近来的碎屑磷灰石裂变径迹分析表明,柴北缘新生代沉积岩在9~7 Ma经历了显著的沉积物再旋回作用;随着逆冲褶皱作用进一步向盆地内部扩展,~3 Ma以后盆地北部的隆起区沉积岩再次经历沉积物再旋回作用,可能成为柴达木盆地第四纪湖泊以及中国黄土高原黄土的重要源区。
创新点:(1)柴北缘逆冲褶皱带内的侏罗系和白垩系,以及早期的新生代地层是盆地晚期地层的重要物质来源;(2)柴北缘的新生代沉积岩在9~7 Ma和~3 Ma经历了两次显著的沉积物再旋回作用。
Abstract:This paper is the result of geological survey engineering.
ObjectiveRecently, more studies show that the sediment recycling plays an important role in the inversion of the tectonic events, the identification of sediment source areas and the sources of eolian dust.
MethodsIn order to explore the Cenozoic sediment recycling in the Qaidam Basin, this paper conducts thin section identification, detrital framework grain composition and heavy mineral analysis of sandstones, and major, trace, and rare earth elements, and clay minerals of mudstones of the Dahonggou section in the northern Qaidam Basin.
ResultsThe major, trace, and rare earth elements of mudstones are similar to the standard distribution patterns of upper continental crust (UCC) and chondrite, which may indicate that the sediments have been completely mixed or recycled; Sandstone is mainly composed of quartz, and a small amount of feldspar and lithic grains which are mainly composed of sedimentary ones. Sandstone framework detrital mode indicates a provenance type of recycled orogenic belt; The content of stable heavy minerals and ZTR (zircon, tourmaline, and rutile) index suddenly decrease in the upper portion of the section, indicating a closer source area to the section during the late stage; On the contrary, the contents of chlorite, which is easy to decompose, suddenly increase in the upper portion of the section. This observation might also shows that its source area was closer at this time.
ConclusionsBased on the analysis of sedimentary facies, sandstone thin section and detrital zircon U−Pb age, it was suggested that the Jurassic and Cretaceous sedimentary rocks in the thrust−fold belt of the northern Qaidam Basin experienced large−scale sediment recycling and were one of the important provenances of the Cenozoic strata in the basin; Then, the fission−track analyses of detrital apatite show that the Cenozoic sedimentary rocks in the northern margin of the Qaidam basin have experienced significant recycling at 9−7 Ma; After about 3 Ma, with fold−thrusting propagating into the basin center, the uplifted sedimentary rocks in the northern basin experienced recycling, which form the important provenance of the Quaternary lakes within the center of the Qaidam Basin and of the Quaternary loess deposits in China Loess Plateau.
Highlights:(1) The Jurassic, Cretaceous and early Cenozoic strata in the thrust−fold belt of the northern margin of the Qaidam Basin were the important provenances of the late strata in the basin; (2) The Cenozoic sedimentary rocks in the northern margin of the Qaidam basin have experienced twice significant sediment recycling at 9−7 Ma and 3 Ma.
-
1. 引 言
新生代印度板块与欧亚板块的汇聚与碰撞,不仅在高原内部造就了高海拔(≥5000 m)、低起伏的平坦地貌,还在青藏高原北部形成了一系列大型的盆岭地貌(Tapponnier, 2001)。在青藏高原北部,柴达木盆地不仅是最大的山间盆地,而且沉积了巨厚(平均6~8 km)、且连续的新生代陆相碎屑沉积岩(Yin et al., 2008a; 王国灿等,2010),这些沉积物无疑完整地记录了青藏高原向北的扩展与抬升过程,以及研究区的古气候与古环境演化历史。目前,已对柴达木盆地新生代地层开展了多方面的研究,比如:沉积学与沉积相分析(Rieser et al., 2005; Zhuang et al., 2011; Jian et al., 2013; Bush et al., 2016; 杨利荣等,2017)、物源区鉴别(Yin et al., 2002, 2008a; Rieser et al., 2005; Jian et al., 2013; Bush et al., 2016)以及盆地构造解析等(Yin et al., 2007a, 2008a, 2008b; Meng and Fang, 2008)。
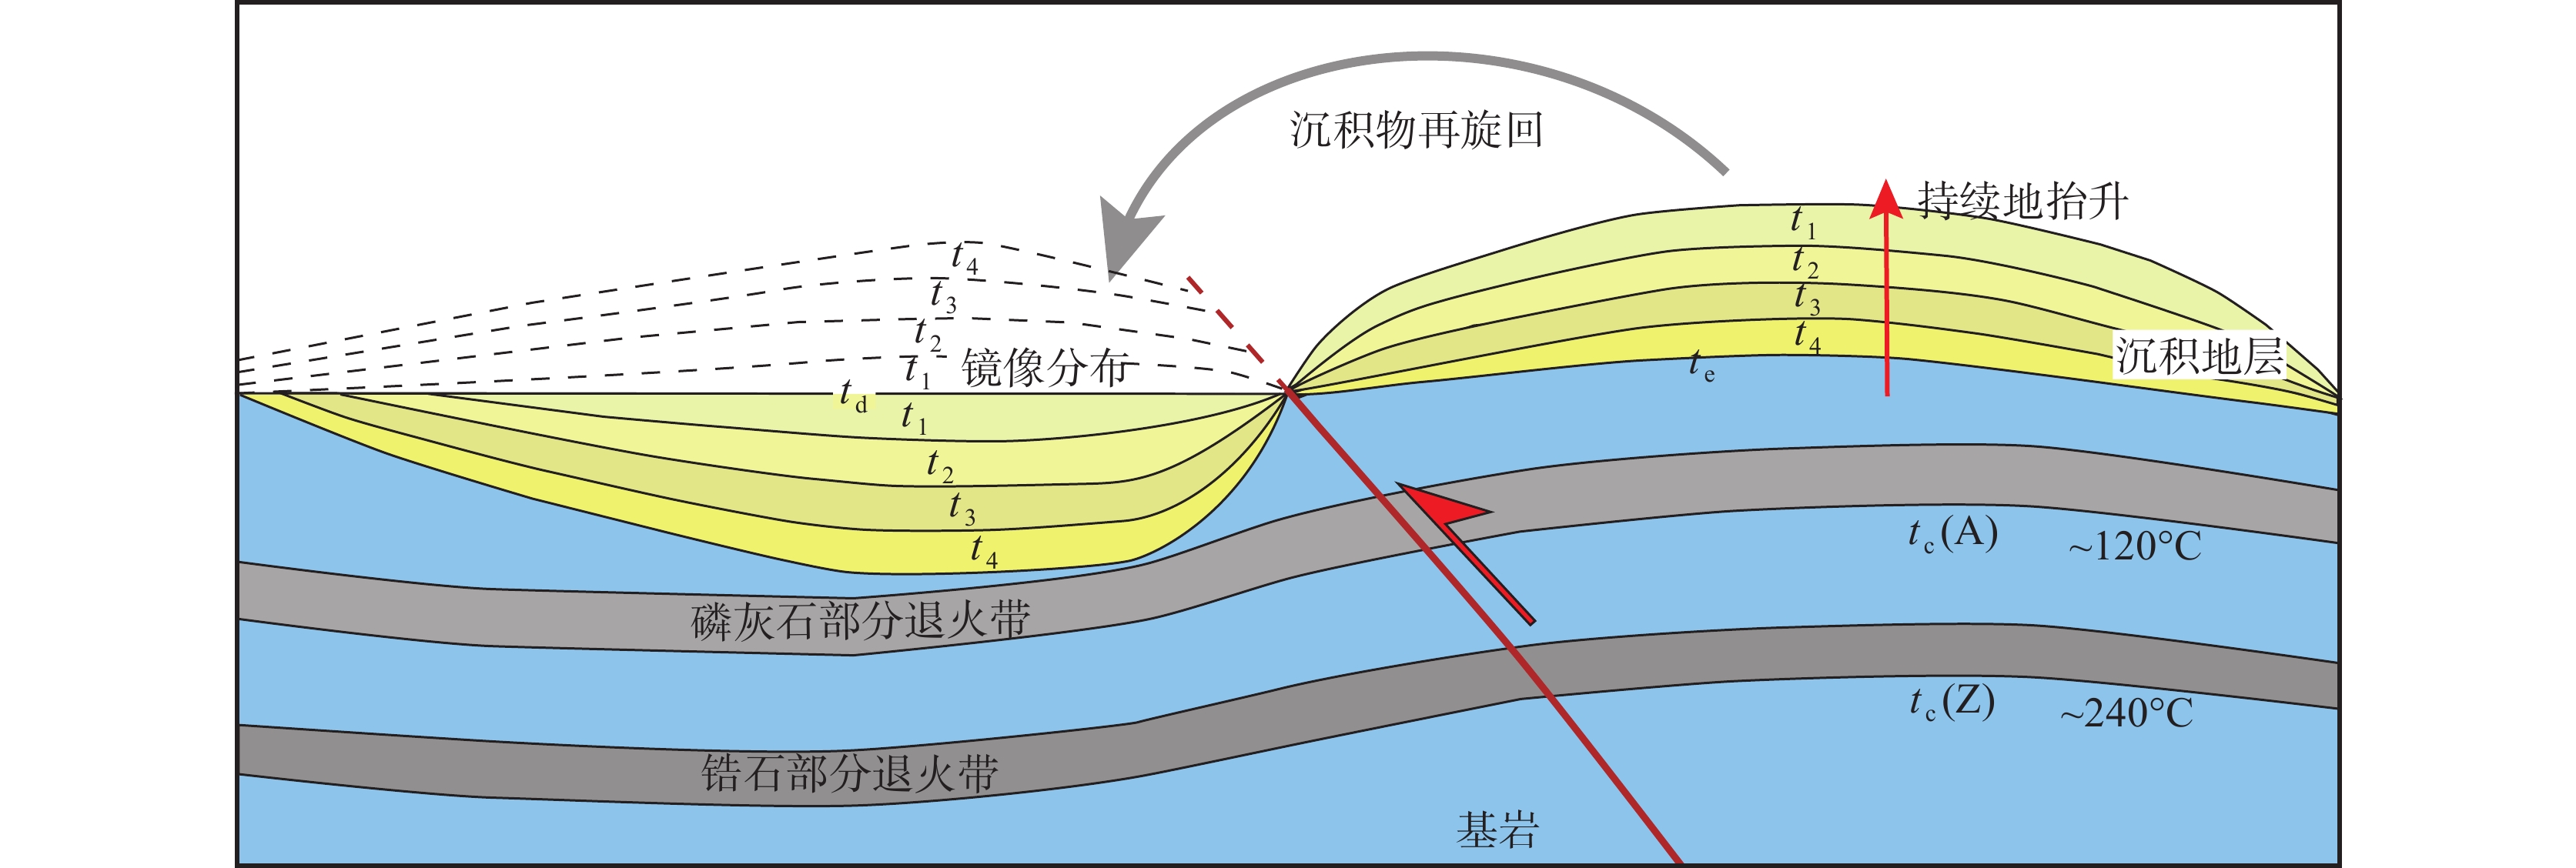
近来,国外学者在研究山间盆地沉积物的时候广泛提到了Sediment Recycling(图1),意即“沉积物再旋回作用”。沉积物再旋回作用是指较老的沉积岩在构造作用(逆冲抬升、或正断作用)下出露于高地形环境中,随后经过风化、侵蚀、搬运等水流或风力作用,最后重新沉积于地形较低的沉积系统中。由于在构造事件反演(Colombo 1994; Fosdick et al., 2014),沉积物源区识别(Lu et al., 2019),以及风尘沉积溯源(Pullen et al., 2011; Kapp et al., 2011)等方面的贡献,沉积物再旋回作用在构造地质学与古气候研究中具有重要的科学价值。
![]() 图 1 盆地沉积物再旋回作用模式图(据Garver et al., 1999修改)tc—通过封闭温度的时间;td—沉积时间;te—到达地表的时间;通常假设td=te;A和Z分别指磷灰石和锆石;t1—t4为碎屑磷灰石或锆石记录的冷却年龄Figure 1. Schematic sediment recycling model within basin (modified from Garver et al.,1999)tc—The time through the closure temperature; td—Deposition time; te—The time arrived at the surface; It is generally assumed that td=te; A and Z refer to the apatite and zircon, respectively; t1−t4 is the cooling age recorded by the detrital apatite or zircon
图 1 盆地沉积物再旋回作用模式图(据Garver et al., 1999修改)tc—通过封闭温度的时间;td—沉积时间;te—到达地表的时间;通常假设td=te;A和Z分别指磷灰石和锆石;t1—t4为碎屑磷灰石或锆石记录的冷却年龄Figure 1. Schematic sediment recycling model within basin (modified from Garver et al.,1999)tc—The time through the closure temperature; td—Deposition time; te—The time arrived at the surface; It is generally assumed that td=te; A and Z refer to the apatite and zircon, respectively; t1−t4 is the cooling age recorded by the detrital apatite or zircon目前,已有多种方法用来研究柴达木盆地的沉积物再旋回作用,如砂岩碎屑颗粒统计(Rieser et al., 2005; Zhuang et al., 2011; Jian et al., 2013; Bush et al., 2016)和碎屑磷灰石的裂变径迹年龄分析(Wang et al., 2017; Pang et al., 2019)等。然而,这些研究只是通过单一的方法对再旋回作用进行简要论述,还不足以全面获取新生代柴达木盆地地层的沉积再旋回特征。Morton et al. (2012)在研究沉积盆地中的砂岩时主张综合多种分析方法,这样可以更全面地揭示沉积区的物源特征。因此,本文在前人研究的基础上,结合地球化学、砂岩碎屑颗粒组成、重矿物与黏土矿物等分析,从多个角度综合分析新生代柴达木盆地的沉积物再旋回作用。
2. 研究区地质背景
2.1 地质概况
柴达木盆地面积约12万km2,是青藏高原最大的山间盆地。盆地内部高程起伏不大,平均海拔约3000 m (Tapponnier, 2001; Rieser et al., 2005; Yin et al., 2007a, 2008a)。盆地周围被大型山脉所围限,西部为阿尔金山,南部为东昆仑山,北部为祁连山,东部为鄂拉山。柴北缘自西向东分布有赛什腾山、绿梁山、锡铁山、埃姆尼克山和欧龙布鲁克山等次级山脉。柴北缘还分布有长约450 km的超高压(UHP)变质带,主要出露在绿梁山、锡铁山和都兰地区(杨经绥等,2000; Yin et al., 2007b)。
在构造上,盆地四周分布了许多大型走滑断裂带:北侧发育了柴北缘逆冲断裂带;西侧主要受阿尔金左旋走滑断裂带控制;南侧主要受东昆仑逆冲断裂带控制;东侧主要受温泉右旋走滑断裂带控制。盆地内部变形主要受逆冲与褶皱作用控制(Yin et al., 2007a; Meng and Fang, 2008; 图2)。地震反射剖面表明,柴达木盆地是一个广阔的新生代复向斜(Zhu et al., 2006; Meng and Fang, 2008; Yin et al., 2008a)。
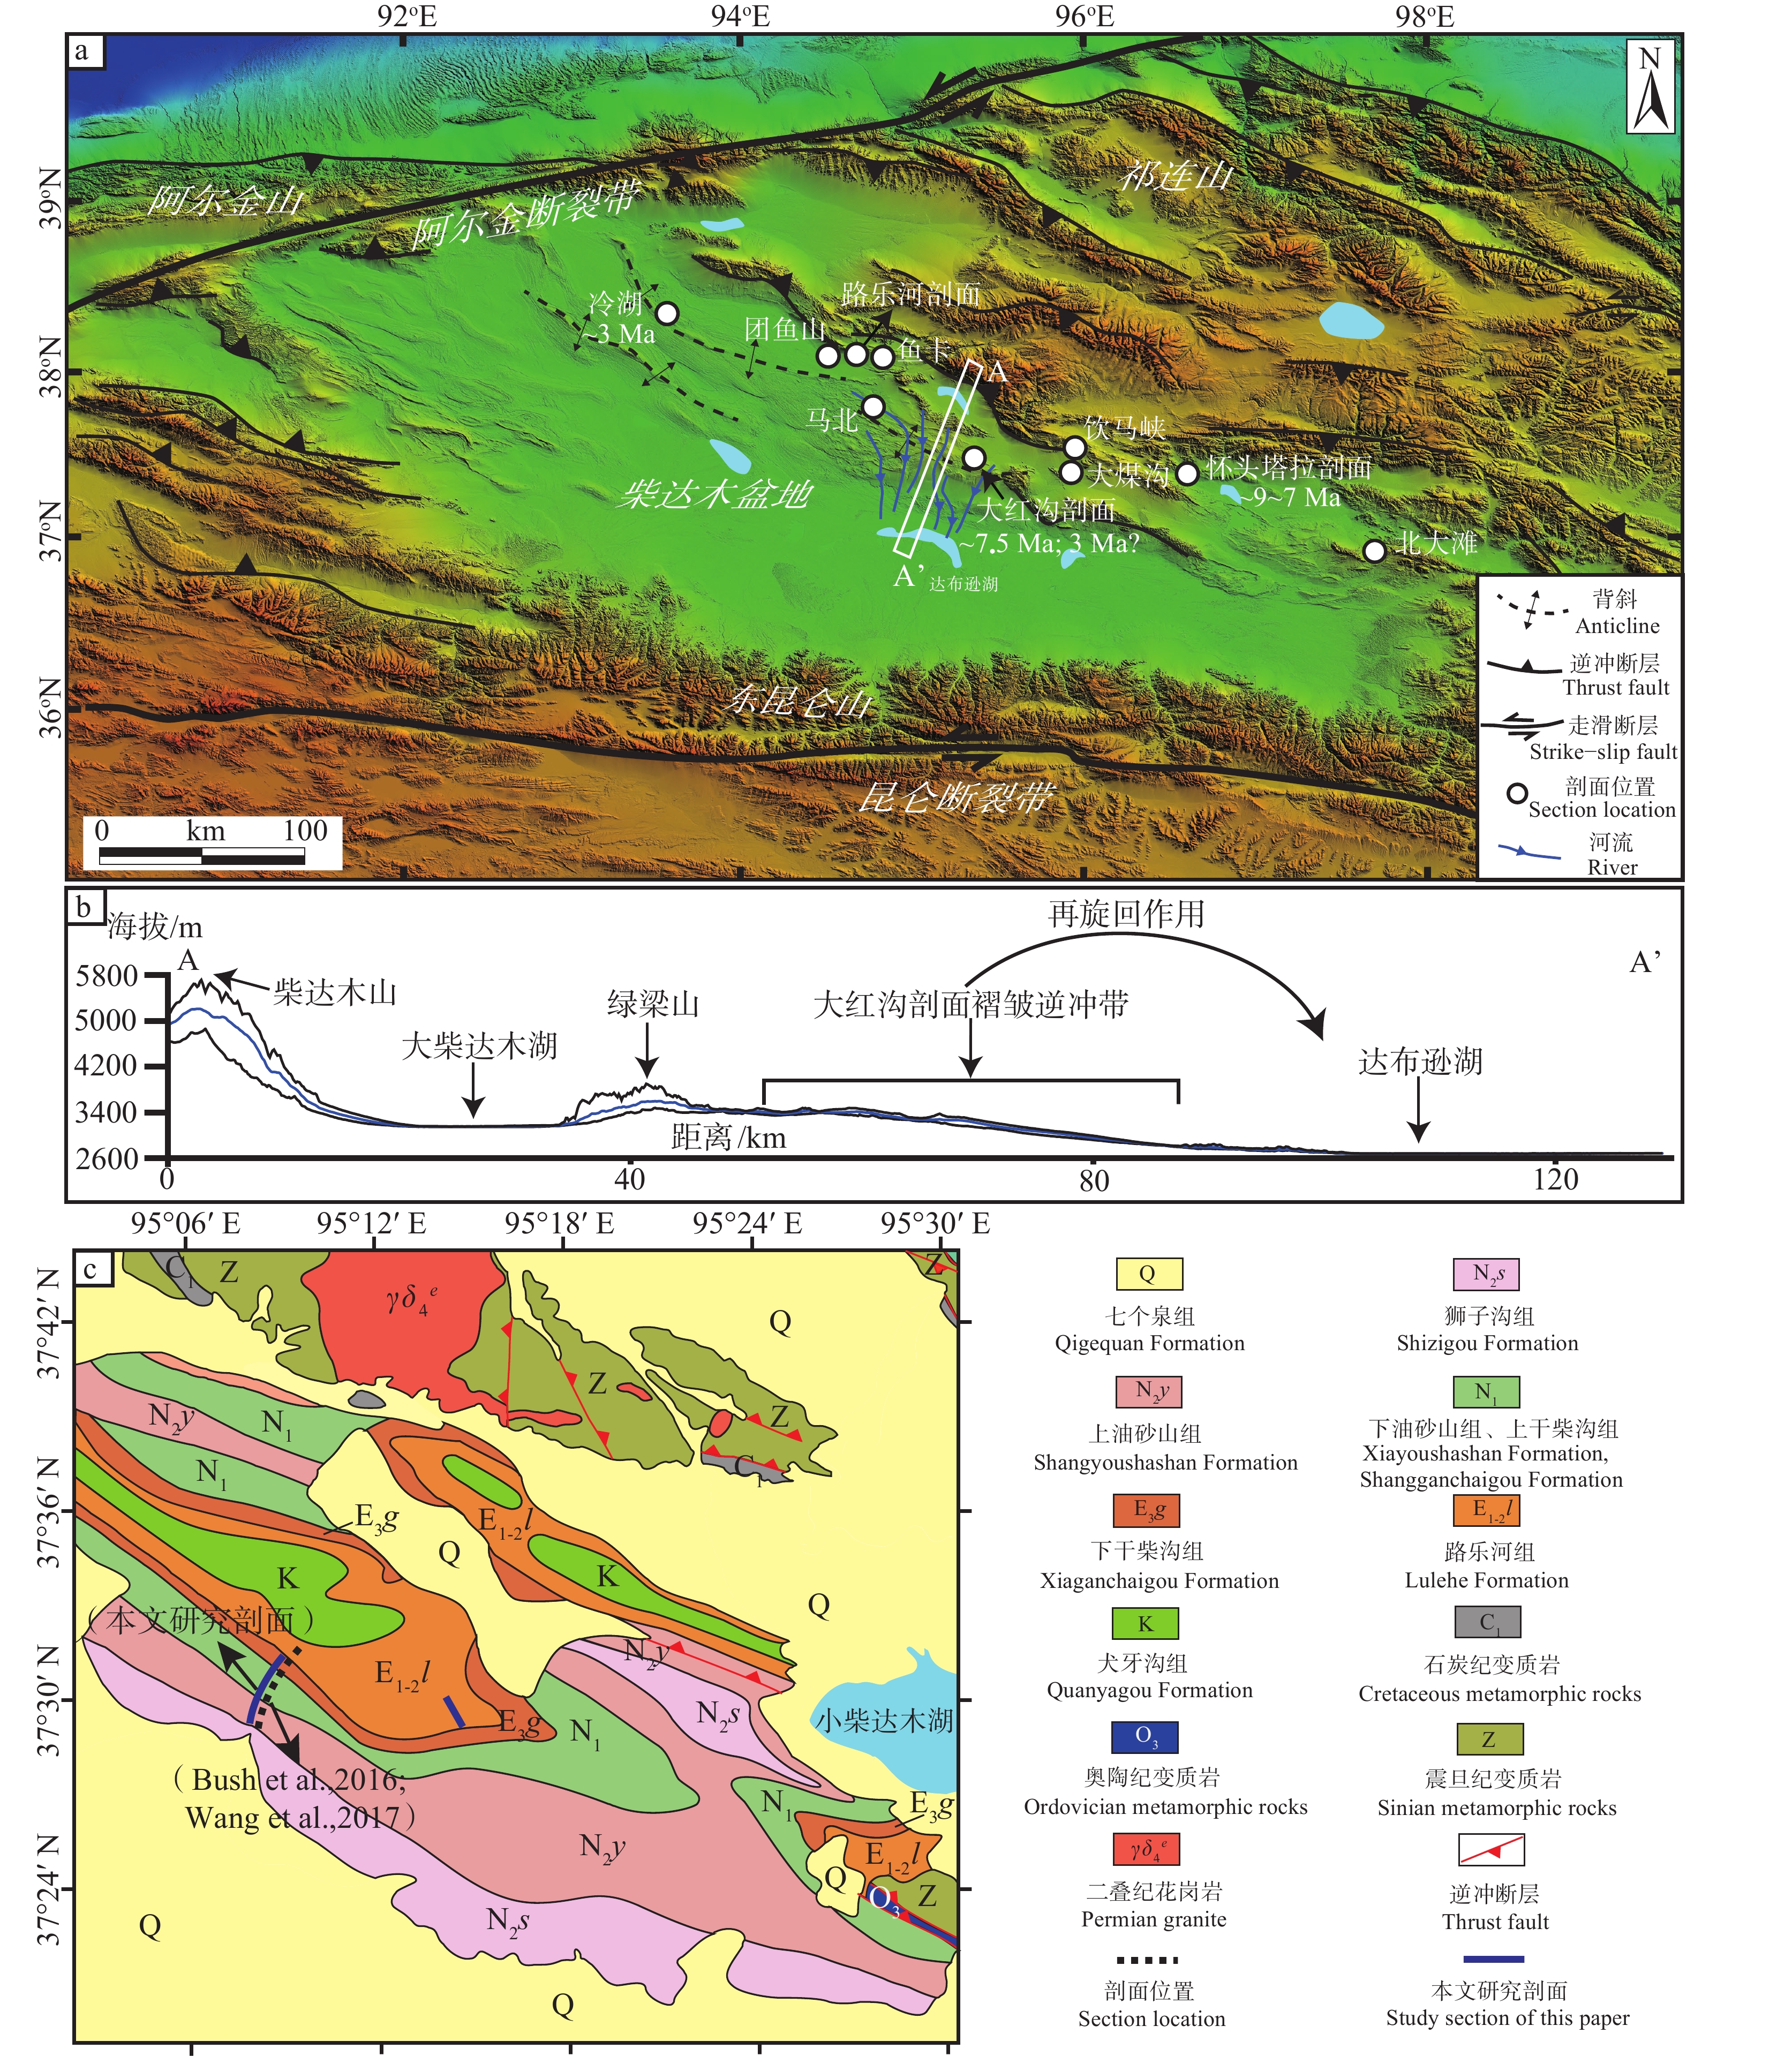
![]() 图 2 研究区和采样位置图a—柴达木盆地及其周围地区数字高程模型图;b—柴北缘廊带剖面(A−A′)的高程图,其中蓝线代表10条高程剖面的平均值,上、下黑线分别是高程最大值与最小值;c—大红沟剖面及其周缘地区地质图及采样剖面Figure 2. Location maps of the study area and sampling sitesa−Digital elevation model (DEM) of the Qaidam Basin and its surrounding areas; b−Elevation map of the corridor section (A−A') in the northern Qaidam Basin margin. The blue line represents the average of the 10 elevation profiles, and the upper and lower black lines are the maximum and minimum elevation, respectively; c−Geologic map and sampling sites of the Dahonggou section and its surrounding areas
图 2 研究区和采样位置图a—柴达木盆地及其周围地区数字高程模型图;b—柴北缘廊带剖面(A−A′)的高程图,其中蓝线代表10条高程剖面的平均值,上、下黑线分别是高程最大值与最小值;c—大红沟剖面及其周缘地区地质图及采样剖面Figure 2. Location maps of the study area and sampling sitesa−Digital elevation model (DEM) of the Qaidam Basin and its surrounding areas; b−Elevation map of the corridor section (A−A') in the northern Qaidam Basin margin. The blue line represents the average of the 10 elevation profiles, and the upper and lower black lines are the maximum and minimum elevation, respectively; c−Geologic map and sampling sites of the Dahonggou section and its surrounding areas2.2 沉积序列
柴北缘的沉积地层序列主要包括陆相的中生代与新生代碎屑沉积。其中,中生代地层主要包括侏罗系和白垩系,它们不连续出露在盆地北缘,自西向东从冷湖至大煤沟一带。中生代地层主要划分为下、中侏罗统小煤沟组和大煤沟组,上侏罗统采石岭组、红水沟组,以及白垩系犬牙沟组。下、中侏罗统岩性为湖相为主的暗色泥岩含煤地层;上侏罗统和白垩系中缺乏富含有机物的岩石,以砂质和砾岩红层为主,细粒的地层主要是河流漫滩或湖相地层,通常具有发育良好的钙质古土壤。下侏罗统小煤沟组不整合覆盖在较老的岩石上,厚约100 m,与中侏罗统大煤沟组呈角度不整合接触。上侏罗统采石岭组、红水沟组与白垩系犬牙沟组不整合覆盖在大煤沟组之上(青海省地质矿产局,1991)。
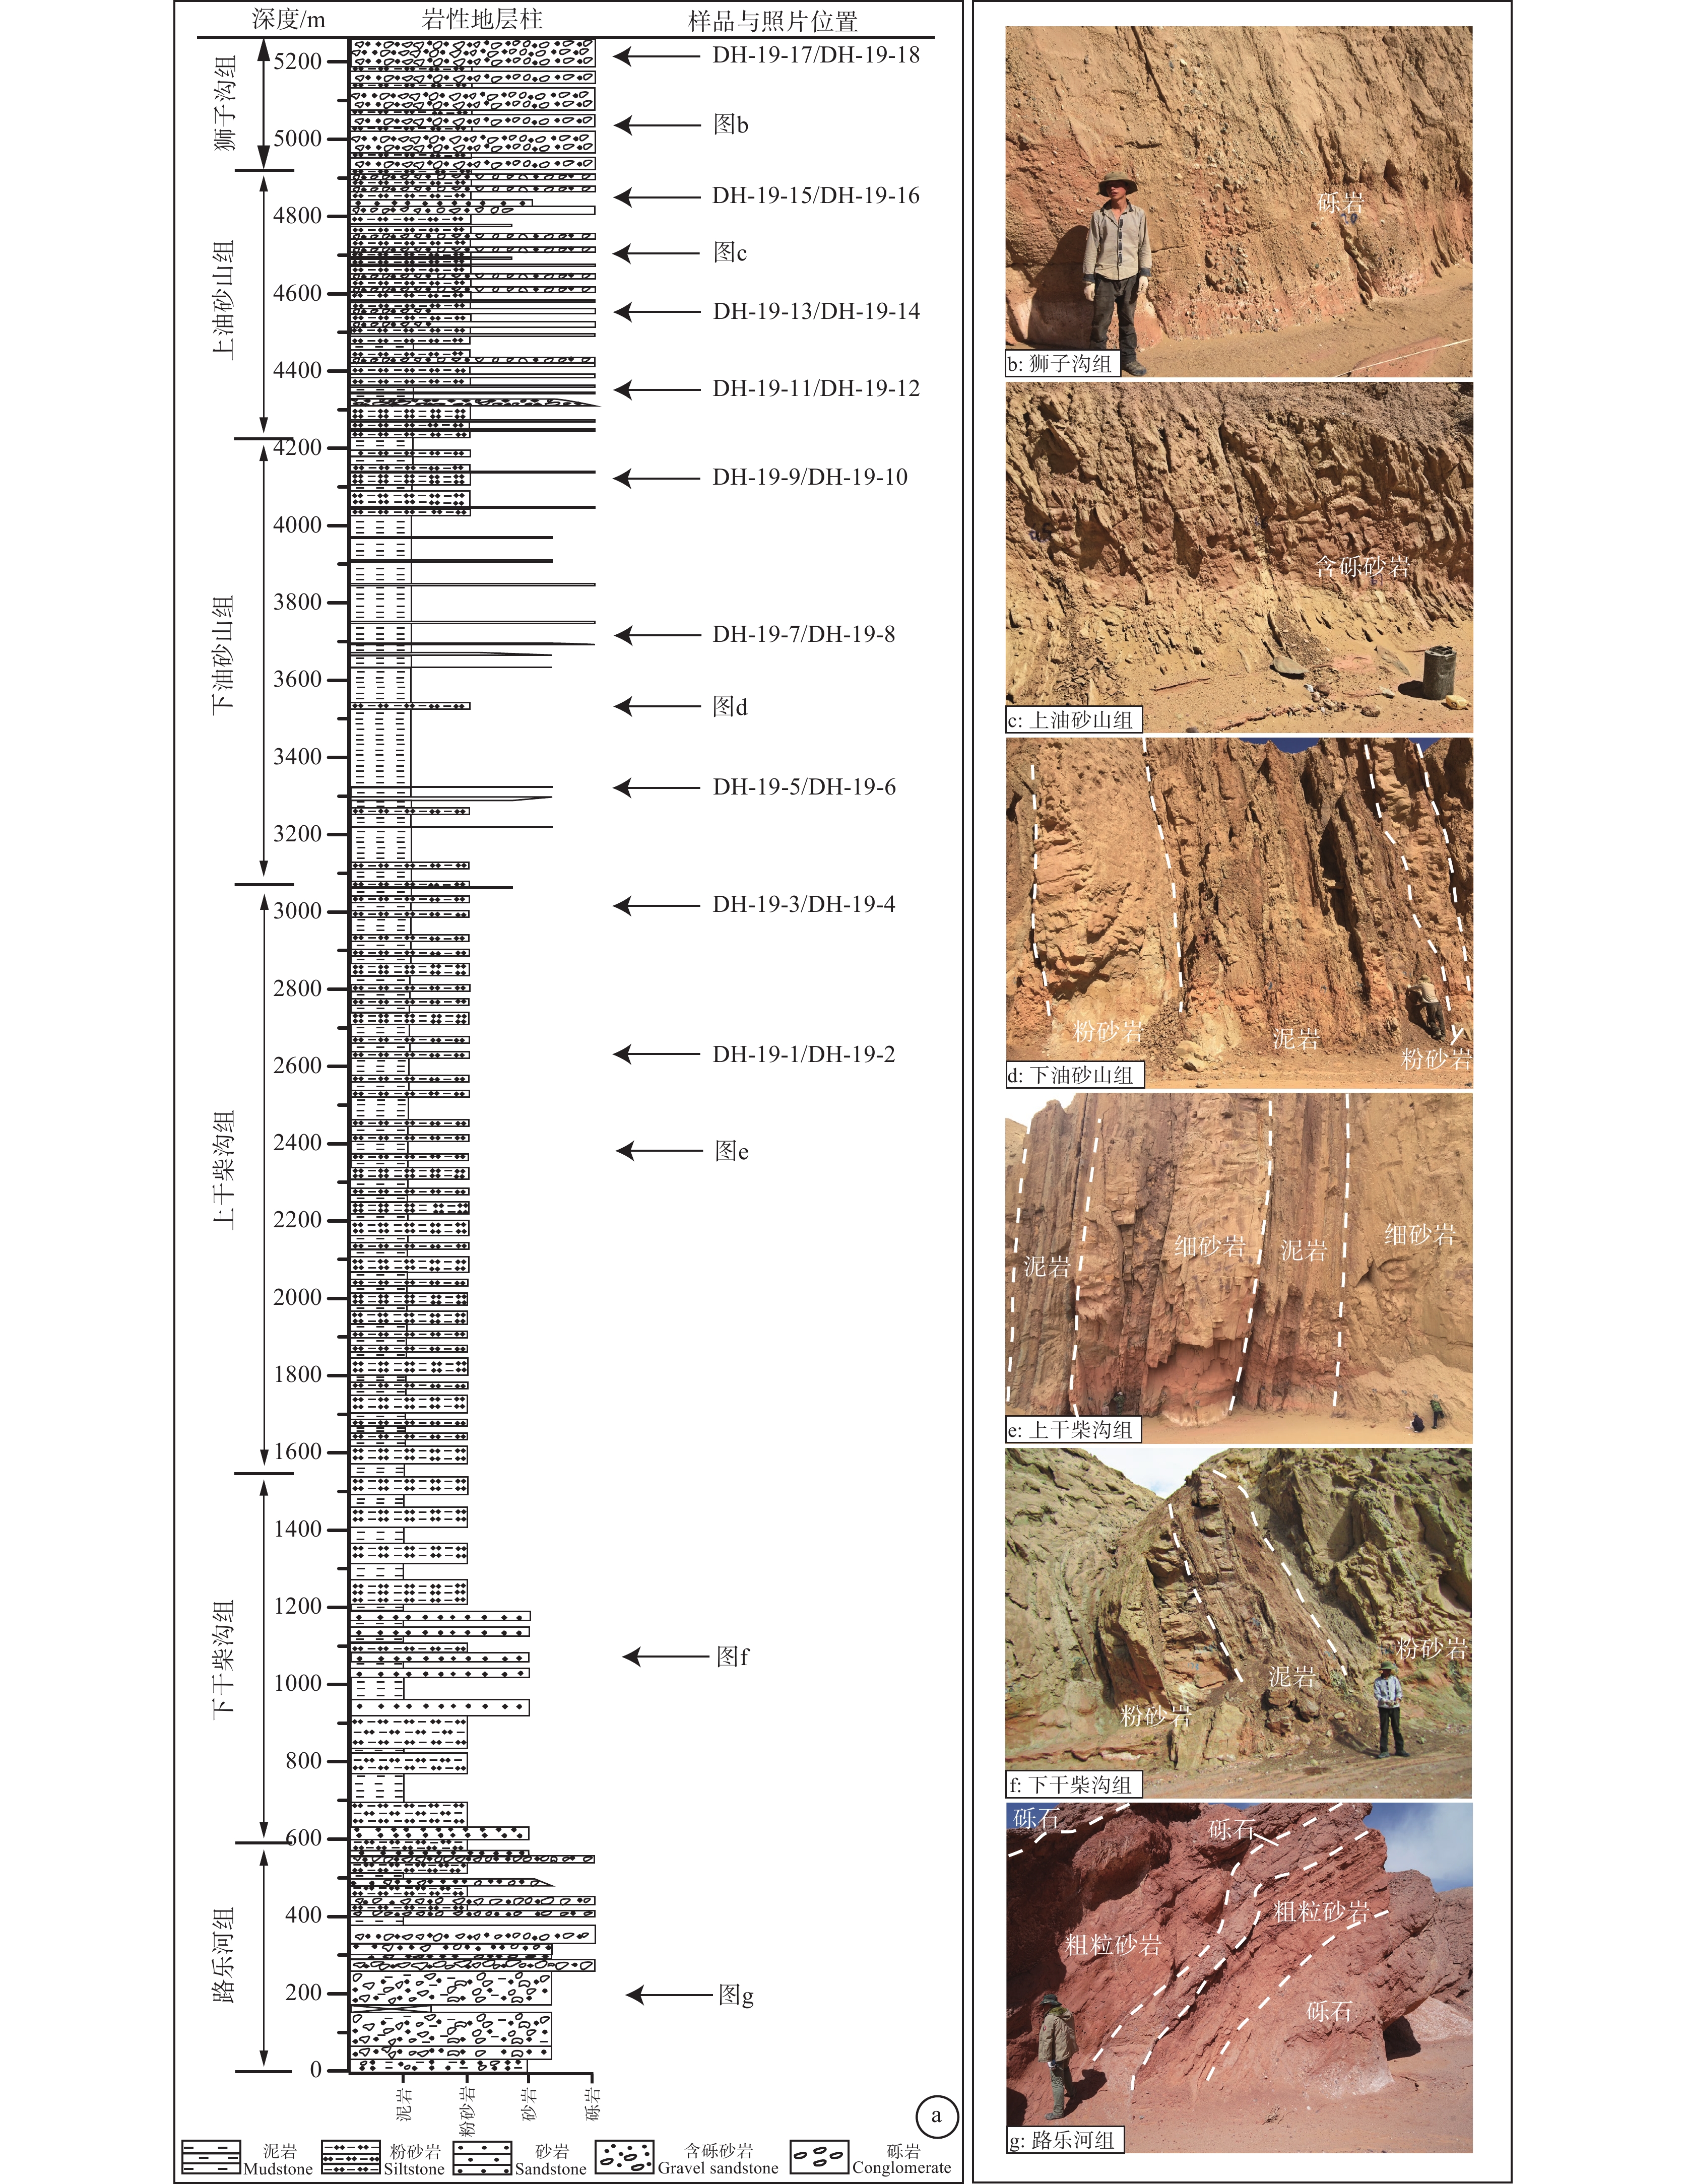
柴达木盆地内保存了非常完整的新生代沉积地层,最大厚度约12 km,平均厚度6~8 km (Métivier et al., 1998; Rieser et al., 2006)。前人将盆地的新生代沉积地层自下而上划分为7个组,包括路乐河组、下干柴沟组、上干柴沟组、下油砂山组、上油砂山组、狮子沟组以及七个泉组。野外出露的地层剖面中以柴北缘的大红沟和路乐河剖面最为连续、完整,其中大红沟剖面厚度约为6 km (Ji et al., 2017; Wang et al., 2017)。剖面沉积物粒度总体显示了先向上逐步细化,然后向上粗化的演变趋势 (Fang et al., 2007; Bush et al., 2016; Ji et al., 2017; Wang et al., 2017)。野外观察表明,大红沟剖面的路乐河组主要由分选差的砾岩与粗粒砂岩组成,发育槽状交叉层理,可能指示了冲积扇或辫状河流系统;下干柴沟组由细砂岩、粉砂岩与泥岩组成,可能指示了水动力条件较弱的河流与湖泊系统;上干柴沟组由中厚层的块状砂岩、粉砂岩或薄层砂岩与泥岩互层组成;下油砂山组由块状泥岩与砂岩、粉砂岩互层组成;上油砂山组由细—中粒砂岩与含砾砂岩组成,可能指示了辫状河流系统;狮子沟组主要由砾岩与中—粗粒砂岩组成,可能指示了辫状河流或冲积扇系统;七个泉组水平不整合覆盖在狮子沟组之上,由砾岩、砂岩与粉砂岩组成。目前,对柴达木盆地新生代地层的年龄仍有争议,主要存在两种观点:一种主要基于孢粉和介形虫化石等研究,认为其底部年龄为古新世(54~49 Ma; 刘泽纯等,1996; Ji et al., 2017);另一种观点主要基于哺乳动物化石等研究,认为底部年龄为晚渐新世—早中新世(25~21 Ma; Wang et al., 2017; Nie et al., 2019)。
3. 取样与分析
3.1 取样
样品采自柴达木盆地北缘的大红沟剖面,采样间距为200~400 m。在9个层位共采集了18件样品,其中每个层位分别含一件砂岩和泥岩样品。每件样品的详细位置、深度、以及岩性如图3所示。
3.2 分析方法
本文主要对大红沟剖面的泥岩进行了地球化学分析和黏土矿物分析,以及对砂岩进行了碎屑颗粒统计和重矿物分析。
3.2.1 地球化学分析
对采集的9件泥岩样品进行元素分析,首先将样品经过冷冻干燥后,用无污染的粉碎机粉碎、研磨至200目,然后在烘箱中烘烤约3个小时去除水分。主量元素用硼酸锂+硝酸锂密封熔融后,通过X射线荧光光谱仪进行分析。主量元素浓度在表1中以氧化物重量百分比的形式给出。微量元素和稀土元素是由硼酸锂熔融和四酸消解后,通过等离子质谱仪和光谱仪测得。
表 1 大红沟剖面泥岩样品的主量元素含量(%)Table 1. Major element contents (%) of mudstone samples in the Dahonggou section样品号 深度/m SiO2 TiO2 Al2O3 Fe2O3 MnO MgO CaO Na2O K2O P2O5 DH−19−1 2601.4 53.1 0.7 17.4 7.5 0.06 2.8 4.9 1.4 3.5 0.15 DH−19−3 3002.8 57.1 0.7 15.9 6.1 0.06 3.1 3.7 2.0 3.4 0.13 DH−19−5 3323.9 64.4 0.7 13.1 5.0 0.06 2.3 3.4 2.2 2.6 0.13 DH−19−7 3708.8 50.6 0.6 13.1 5.5 0.13 2.9 10.0 1.9 2.8 0.16 DH−19−9 4102.5 51.7 0.8 17.0 6.3 0.07 3.3 6.2 1.5 3.4 0.13 DH−19−11 4342.5 61.3 0.6 11.4 4.3 0.09 1.9 7.2 2.1 2.2 0.14 DH−19−13 4577.0 59.9 0.7 14.4 6.4 0.07 2.9 3.8 2.1 3.0 0.14 DH−19−15 4856.0 61.7 0.6 15.1 5.9 0.08 2.5 2.7 1.7 3.0 0.14 DH−19−17 5269.6 52.6 0.7 16.1 6.7 0.11 3.1 5.9 2.0 3.2 0.14 UCC 65.9 0.5 15.2 4.5 0.07 2.2 4.2 3.9 3.4 0.20 注:UCC数据来自Taylor and McLennan (1985)。 3.2.2 砂岩碎屑颗粒统计
将砂岩样品磨成薄片,用偏光显微镜观察、并记录9件砂岩以及路乐河组的2件砂岩的矿物成分、粒度、分选和磨圆度。采用Gazzi−Dickinson法对9件砂岩薄片进行碎屑颗粒统计分析(Dickinson, 1985)。对中等至粗粒砂岩进行点计数,以尽量减少颗粒粒度影响(Ingersoll et al., 1984),每件样品至少统计300个点。随后,绘制了石英−长石−岩屑(Qt−F−L)三角图。
3.2.3 重矿物分析
重矿物由于具有抗风化、耐磨蚀和化学性质稳定等特征,因此经常用作沉积源区示踪的敏感指标(Morton, 1985)。具体的实验步骤可包括:破碎、研磨;筛分、淘洗;重液分离;镜下鉴定;矿物定量。首先对样品进行破碎、充分研磨,经过筛分和多次淘洗获得重矿物;之后采用重液将重矿物分离,其中重液主要为三溴甲烷;最后在偏光显微镜下进行矿物的物理性质鉴定,包括矿物颜色、晶体形状、光泽、磨圆度、透明度和硬度等,并通过颗粒统计得出不同矿物的百分含量(任迎新,1987)。
3.2.4 黏土矿物分析
X射线衍射分析是利用黏土矿物具有层状结构的特征和X射线衍射原理进行测定(蒲海波,2011),主要分为3个步骤:黏土矿物的提取、样品处理和制片,以及X射线衍射和谱线分析。首先将沉积岩样品粉碎、研磨成粉末,采用悬浮液或离心等方法提取粒径小于2 μm的黏土矿物,之后进行黏土样品涂片试样和X射线衍射测试。黏土矿物的物相鉴定工作获得了自然风干样品分析片(N片)、乙二醇饱和处理样品分析片(EG片)和高温片(T片)三种不同的谱线,本次研究主要对谱线较完整的乙二醇饱和片进行分析。最后,利用石油天然气行业标准《沉积岩中黏土矿物和常见非黏土矿物X射线衍射分析方法》(SY/T5163−2018)给出的不同矿物组合的百分含量计算公式,得到不同黏土矿物的相对含量。
4. 实验结果
4.1 主量元素
大红沟剖面的主量元素数据如表1所示。沉积物中Al2O3 (11.4%~17.4%,平均值为14.8%)和SiO2 (50.6%~64.4%,平均值为56.9%)含量最高;其次为Fe2O3 (4.3%~7.5%,平均值为6.0%)、MgO (1.9%~3.3%,平均值为2.7%)、CaO (2.7%~10.0%,平均值为5.7%)、Na2O (1.4%~2.2%,平均值为1.9%)、K2O (2.2%~3.5%,平均值为3.0%)以及TiO2 (0.6%~0.8%,平均值为0.7%);MnO (0.06%~0.13%,平均值为0.08%)和P2O5 (0.13%~0.16%,平均值为0.14%) 含量最低。
4.2 微量元素
微量元素数据见表2。除Zr (137×10−6~280×10−6)、Zn (61×10−6~110×10−6)、Ba (431×10−6~1090×10−6)、Sr (151.5×10⁻⁶~262.0×10⁻⁶)、V (80×10−6~132×10−6)和Rb (98.4×10⁻⁶~160.5×10⁻⁶)含量超过100×10−6外,其他微量元素含量均小于100×10−6。Rb/Sr比值范围为0.53~1.01,平均值为0.76;Th/Sc比值范围为1.05~1.39,平均值为1.19。
表 2 大红沟剖面泥岩样品的微量元素含量与比值Table 2. Trace element contents and ratio of mudstone samples in the Dahonggou section样品号 深度/m 元素含量/10−6 比值 V Cr Co Zn Rb Sr Ba Th U Zr Sc Rb/Sr Th/Sc DH−19−1 2601.4 127 89 17.3 109 153.0 151.5 445 16.8 2.8 159 16.0 1.01 1.05 DH−19−3 3002.8 118 87 18.0 100 160.5 188.0 505 19.0 5.9 193 14.6 0.85 1.30 DH−19−5 3323.9 95 75 13.1 75 122.0 168.0 431 15.5 3.6 280 11.1 0.73 1.39 DH−19−7 3708.8 98 72 14.3 82 126.5 262.0 1090 14.6 3.2 162 11.6 0.48 1.25 DH−19−9 4102.5 130 95 20.9 110 154.0 209.0 461 18.2 4.5 163 15.9 0.74 1.14 DH−19−11 4342.5 80 61 11.0 61 98.4 184.5 477 11.3 2.9 209 9.0 0.53 1.26 DH−19−13 4577.0 111 85 16.6 89 130.5 171.0 472 14.2 3.3 165 12.9 0.76 1.10 DH−19−15 4856.1 110 81 17.0 88 136.5 153.0 457 14.3 3.7 173 13.0 0.89 1.10 DH−19−17 5269.6 132 83 17.6 97 141.0 166.5 487 15.1 3.8 137 13.7 0.85 1.10 UCC 60 35 10.0 71 112.0 350.0 550 10.7 2.8 190 11.0 注:UCC数据来自Taylor and McLennan (1985)。 4.3 稀土元素
由表3可看出,轻稀土元素(La、Ce、Nd、Sm、Pr)含量相对较高,∑LREE为143.1×10⁻⁶~195.8 ×10⁻⁶ (∑LREE=La+Ce+Pr+Nd+Sm+Eu),平均值为169.06×10⁻⁶;而重稀土元素(Gd、Tb、Dy、Ho、Er、Tm、Yb、Lu)含量较低,∑HREE为17.1×10⁻⁶~22.4×10⁻⁶ (∑HREE=Gd+Tb+Dy+Ho+Er+Tm+Yb+Lu),平均值为19.34×10⁻⁶。Eu/Eu*平均值为0.61。从球粒陨石标准化曲线可以看出所有样品具有相似的REE配分模式(图4)。
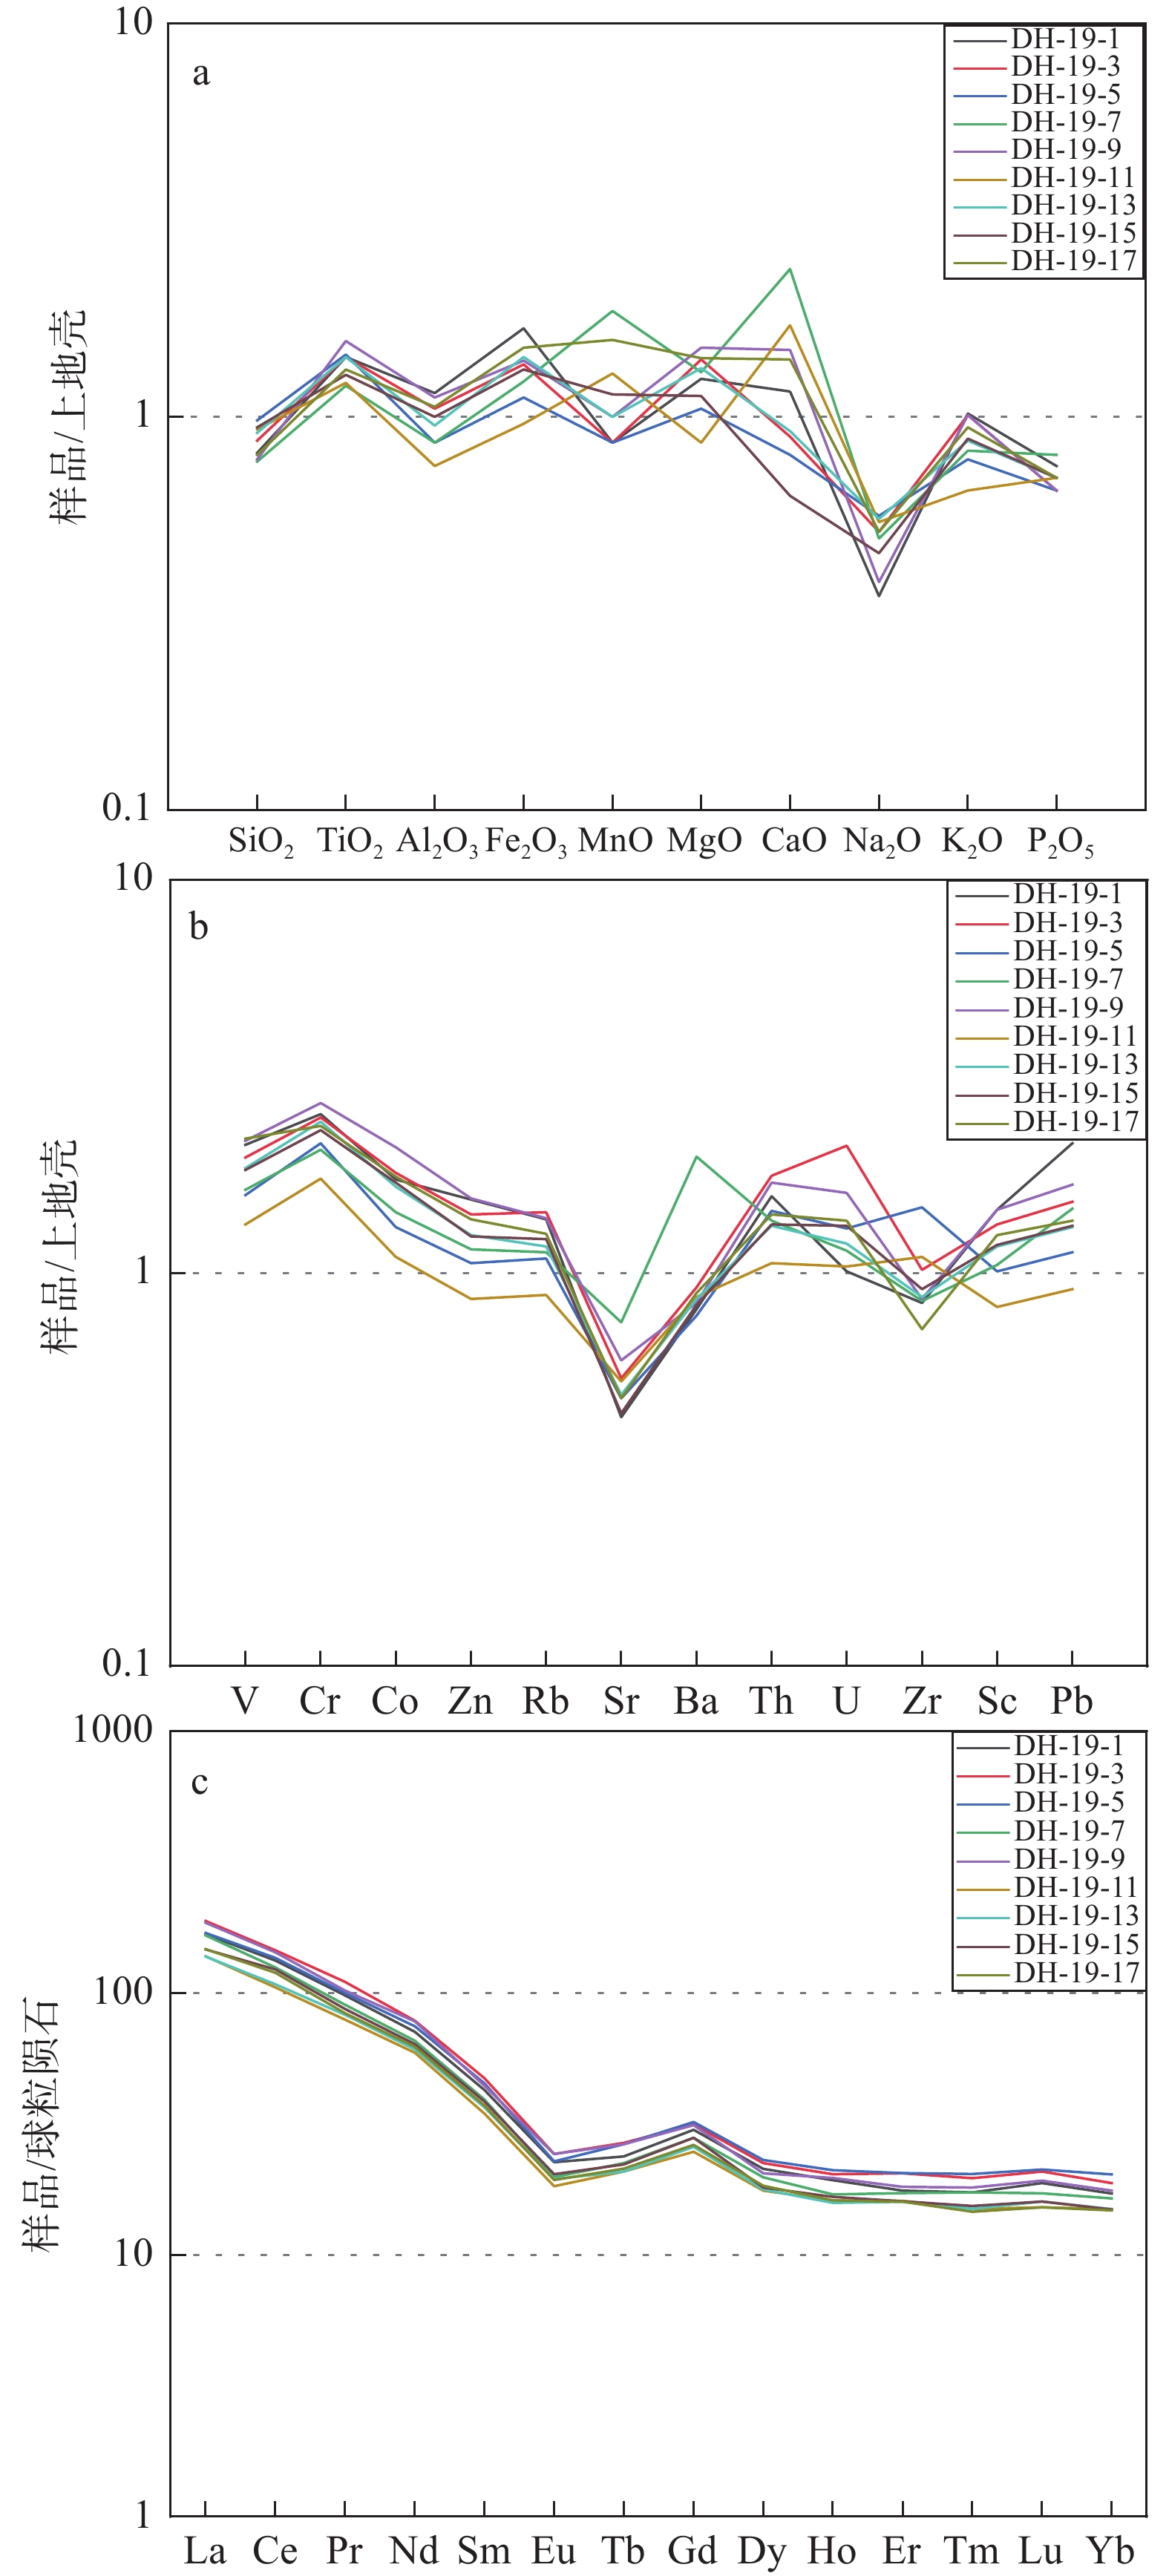
表 3 大红沟剖面泥岩样品的稀土元素含量与比值Table 3. Rare earth element contents and ratio of mudstone samples in the Dahonggou section样品号 深度/m 元素含量/10−6 比值 La Ce Pr Nd Sm Eu Tb Gd Dy Ho Er Tm Lu Yb Eu/Eu* DH−19−1 2601.4 41.1 85.0 9.4 33.7 6.6 1.3 0.9 6.1 5.4 1.1 2.9 0.5 0.5 2.8 0.62 DH−19−3 3002.8 46.2 93.1 10.6 37.2 7.3 1.4 1.0 6.4 5.7 1.2 3.4 0.5 0.5 3.1 0.62 DH−19−5 3323.9 41.6 87.0 9.6 35.4 7.0 1.3 1.0 6.6 5.9 1.2 3.4 0.5 0.5 3.4 0.59 DH−19−7 3708.8 40.7 80.0 8.7 31.2 6.0 1.2 0.8 5.7 5.0 1.0 2.9 0.5 0.4 2.7 0.59 DH−19−9 4102.5 45.5 91.5 9.8 37.0 6.8 1.4 1.0 6.4 5.2 1.1 3.0 0.5 0.5 2.9 0.64 DH−19−11 4342.5 33.9 67.1 7.6 28.1 5.3 1.1 0.8 5.1 4.5 0.9 2.7 0.4 0.4 2.5 0.62 DH−19−13 4577.0 33.8 69.0 7.9 28.9 5.6 1.1 0.8 5.3 4.5 0.9 2.7 0.4 0.4 2.5 0.62 DH−19−15 4856.1 36.0 78.6 8.4 30.3 5.9 1.2 0.8 5.7 4.6 1.0 2.7 0.4 0.4 2.5 0.61 DH−19−17 5269.6 36.1 76.4 8.1 29.6 5.7 1.1 0.8 5.4 4.7 0.9 2.7 0.4 0.4 2.4 0.61 注:Eu/Eu*=Eu(N) /0.5(Sm(N)+Gd(N)),N表示球粒陨石标准化,数据来自Palme (1988)。 ![]() Figure 4. UCC−normalized distributions (Taylor and McLennan, 1985) of major elements and trace elements (a, b) and Chondrite−normalized distributions (Palme, 1988) of rare earth elements of mudstones (c)
Figure 4. UCC−normalized distributions (Taylor and McLennan, 1985) of major elements and trace elements (a, b) and Chondrite−normalized distributions (Palme, 1988) of rare earth elements of mudstones (c)4.4 砂岩碎屑成分
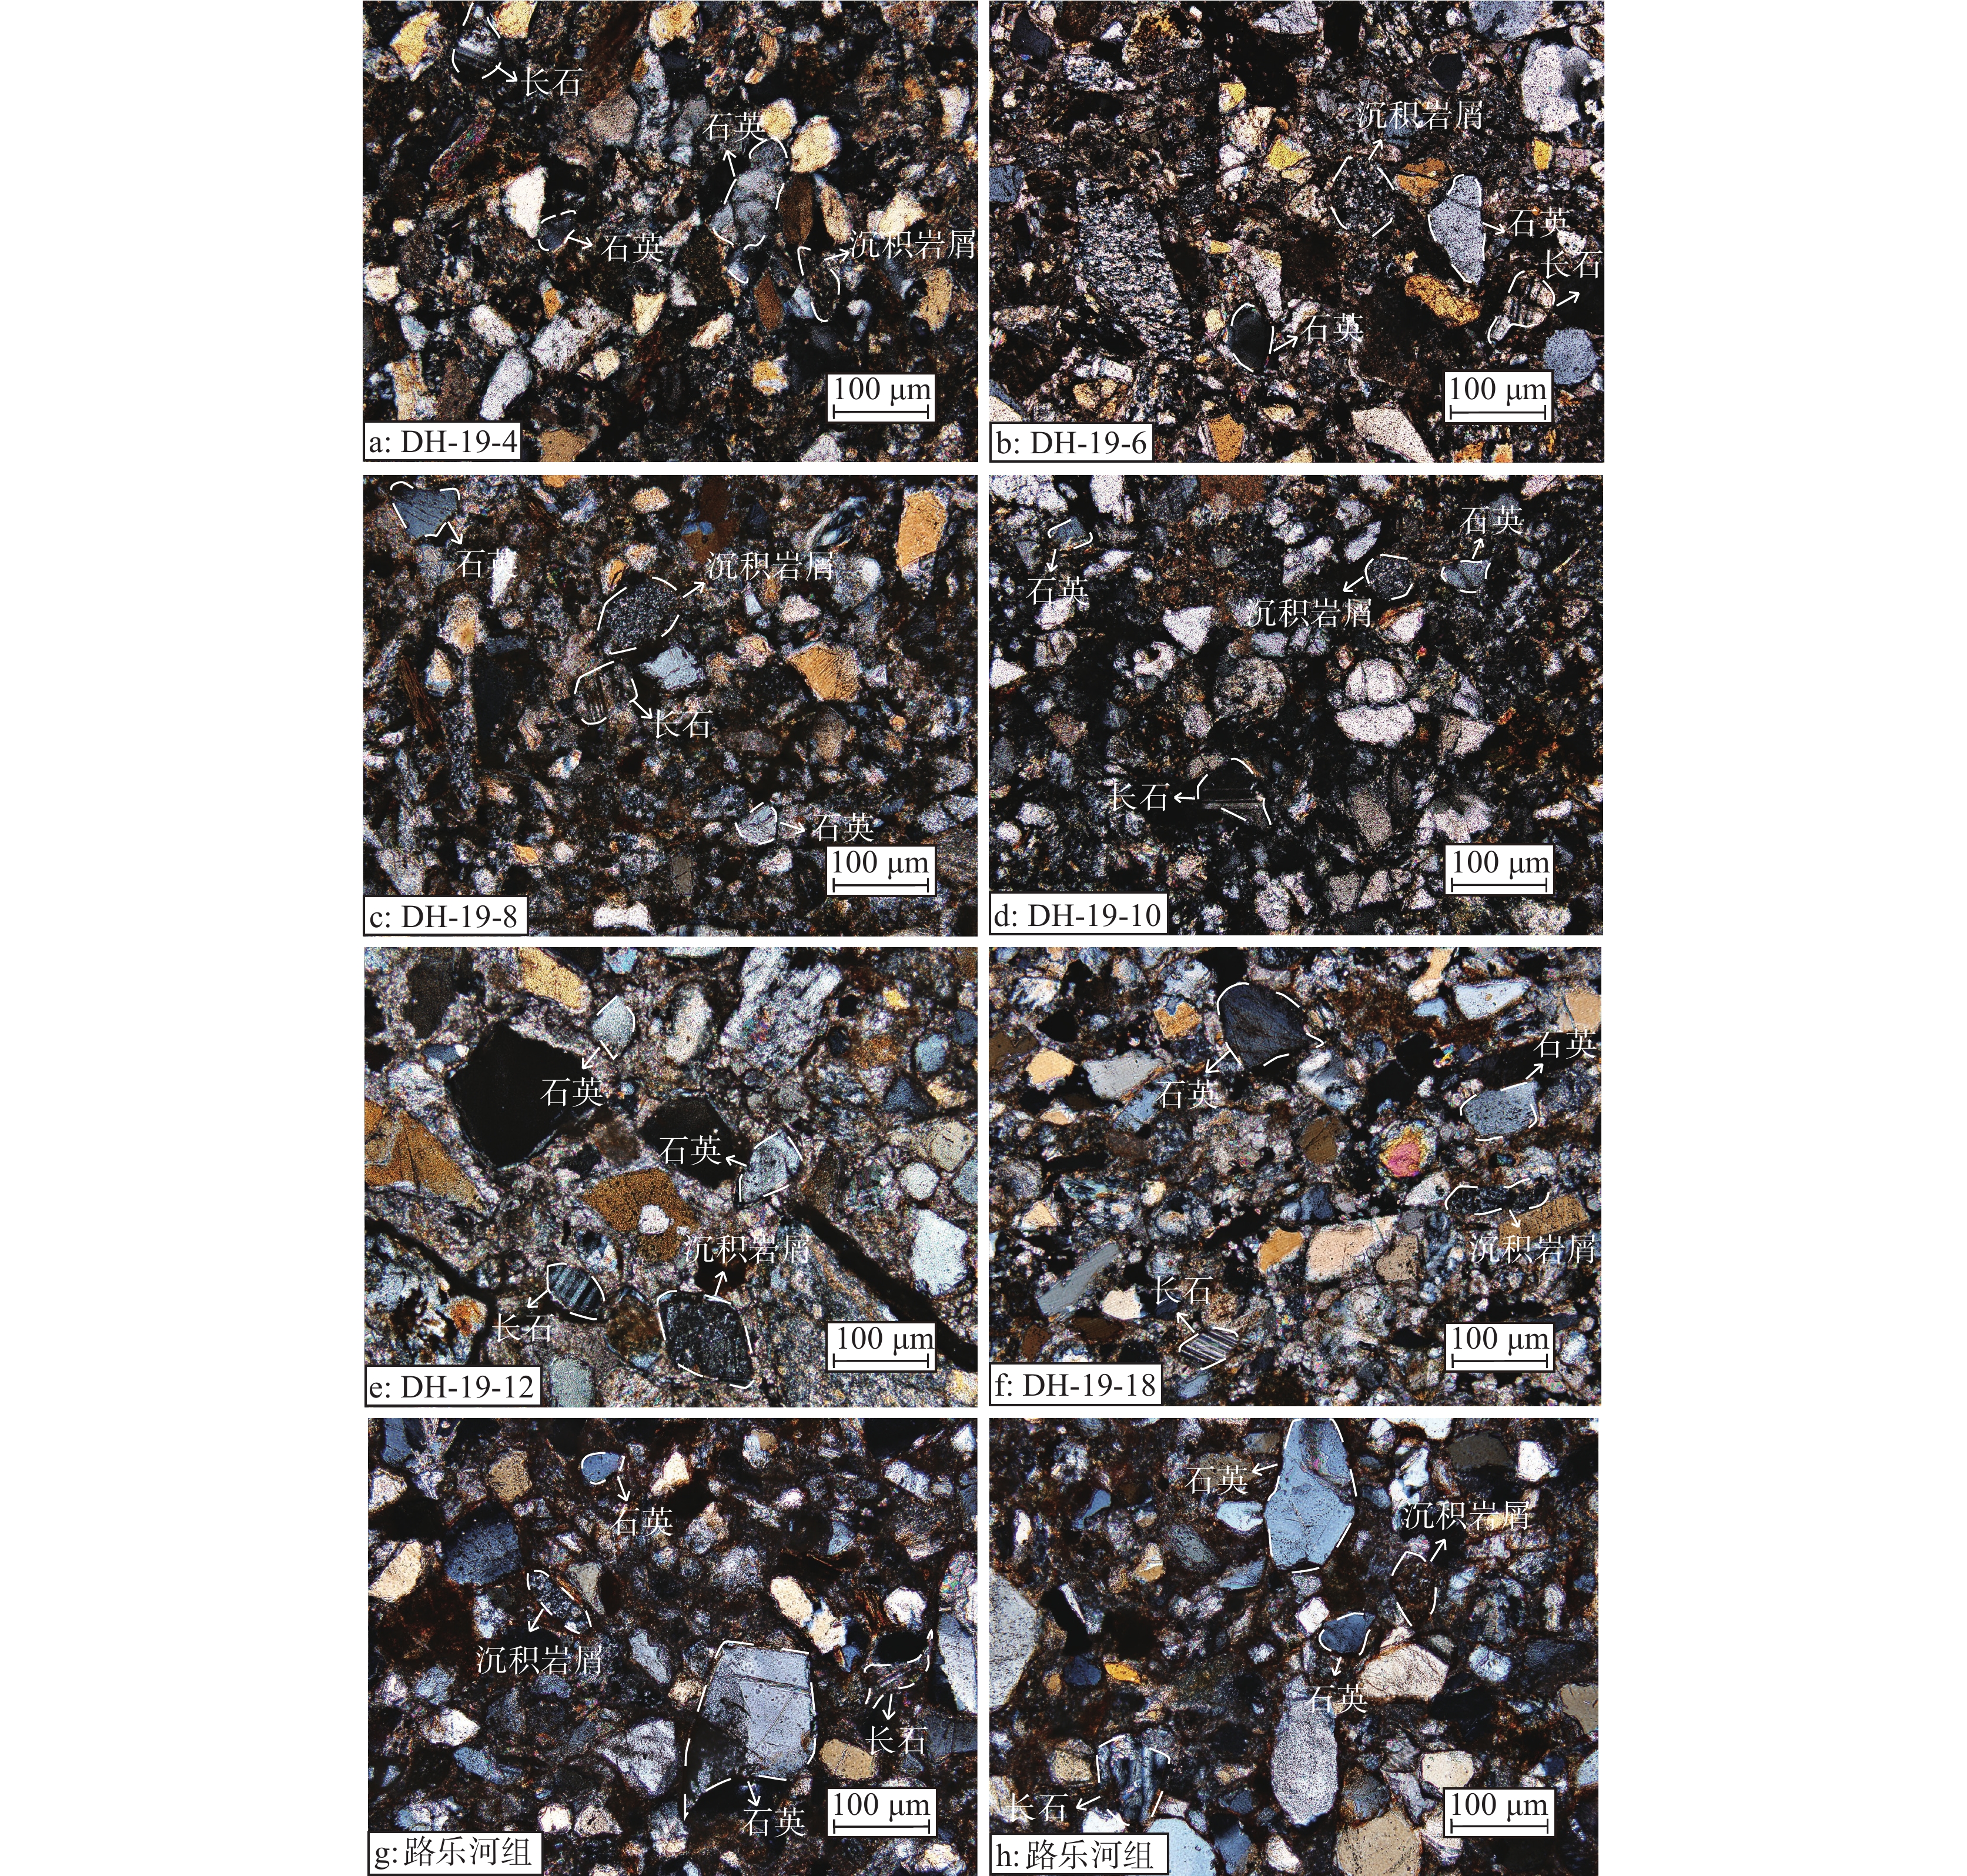
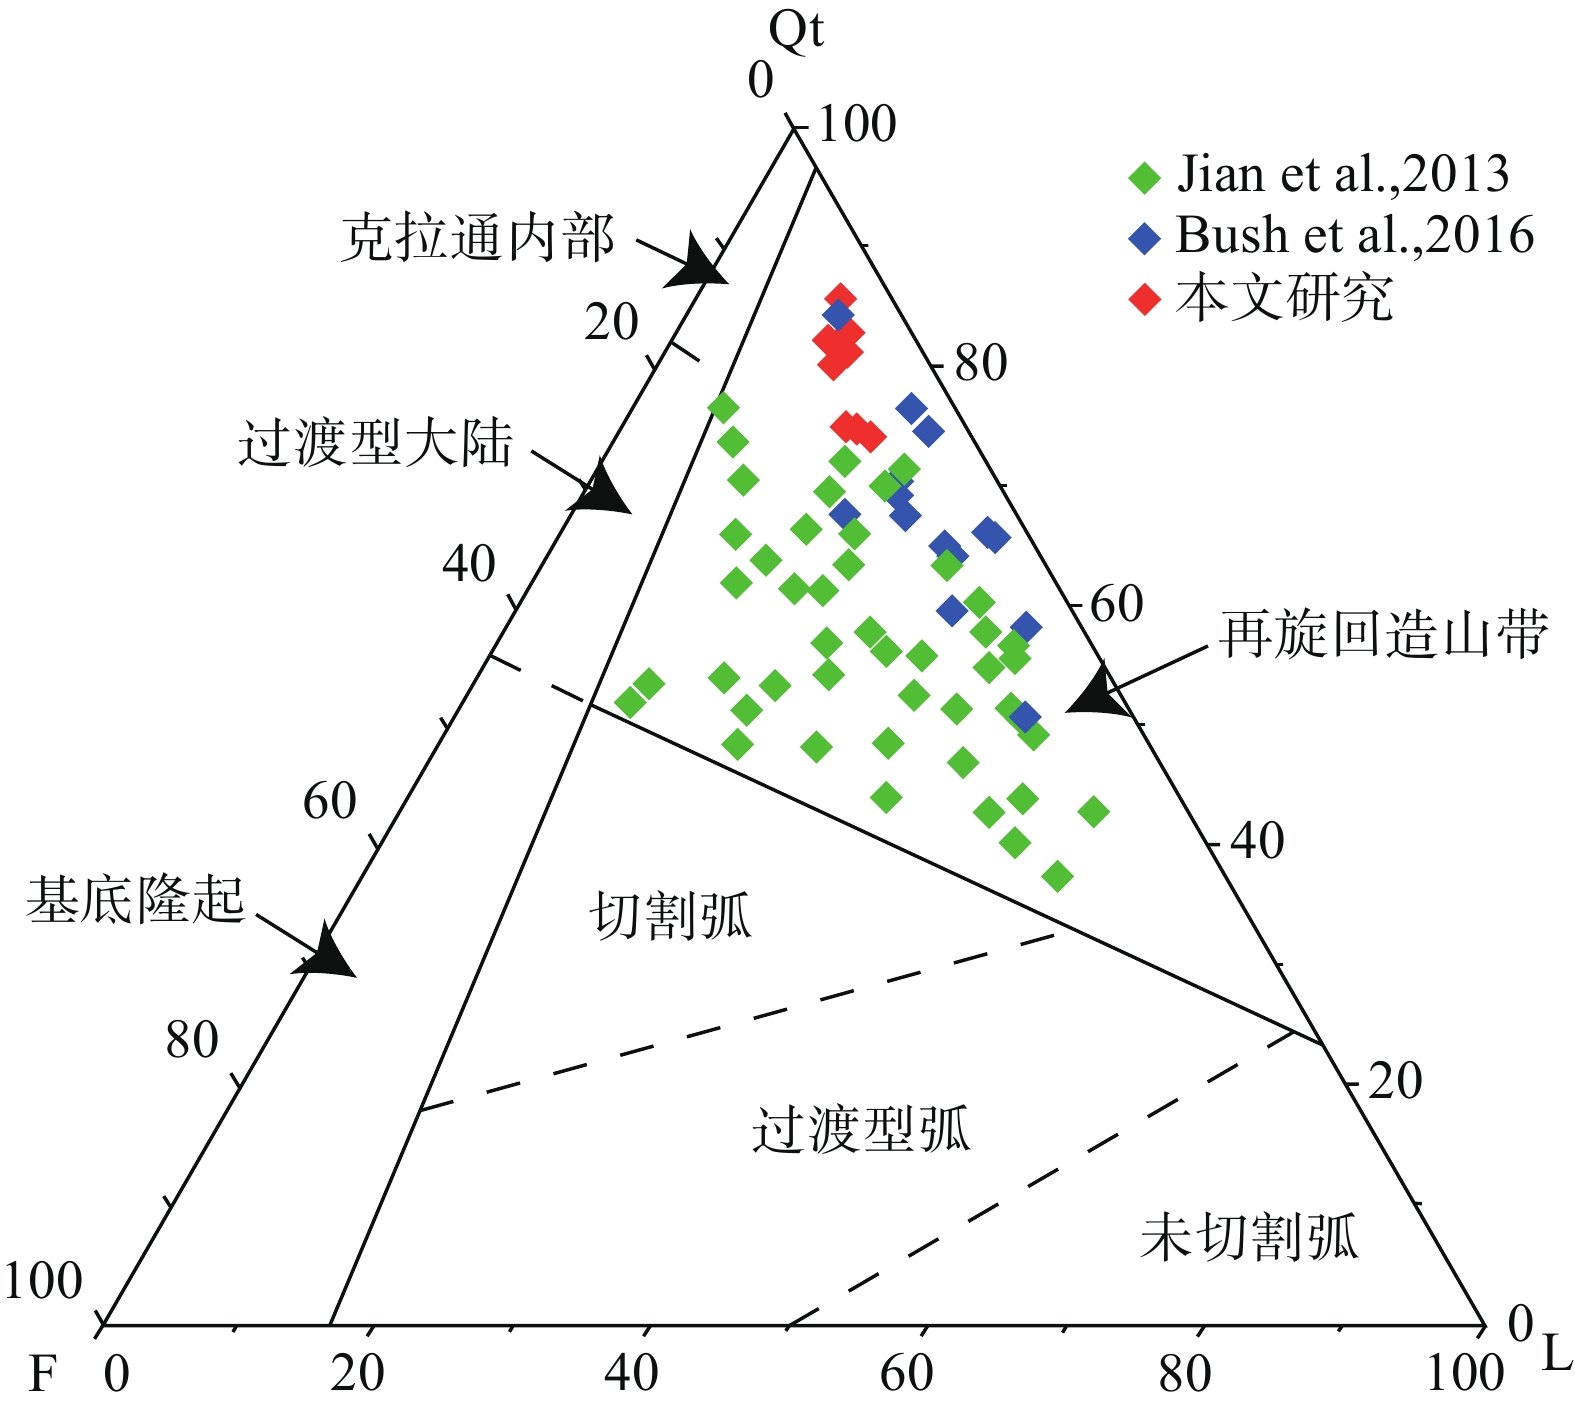
砂岩的碎屑颗粒统计结果见表4。砂岩的主要成分为石英(Qt)、以及少量的长石(F)和岩屑(L),其中岩屑主要由沉积岩屑组成(图5,图6)。石英含量为74.3%~86.0%,平均值为79.7%;岩屑次之,含量为10.7%~18.7%,平均值为14.2%;长石含量最少为3.3%~8.3%,平均值为6.1%。碎屑颗粒统计结果见图6。DH−19−2样品由于颗粒太小,因此没有进行统计。
表 4 大红沟剖面8件砂岩的碎屑颗粒组成Table 4. Detrital framework grain composition of 8 sandstones in the Dahonggou section样品号 深度/m 石英(Qt) 长石(F) 岩屑(L) Qt/% F/% L/% DH−19−4 3002.8 257 27 59 74.9 7.9 17.2 DH−19−6 3323.9 258 10 32 86.0 3.3 10.7 DH−19−8 3708.8 247 18 35 82.3 6.0 11.7 DH−19−10 4102.5 225 25 50 75.0 8.3 16.7 DH−19−12 4342.5 223 21 56 74.3 7.0 18.7 DH−19−14 4577.0 249 13 38 83.0 4.3 12.7 DH−19−16 4856.1 241 20 39 80.3 6.7 13.0 DH−19−18 5269.6 250 16 41 81.4 5.2 13.4 ![]() 图 6 柴北缘砂岩碎屑颗粒的石英−长石−岩屑三角图构造源区划分来自Dickinson (1985)Figure 6. Q−F−L ternary diagrams of framework grains of sandstones in the northern Qaidam Basin marginThe division of tectonic source areas comes from Dickinson (1985)
图 6 柴北缘砂岩碎屑颗粒的石英−长石−岩屑三角图构造源区划分来自Dickinson (1985)Figure 6. Q−F−L ternary diagrams of framework grains of sandstones in the northern Qaidam Basin marginThe division of tectonic source areas comes from Dickinson (1985)4.5 重矿物组合
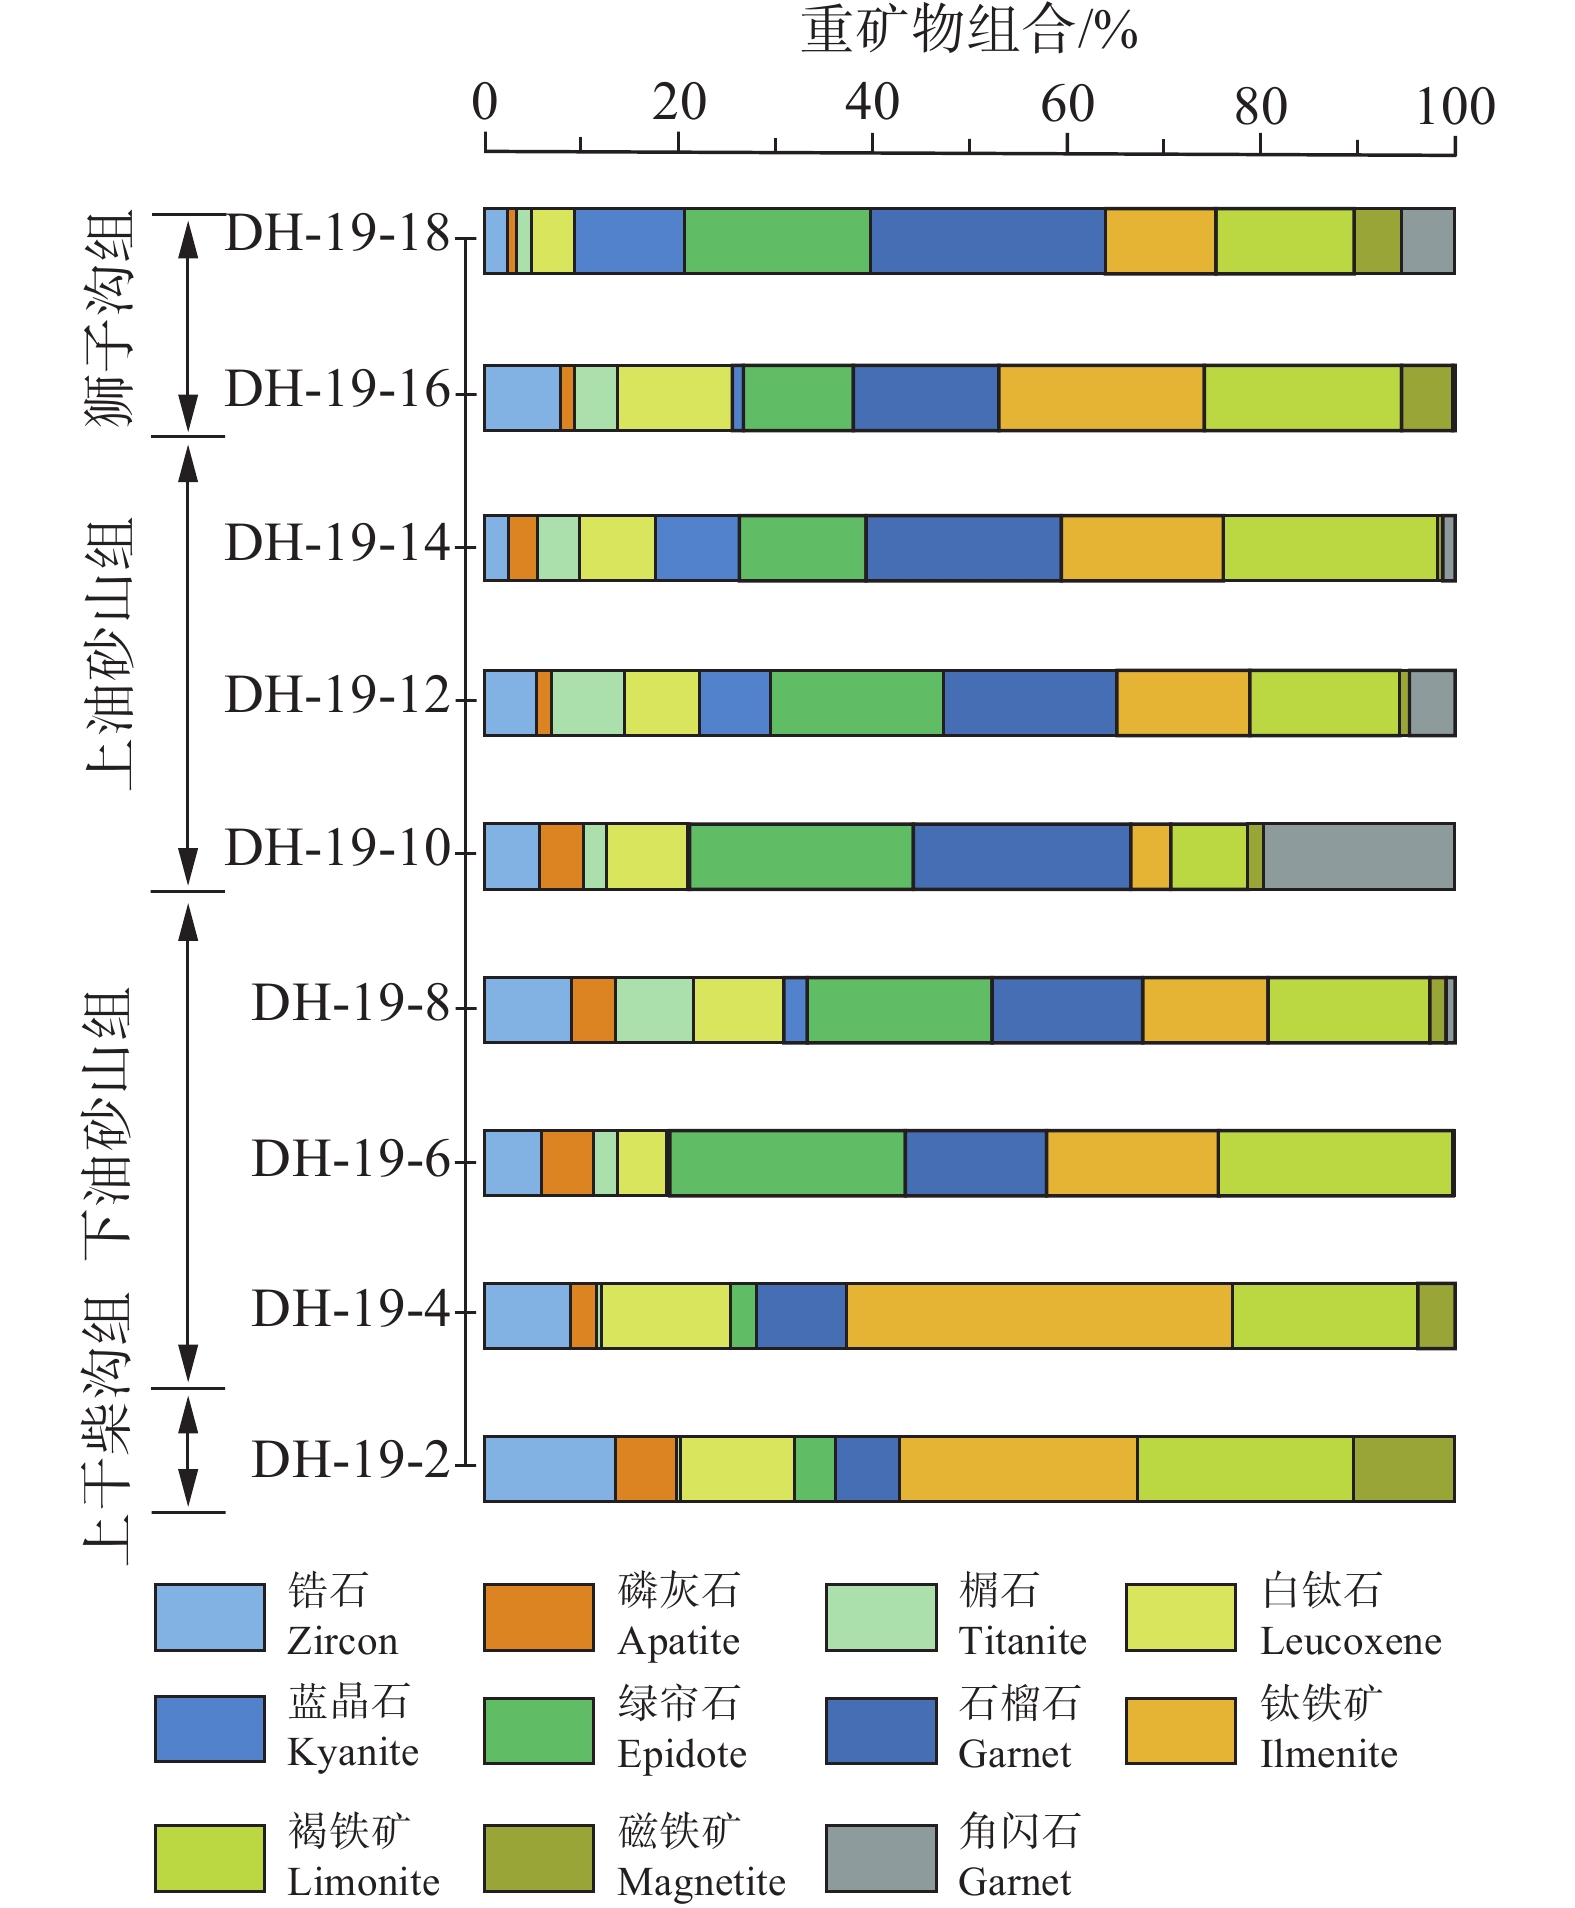
重矿物分析数据列于表5。其中,钛铁矿(3.0%~39.1%,平均值为17.4%)、褐铁矿(7.6%~23.9%,平均值为17.4%)、绿帘石(2.7%~23.9%,平均值为14.4%)和石榴石(6.4%~22.8%,平均值为15.5%)所占比重较大,而锆石、白钛石、蓝晶石、磷灰石、磁铁矿、角闪石和榍石等矿物相对较少。
表 5 大红沟剖面砂岩重矿物含量(%)Table 5. Heavy mineral contents (%) of sandstones in the Dahonggou section样品号 深度/m 锆石 磷灰石 金红石 锐钛矿 榍石 白钛石 蓝晶石 绿帘石 电气石 石榴石 辉石 钛铁矿 褐铁矿 磁铁矿 角闪石 DH−19−2 2601.40 13.20 6.02 1.50 1.50 0.50 11.28 N 4.17 0.13 6.38 N 23.70 21.48 10.13 N DH−19−4 3002.76 8.79 2.66 1.40 0.22 0.44 13.01 N 2.66 N 9.15 N 39.08 18.79 3.78 N DH−19−6 3323.86 5.97 5.22 0.75 0.05 2.39 5.04 0.33 23.88 0.25 14.28 0.25 17.48 23.88 N 0.25 DH−19−8 3708.76 8.62 4.31 2.21 0.53 7.82 8.94 2.31 18.31 0.42 14.93 0.56 12.39 16.06 1.49 0.99 DH−19−10 4102.48 5.54 4.28 1.68 0.63 2.24 7.92 0.14 22.04 0.73 21.30 1.71 3.91 7.59 1.42 18.85 DH−19−12 4342.54 5.23 1.42 3.27 N 7.19 7.29 6.86 16.93 0.40 17.13 1.21 12.90 14.71 0.94 4.43 DH−19−14 4577.02 2.49 2.85 1.97 0.15 4.31 7.53 8.33 12.60 0.64 19.44 0.21 16.24 21.36 0.53 1.28 DH−19−16 4856.05 7.65 1.26 1.98 0.63 4.32 11.34 1.08 10.82 1.30 14.42 0.15 20.33 19.47 5.10 0.10 DH−19−18 5269.57 2.32 0.77 2.17 N 1.55 4.18 10.68 18.05 1.09 22.80 1.36 10.72 13.43 4.65 5.16 注:表格中N指该处没有数据。 上干柴沟组重矿物组合以高丰度的钛铁矿和褐铁矿为特征,平均值分别为32.1%和20.7%,其次为锆石和白钛石;下油砂山组绿帘石、石榴石和角闪石含量逐渐增多并接近峰值,平均值分别为22.1%、17.5%和7%,褐铁矿和钛铁矿含量减少;在上油砂山组和狮子沟组中,石榴石含量达到最大值,平均值为24.2%,角闪石和绿帘石含量略有降低,但仍比上干柴沟组含量高,褐铁矿和钛铁矿含量呈现降低趋势(图7)。总的来说,该地区的变质岩(如角闪石、绿帘石、石榴石等)增加,火成岩(如锆石、磷灰石、褐铁矿和钛铁矿)减少。
ZTR指数是指稳定矿物锆石、电气石和金红石在透明重矿物中所占的比例(Hubert, 1962)。大红沟剖面的上干柴沟组具有较高的ZTR值(40.25%~44.41%;表5);下油砂山组、上油砂山组和狮子沟组砂岩中ZTR值明显降低(8.32%~24.89%;表5)。
4.6 黏土矿物
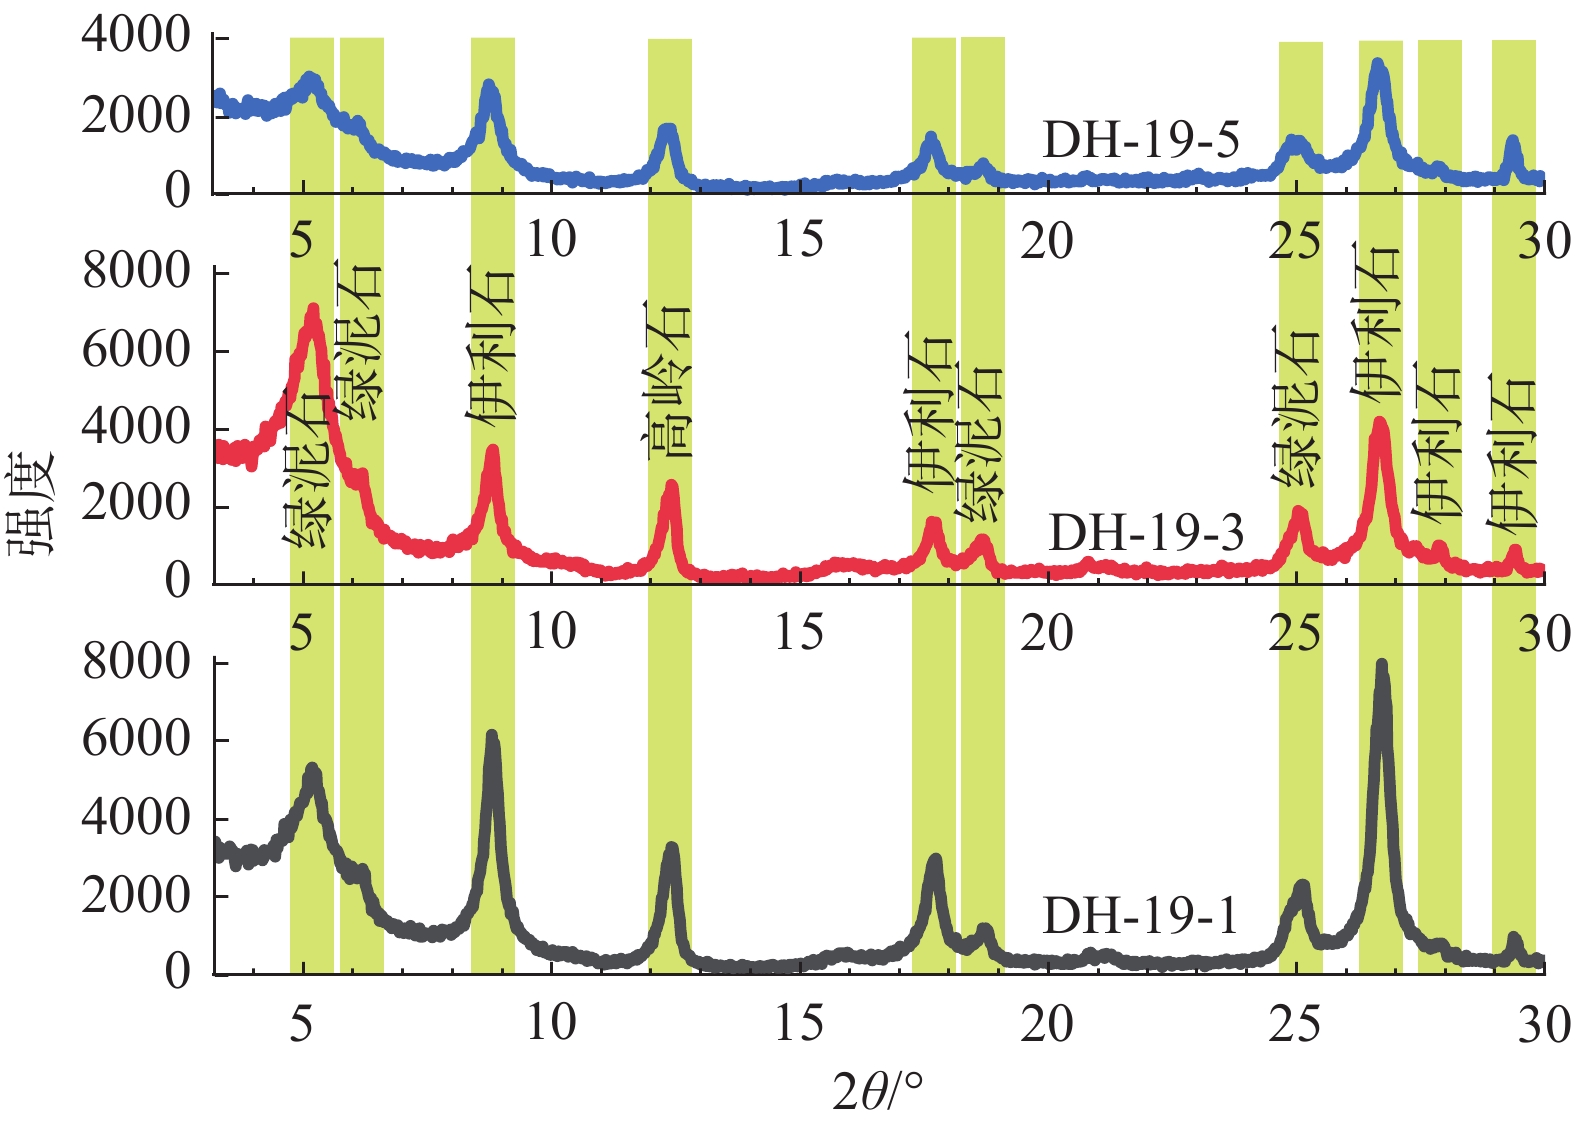
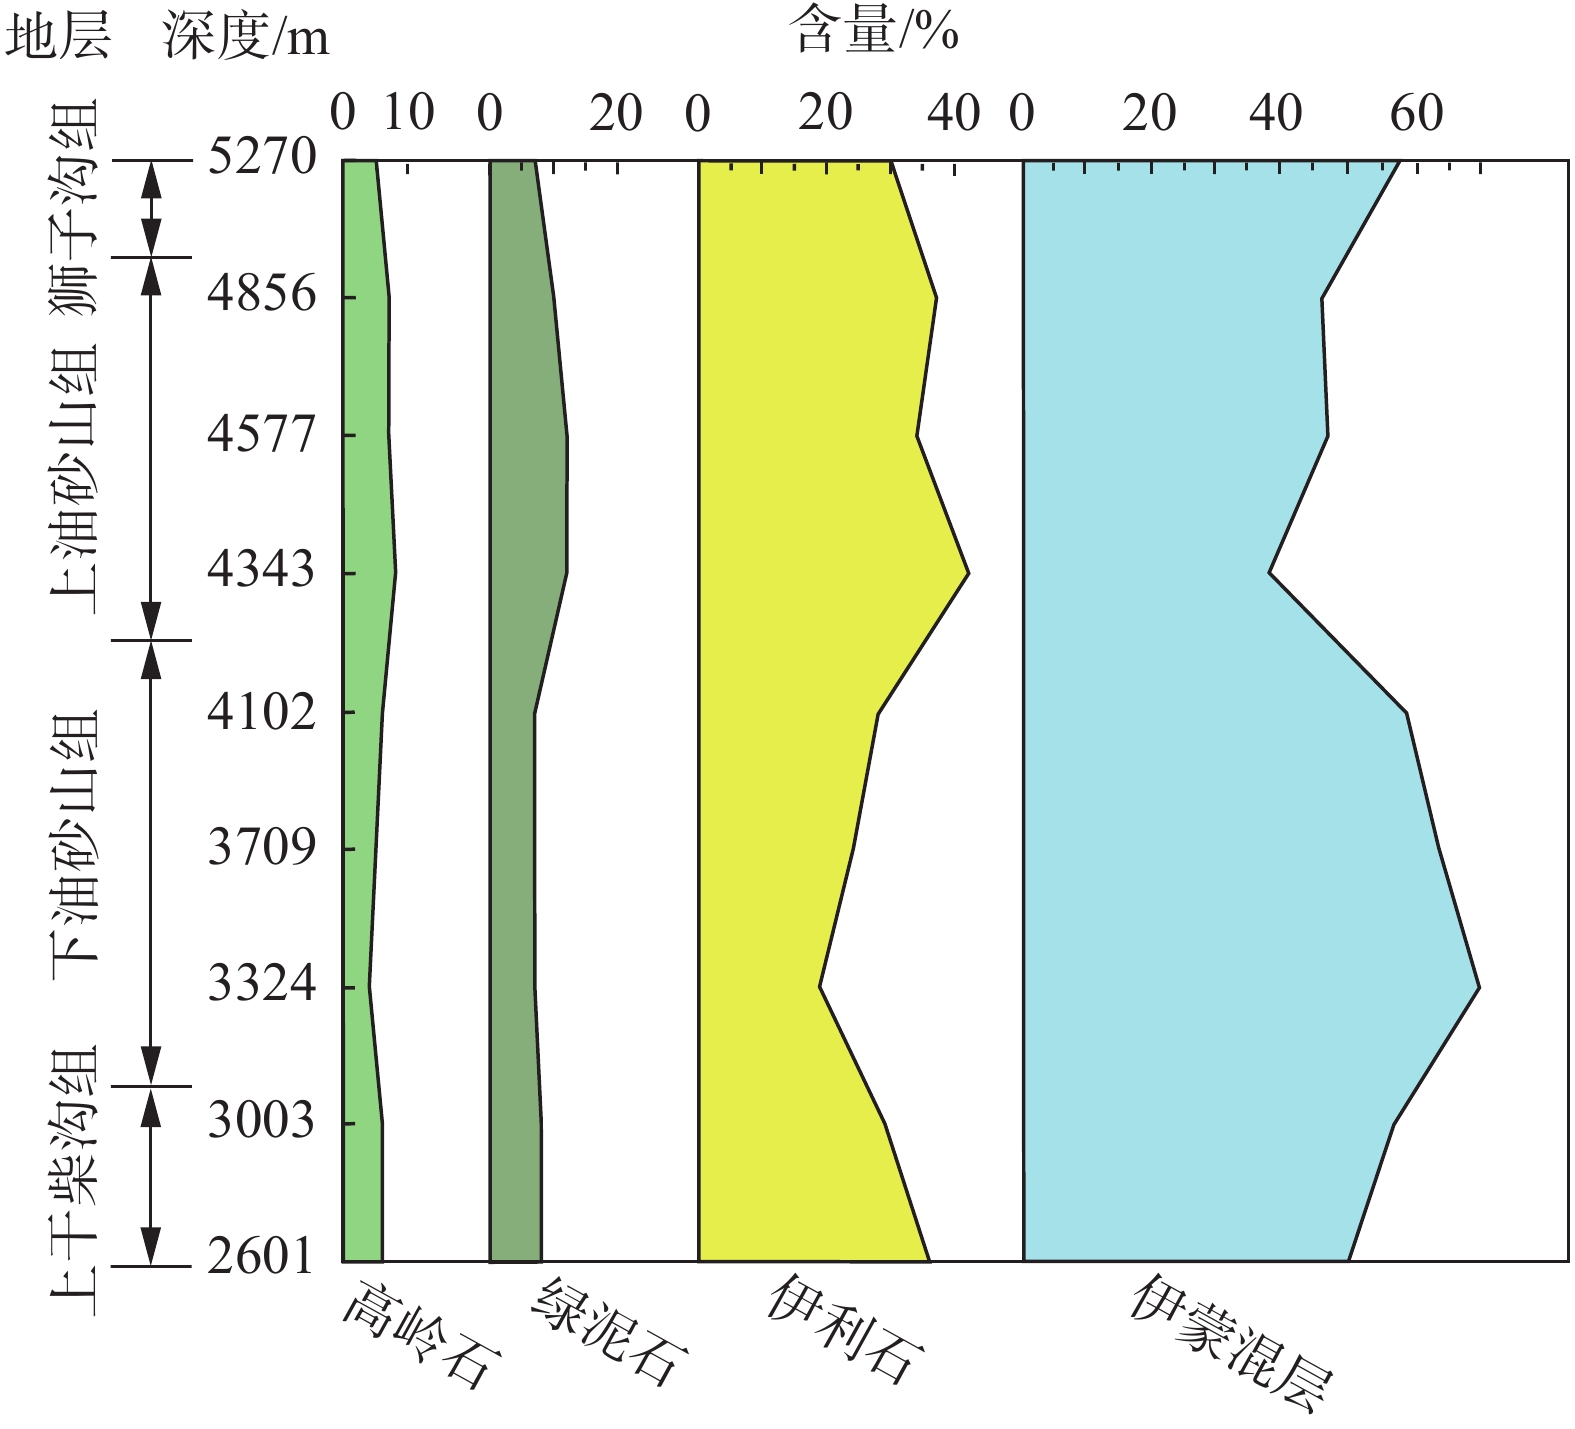
图8是选取的3件样品(DH−19−1、3、5)的XRD谱图,从图中可以看出黏土矿物主要包括伊蒙混层、伊利石、绿泥石以及高岭石。其中伊蒙混层最多(38%~70%,平均值为54.3%);其次是伊利石(19%~42%,平均值为31%);绿泥石(7%~12%,平均值为8.7%)和高岭石(4%~8%,平均值为6%)含量最低(表6,图9)。
表 6 大红沟剖面黏土矿物分析结果Table 6. The results of clay minerals in the Dahonggou section样品号 深度/m 伊蒙混层/% 伊利石/% 高岭石/% 绿泥石/% DH−19−1 2601.40 50 36 6 8 DH−19−3 3002.76 57 29 6 8 DH−19−5 3323.86 70 19 4 7 DH−19−7 3708.76 64 24 5 7 DH−19−9 4102.48 59 28 6 7 DH−19−11 4342.54 38 42 8 12 DH−19−13 4577.02 47 34 7 12 DH−19−15 4856.05 46 37 7 10 DH−19−17 5269.57 58 30 5 7 5. 讨 论
5.1 柴达木盆地北缘新生代地层的沉积再旋回特征
沉积物中的地球化学元素含量变化很大程度上反映了沉积物的来源和环境条件的改变,是获取盆地源区和构造背景的重要线索(Bhatia and Crook, 1986)。已有研究发现,当沉积物再旋回作用时,沉积岩中Eu/Eu*≈0.60~0.70,Rb/Sr值>0.5,Th/Sc值≥1(McLennan et al., 1993)。大红沟剖面中沉积物的Eu/Eu*比值为0.61;Rb/Sr比值为0.53~1.01;Th/Sc比值为1.05~1.39,均满足上述条件,而且与柴达木盆地西部红三旱、油砂山与油泉子地区地层剖面和柴达木盆地北部钻井岩心的地化分析结果类似(Rieser et al., 2005;Sun et al., 2020),表明其经历了明显的沉积物再旋回作用。
大红沟剖面泥岩地层的主量元素大陆上地壳标准化(UCC)图解显示,大部分样品中Na和P含量亏损程度较高;Al、Ti、Fe、Mg和Mn含量相对上地壳较富集;K和Si含量与UCC相似。微量元素含量与大陆上地壳相比,V、Cr、Co、Th、U、Zn和Pb含量较高于上地壳丰度;Rb、Zr和Sc含量接近上地壳丰度;Sr和Ba含量略低于上地壳丰度。主微量元素和稀土元素分别表现出相似的大陆上地壳和球粒陨石标准配分模式,表明大红沟剖面沉积物代表了充分混合的上地壳物质,或经历过重要的沉积物再旋回作用。
碎屑成分分析表明,砂岩的主要成分为石英(Qt)、以及少量的长石(F)和岩屑(L),其中岩屑主要由沉积岩屑组成。干柴沟组、油砂山组以及狮子沟组样品的镜下照片也显示存在沉积岩屑颗粒。Qt−F−L三角图指示研究区物源主要为再旋回造山带。前人在柴达木盆地做了类似的工作,也表明源区主要为再旋回造山带(Jian et al., 2013; Bush et al., 2016)。部分数据与前人的数据有差异,这可能是由于研究区域不同导致的。
本文研究结果表明,上干柴沟组有较高的ZTR值,这可能是因为锆石含量相对较高。下油砂山组、上油砂山组和狮子沟组的ZTR值相对较小,较不稳定重矿物(如角闪石、石榴石和绿帘石等)含量较高。ZTR值从上干柴沟组到下油砂山组突然减小,成分成熟度降低,这表明剖面沉积物在后期主要为搬运距离短的近源堆积。Jian et al. (2013)和Bush et al. (2016)的研究结果与本文ZTR值变化类似,均显示在上干柴沟组之后ZTR开始降低,在10%~20%范围内浮动。
不同类型的母岩会形成不同的重矿物组合,这也为判别沉积区物源、盆地构造活动等提供了依据。重矿物组合主要可划分为以下几种:酸性岩浆岩中富集自形锆石、电气石(粉红色变种)、普通角闪石、磷灰石、榍石等;中性及基性岩浆岩中富集钛铁矿、磁铁矿、白钛石和普通角闪石等;变质岩中富集蓝晶石、石榴石、绿帘石等;沉积岩中富集磨圆较好的锆石、金红石和电气石(朱筱敏,2008)。砂岩样品的重矿物组合和ZTR指数变化图显示上部地层的石榴石和绿帘石含量明显比下干柴沟组多,这表明剖面内变质岩含量增多。本文研究区的重矿物成分和含量与Bush et al. (2016)在大红沟剖面的结果相似,重矿物主要从火成岩矿物转变为低级变质矿物,然后再到高级变质矿物。
黏土矿物的数据分析表明,伊利石含量的平均值为31%,含量较高,反映了干旱和半干旱地区的气候和环境特征。绿泥石往往不稳定,经长期搬运易发生分解(刘云, 1985)。大红沟剖面从上干柴沟组到下油砂山组绿泥石含量总体比较稳定,约为7%;从上油砂山组到狮子沟组绿泥石含量虽然总体依然保持不变,但突然增至10% (图9)。这可能表明后期的物源区距离剖面更近,有较多的绿泥石被保存下来。
综合地球化学和砂岩碎屑成分分析推测,大红沟剖面新生代地层可能经历了明显的沉积物再旋回作用。黏土矿物和重矿物分析结果表明,该剖面的上油砂山组与狮子沟组中主要碎屑成分的搬运距离短,应为近源堆积物。
5.2 沉积物再旋回事件
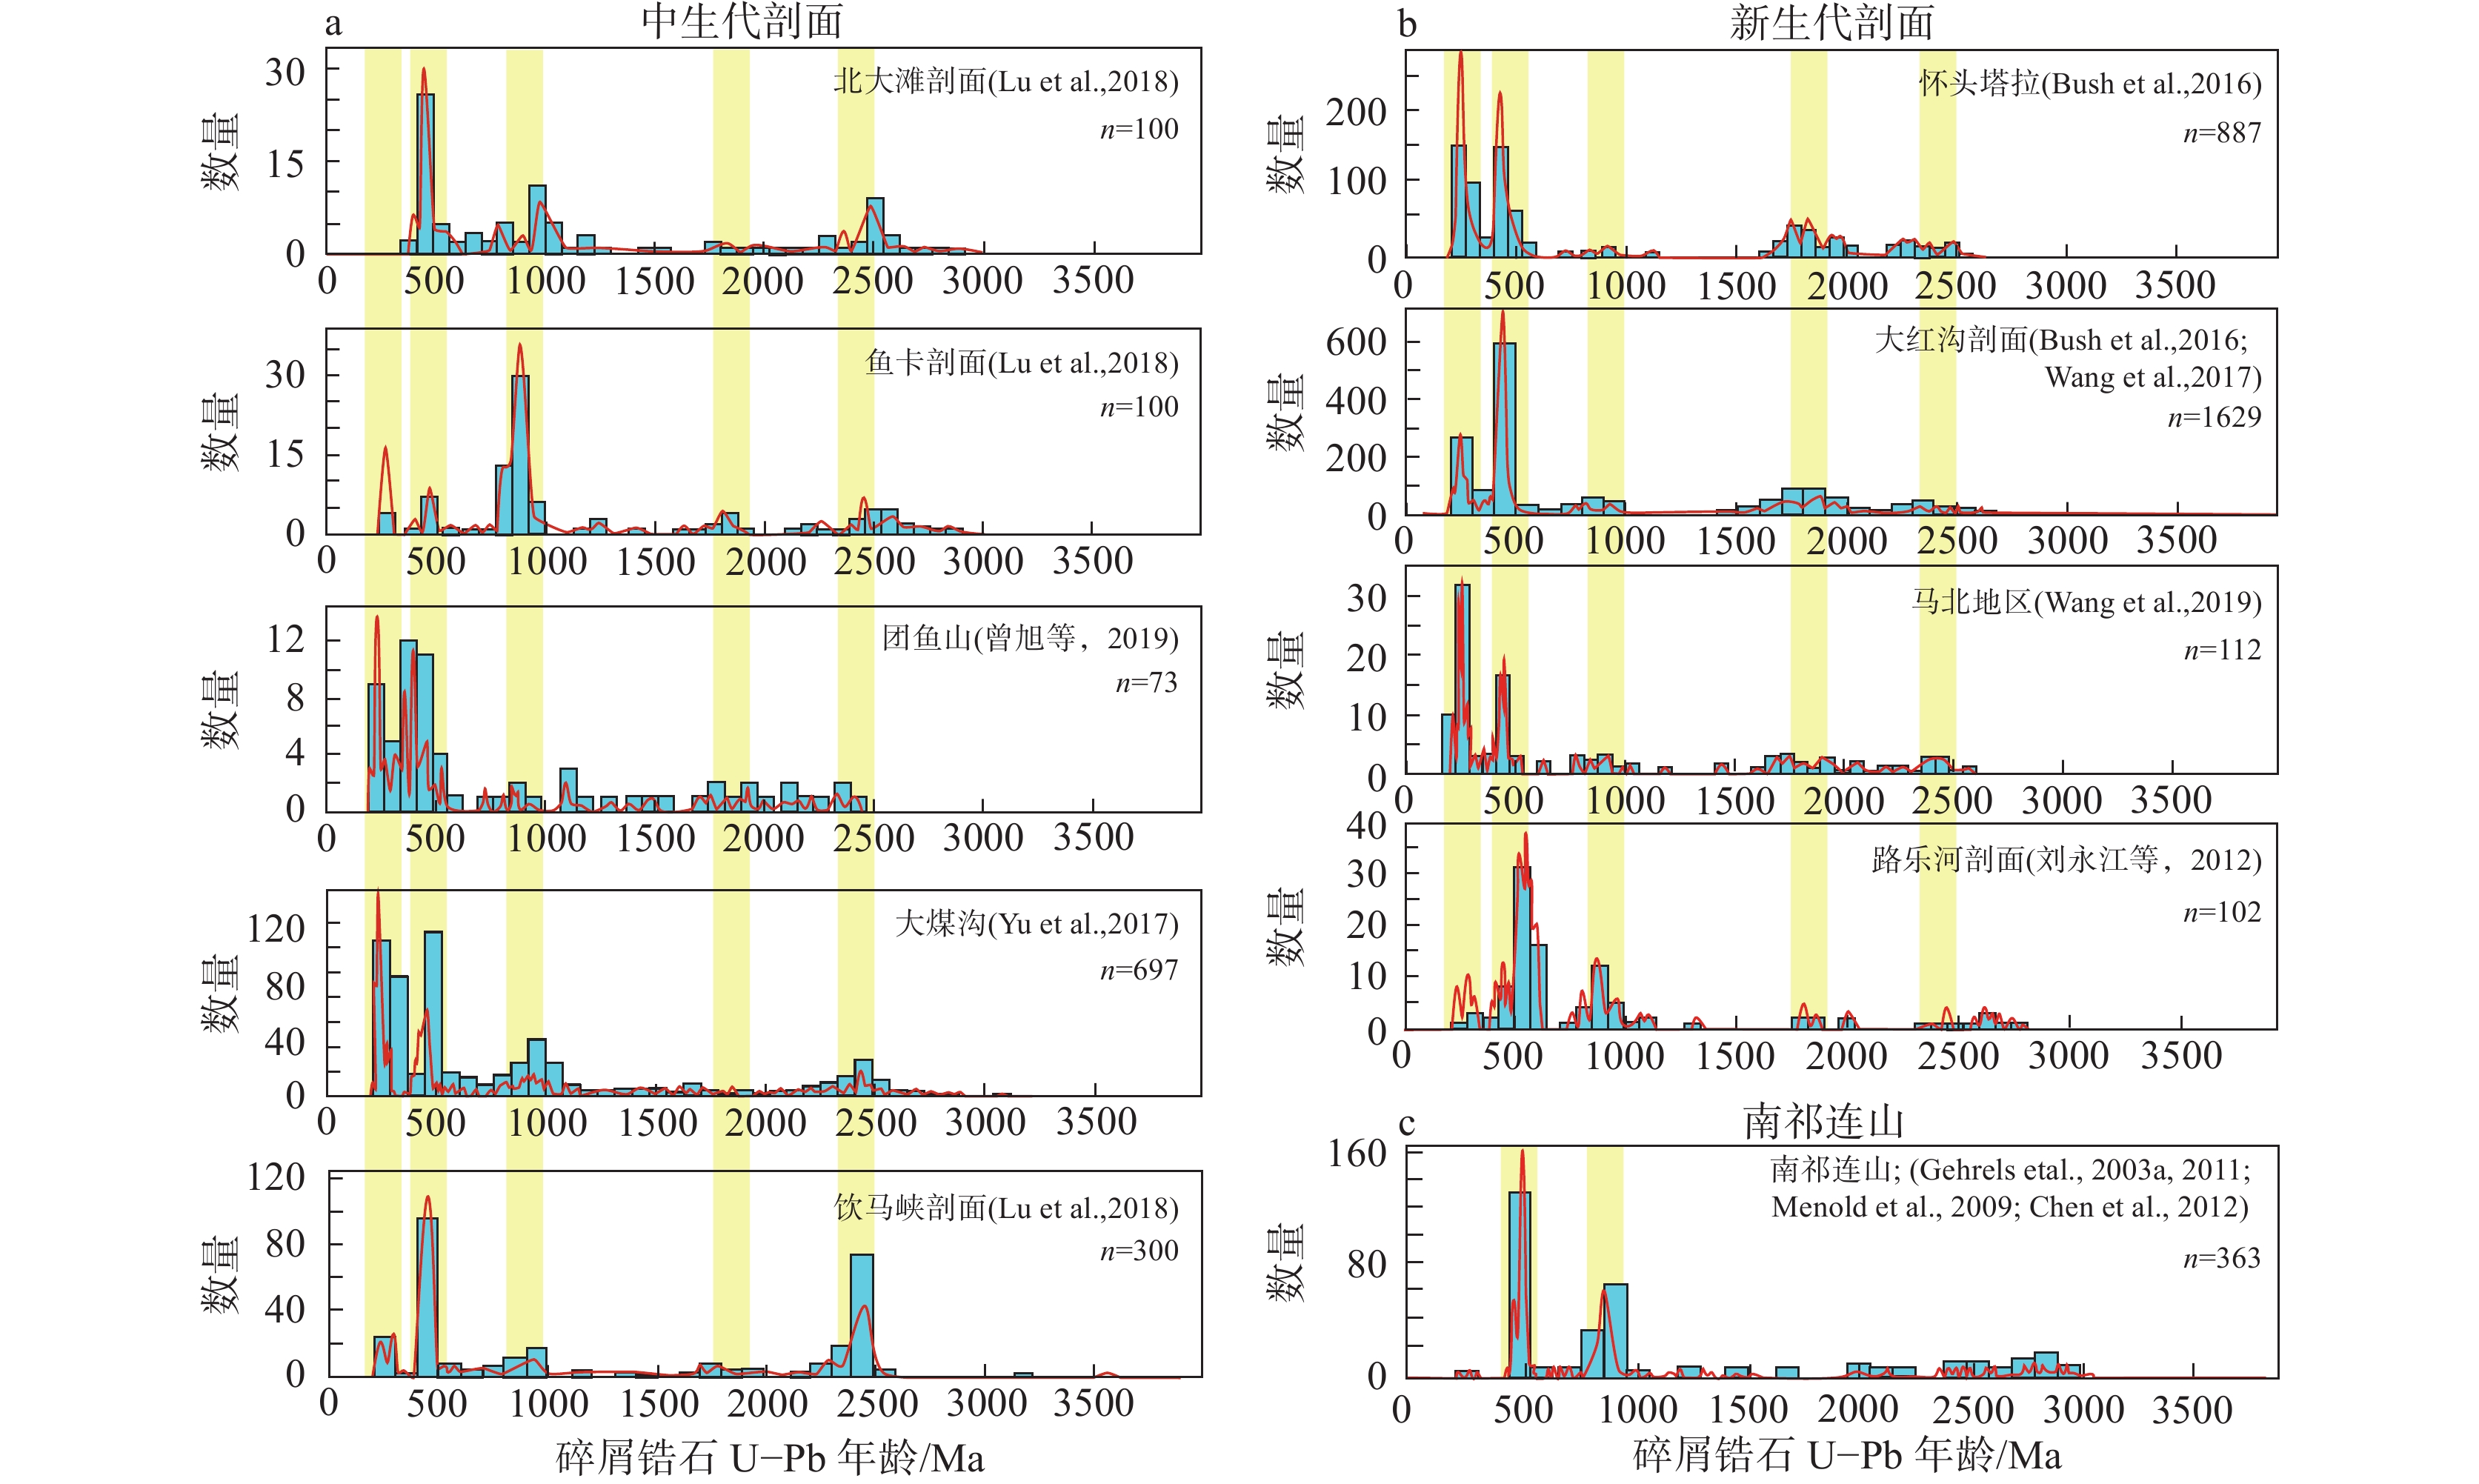
分别选取了邻近柴北缘大红沟剖面的较典型的中生代和新生代地层,其中包括北大滩、团鱼山、鱼卡、饮马峡和大煤沟剖面的中生代地层,以及沉积较厚的马北地区、路乐河、怀头塔拉和大红沟剖面的新生代地层。这些中生代和新生代地层的碎屑锆石U−Pb年龄对比结果(图10)显示,中生代地层的锆石年龄峰值主要集中在3个区间(300~200 Ma,500~380 Ma和1000~800 Ma),以及两个次要的区间(1.9~1.7 Ga和2.5~2.3 Ga)(图10a);而新生代地层锆石年龄也同样呈现了这3个主要的区间和两个次要的区间(图10b)。两者的碎屑锆石年龄分布非常相似,考虑到南祁连山只含有少量的300~200 Ma锆石年龄(图10c),因此,中生代沉积地层很有可能是新生代沉积物的重要源区之一。野外观察表明,柴北缘路乐河组主要由粗颗粒的砾岩与粗砂岩组成;显微镜下观察也表明路乐河组砂岩中存在许多沉积岩屑颗粒,颗粒的分选和磨圆度较差。因此,柴北缘路乐河组可能代表了近源快速堆积。目前,柴北缘逆冲褶皱带内不连续分布有大量的中生代地层,而在新生代,可能有更多的中生代地层曾经被逆冲褶皱作用抬升至地表,接受风化、剥蚀与搬运作用,从而形成新生代地层的重要源区。
![]() 图 10 中生代剖面(a; Yu et al., 2017; Lu et al., 2019; 曾旭等,2019)、新生代剖面(b; 刘永江等,2012; Bush et al., 2016; Wang et al., 2017; 王晔桐等,2019),以及南祁连山(c; Gehrels et al., 2003, 2011; Menold et al., 2009; Chen et al., 2012)的碎屑锆石U−Pb年龄谱对比黄色阴影条表示碎屑锆石U−Pb年龄分布的主要峰值;图a、b的峰值年龄依次为300~200 Ma,500~380 Ma,1000~800 Ma,1.9~1.7 Ga和2.5~2.3 GaFigure 10. Comparison of U−Pb age spectra of detrital zircon in the Mesozoic sections (a; Yu et al., 2017; Lu et al., 2019; Zeng Xu et al., 2019), the Cenozoic sections (b; Liu Yongjiang et al., 2012; Bush et al., 2016; Wang et al., 2017; Wang Yetong et al., 2019) and the southern Qilian Shan (c; Gehrels et al., 2003, 2011; Menold et al., 2009; Chen et al., 2012)The yellow shaded bars represent the major peak of U−Pb age distribution of detrital zircons; (a−b) The major populations are 300−200 Ma, 500−380 Ma, 1000−800 Ma, 1.9−1.7 Ga and 2.5−2.3 Ga
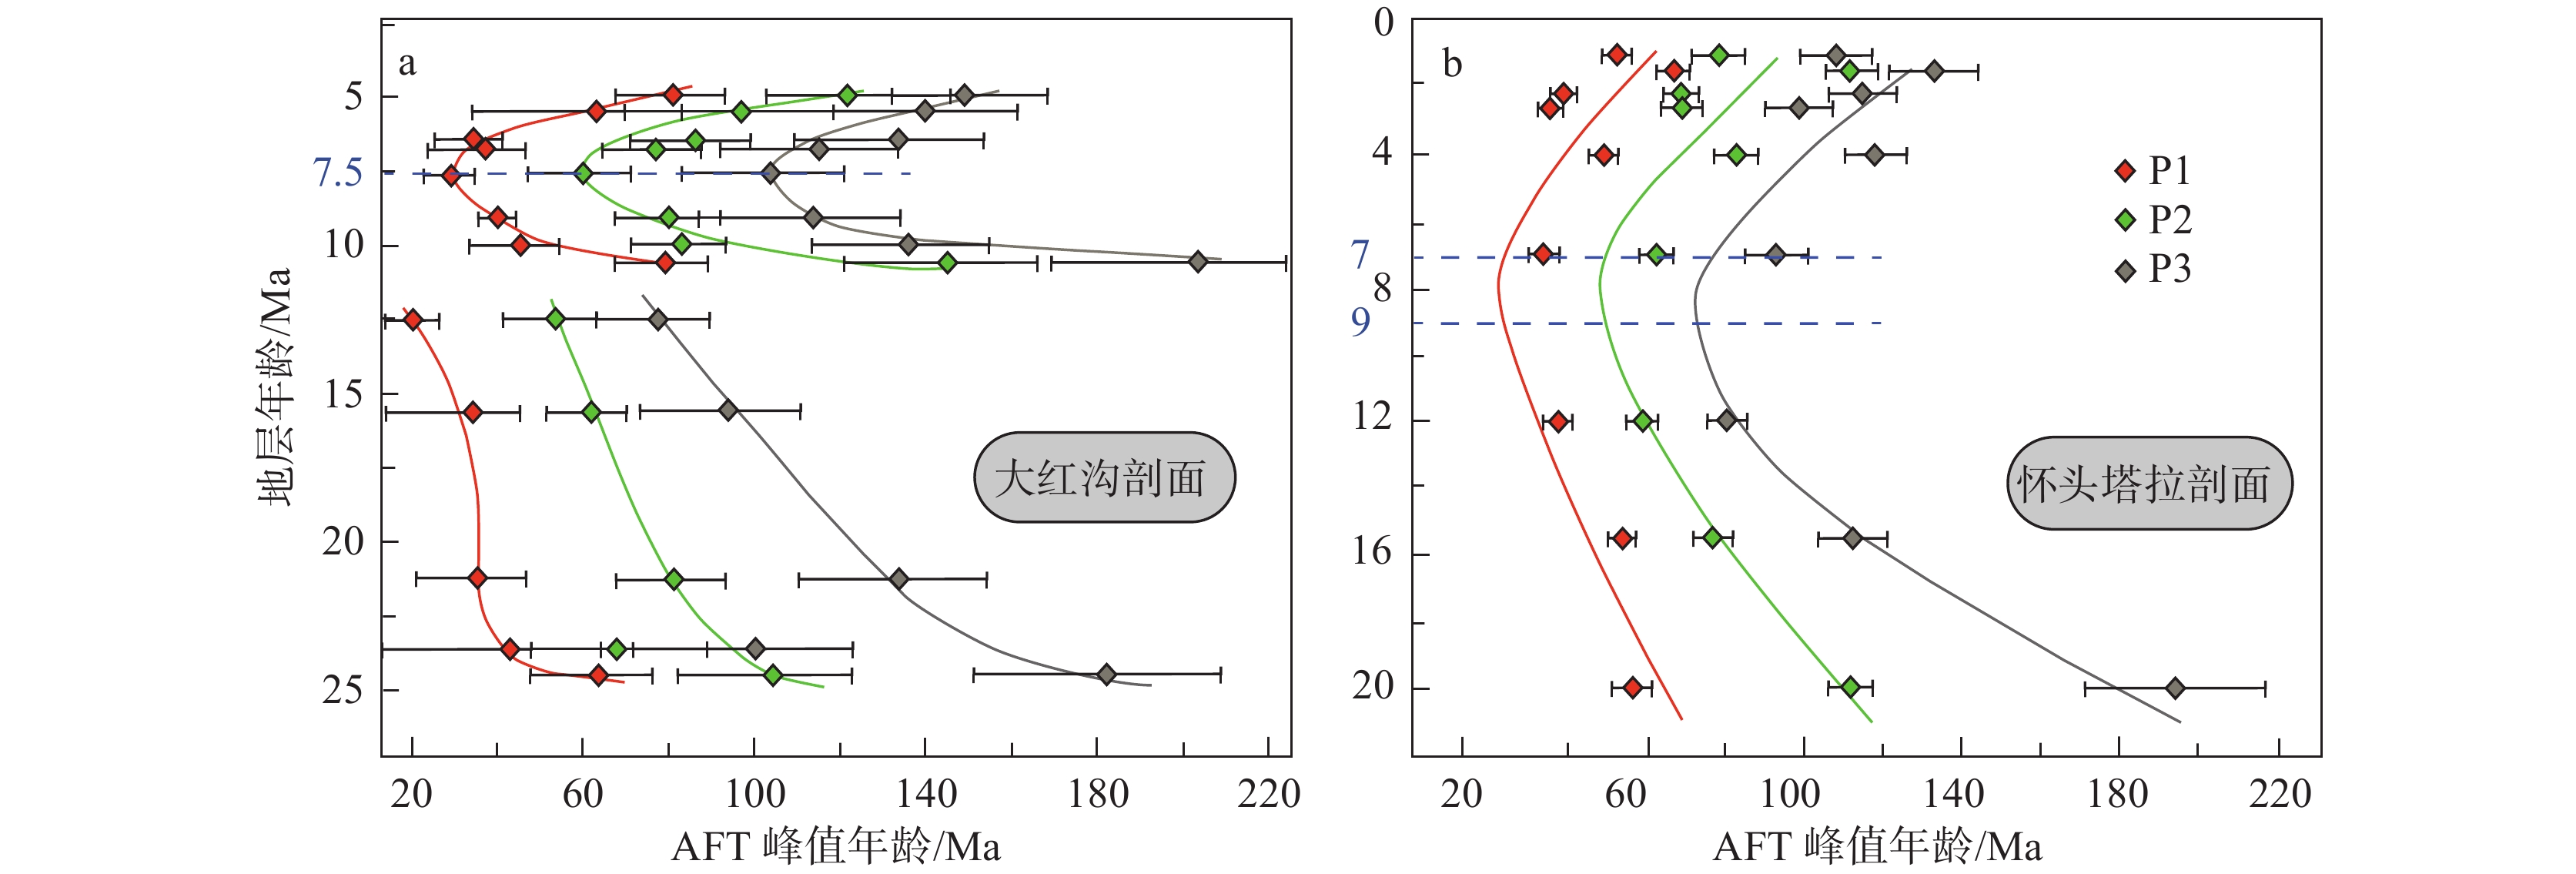
图 10 中生代剖面(a; Yu et al., 2017; Lu et al., 2019; 曾旭等,2019)、新生代剖面(b; 刘永江等,2012; Bush et al., 2016; Wang et al., 2017; 王晔桐等,2019),以及南祁连山(c; Gehrels et al., 2003, 2011; Menold et al., 2009; Chen et al., 2012)的碎屑锆石U−Pb年龄谱对比黄色阴影条表示碎屑锆石U−Pb年龄分布的主要峰值;图a、b的峰值年龄依次为300~200 Ma,500~380 Ma,1000~800 Ma,1.9~1.7 Ga和2.5~2.3 GaFigure 10. Comparison of U−Pb age spectra of detrital zircon in the Mesozoic sections (a; Yu et al., 2017; Lu et al., 2019; Zeng Xu et al., 2019), the Cenozoic sections (b; Liu Yongjiang et al., 2012; Bush et al., 2016; Wang et al., 2017; Wang Yetong et al., 2019) and the southern Qilian Shan (c; Gehrels et al., 2003, 2011; Menold et al., 2009; Chen et al., 2012)The yellow shaded bars represent the major peak of U−Pb age distribution of detrital zircons; (a−b) The major populations are 300−200 Ma, 500−380 Ma, 1000−800 Ma, 1.9−1.7 Ga and 2.5−2.3 Ga近来,柴达木盆地新生代地层的碎屑磷灰石裂变径迹分析获得了重要的进展。Wang et al. (2017)研究表明,最年轻的(P1)、中等的(P2)和最老的(P3)碎屑颗粒显示,峰值年龄从79.1 Ma、145.2 Ma和203.7 Ma(地层年龄约10.6 Ma)急剧减少至~25 Ma、~55 Ma和~100 Ma(地层年龄约7.5 Ma);随后,峰值年龄逐渐增长至~80 Ma、~120 Ma和~145 Ma(地层年龄约5 Ma),最低峰值年龄出现在约7.5 Ma (图11a)。Pang et al. (2019)也获得了一个类似的趋势:P1、P2和P3的峰值年龄分别从剖面底部的(55.8±5.6)、(111.2±6.9)和(193.8±23) Ma逐渐减小至9~7 Ma时的(33.0±3.1)、(60.5±4.8)和(91.8±8.4) Ma;在9~7 Ma之后,峰值年龄又分别增加至(51.3±3.8)、(77. 5±7.0)和(108.7±10.2) Ma (图11b)。大红沟与怀头塔拉剖面的碎屑磷灰石裂变径迹年龄均表现出明显的镜像分布模式,表明柴达木盆地在9~7 Ma经历了显著的构造变形,逆冲褶皱作用向盆地内部扩展,导致盆地被破坏改造,新生代地层曾经被大量地抬升至地表。
![]() P1、P2和P3分别代表了最年轻的、中等的和最老的碎屑颗粒峰值年龄;具体剖面位置见图2Figure 11. Peak ages of detrital apatite fission track (AFT) in the Dahonggou section (a, Wang et al., 2017) and the Huaitoutala section (b, Pang et al., 2019)P1, P2 and P3 represent the youngest, the middle and the oldest population peak ages, respectively. See Fig. 2 for section sites
P1、P2和P3分别代表了最年轻的、中等的和最老的碎屑颗粒峰值年龄;具体剖面位置见图2Figure 11. Peak ages of detrital apatite fission track (AFT) in the Dahonggou section (a, Wang et al., 2017) and the Huaitoutala section (b, Pang et al., 2019)P1, P2 and P3 represent the youngest, the middle and the oldest population peak ages, respectively. See Fig. 2 for section sitesHeermance et al. (2013)在冷湖镇附近对一个约1750 m厚的地层剖面进行了磁性地层学、以及碳和氧同位素等分析(采样位置见图2)。结果表明约3 Ma,柴达木盆地西部开始发育生长地层。而且,此时盆地的沉积速率也达到最大(Métivier et al., 1998)。其他研究也表明柴达木盆地北缘第四纪发生了大规模左旋斜冲推覆构造运动,导致第四系与下覆的中新世河湖相沉积之间存在明显的角度不整合接触关系(吴珍汉等,2009)。此次构造事件一方面导致大量细颗粒的河湖相沉积物被抬升出露于地表,从而可能成为第四纪中国黄土的重要源区(Kapp et al., 2011; Pullen et al., 2011);另一方面,~3 Ma盆地内的隆起区物质再次经历沉积物再旋回作用,可能成为柴达木盆地第四纪湖泊的重要源区。如图2a、b所示,位于柴北缘的大红沟剖面可能在~3 Ma经历了显著的构造抬升作用,形成了重要的隆起区,从而为南侧的海拔更低的达布逊湖和察尔汗盐湖提供了大量的碎屑物质。
综上所述,新生代柴达木盆地可能经历了多次沉积物再旋回作用,位于柴北缘逆冲褶皱带内的侏罗系和白垩系,以及早期的新生代地层都是盆地现今地层的重要物质来源。
6. 结 论
本文通过地球化学、砂岩碎屑颗粒统计、重矿物以及黏土矿物等分析,对新生代柴北缘沉积物再旋回作用进行研究后可得出以下主要结论:
(1) 柴达木盆地北缘大红沟新生代地层中泥岩的Eu/Eu*平均值为0.61,Rb/Sr >0.5,且Th/Sc >1.0,而且主微量元素与稀土元素分别表现出相似的大陆上地壳和球粒陨石标准配分模式。因此,该地区沉积物代表了充分混合的上地壳物质,应发生过明显的沉积物再旋回作用。
(2) 柴达木盆地北缘大红沟新生代地层中砂岩的主要成分为石英(Qt)、以及少量的长石(F)和岩屑(L),其中岩屑主要为沉积岩屑。Qt−F−L三角图指示地层的沉积物源主要为再旋回造山带。砂岩中重矿物以钛铁矿、褐铁矿、绿帘石和石榴石等为主。下油砂山组、上油砂山组和狮子沟组的稳定重矿物含量和ZTR值比上干柴沟组明显降低,这可能表明后期沉积物未经历远距离搬运,主要是近源堆积。
(3) 大红沟新生代地层中的黏土矿物主要包括伊蒙混层、伊利石、以及少量的绿泥石、高岭石。下干柴沟组、下油砂山组的绿泥石含量为~7%;上油砂山组、狮子沟组的绿泥石含量突然增加至~10%,这表明后期的物源区距离剖面更近,有更多的绿泥石被保存下来。
综合碎屑锆石U−Pb年龄、磷灰石裂变径迹测年等分析结果推测,柴达木北缘的中生代沉积岩可能发生过沉积物再旋回作用,并构成了盆地新生代地层的重要源区之一。柴北缘的新生代沉积岩在9~7 Ma也经历了显著的再旋回作用;而在~3 Ma以后,盆地北部的隆起区物质再次经历沉积物再旋回作用,可能成为柴达木盆地第四纪湖泊,以及中国黄土高原黄土的重要源区。
致谢: 感谢评审专家和编辑提出的建设性意见。感谢澳实分析检测(广州)有限公司、中国地质科学院探矿工艺研究所以及廊坊市拓轩岩矿检测服务有限公司在测试分析中提供的帮助。
-
图 1 盆地沉积物再旋回作用模式图(据Garver et al., 1999修改)
tc—通过封闭温度的时间;td—沉积时间;te—到达地表的时间;通常假设td=te;A和Z分别指磷灰石和锆石;t1—t4为碎屑磷灰石或锆石记录的冷却年龄
Figure 1. Schematic sediment recycling model within basin (modified from Garver et al.,1999)
tc—The time through the closure temperature; td—Deposition time; te—The time arrived at the surface; It is generally assumed that td=te; A and Z refer to the apatite and zircon, respectively; t1−t4 is the cooling age recorded by the detrital apatite or zircon
图 2 研究区和采样位置图
a—柴达木盆地及其周围地区数字高程模型图;b—柴北缘廊带剖面(A−A′)的高程图,其中蓝线代表10条高程剖面的平均值,上、下黑线分别是高程最大值与最小值;c—大红沟剖面及其周缘地区地质图及采样剖面
Figure 2. Location maps of the study area and sampling sites
a−Digital elevation model (DEM) of the Qaidam Basin and its surrounding areas; b−Elevation map of the corridor section (A−A') in the northern Qaidam Basin margin. The blue line represents the average of the 10 elevation profiles, and the upper and lower black lines are the maximum and minimum elevation, respectively; c−Geologic map and sampling sites of the Dahonggou section and its surrounding areas
图 4 泥岩的主微量元素UCC (Taylor and McLennan, 1985)标准化图解(a, b)与稀土元素球粒陨石(Palme, 1988)标准化图解(c)
Figure 4. UCC−normalized distributions (Taylor and McLennan, 1985) of major elements and trace elements (a, b) and Chondrite−normalized distributions (Palme, 1988) of rare earth elements of mudstones (c)
图 6 柴北缘砂岩碎屑颗粒的石英−长石−岩屑三角图
构造源区划分来自Dickinson (1985)
Figure 6. Q−F−L ternary diagrams of framework grains of sandstones in the northern Qaidam Basin margin
The division of tectonic source areas comes from Dickinson (1985)
图 10 中生代剖面(a; Yu et al., 2017; Lu et al., 2019; 曾旭等,2019)、新生代剖面(b; 刘永江等,2012; Bush et al., 2016; Wang et al., 2017; 王晔桐等,2019),以及南祁连山(c; Gehrels et al., 2003, 2011; Menold et al., 2009; Chen et al., 2012)的碎屑锆石U−Pb年龄谱对比
黄色阴影条表示碎屑锆石U−Pb年龄分布的主要峰值;图a、b的峰值年龄依次为300~200 Ma,500~380 Ma,1000~800 Ma,1.9~1.7 Ga和2.5~2.3 Ga
Figure 10. Comparison of U−Pb age spectra of detrital zircon in the Mesozoic sections (a; Yu et al., 2017; Lu et al., 2019; Zeng Xu et al., 2019), the Cenozoic sections (b; Liu Yongjiang et al., 2012; Bush et al., 2016; Wang et al., 2017; Wang Yetong et al., 2019) and the southern Qilian Shan (c; Gehrels et al., 2003, 2011; Menold et al., 2009; Chen et al., 2012)
The yellow shaded bars represent the major peak of U−Pb age distribution of detrital zircons; (a−b) The major populations are 300−200 Ma, 500−380 Ma, 1000−800 Ma, 1.9−1.7 Ga and 2.5−2.3 Ga
图 11 大红沟剖面(a; Wang et al., 2017)和怀头塔拉剖面(b; Pang et al., 2019)碎屑磷灰石裂变径迹(AFT)峰值年龄图
P1、P2和P3分别代表了最年轻的、中等的和最老的碎屑颗粒峰值年龄;具体剖面位置见图2
Figure 11. Peak ages of detrital apatite fission track (AFT) in the Dahonggou section (a, Wang et al., 2017) and the Huaitoutala section (b, Pang et al., 2019)
P1, P2 and P3 represent the youngest, the middle and the oldest population peak ages, respectively. See Fig. 2 for section sites
表 1 大红沟剖面泥岩样品的主量元素含量(%)
Table 1 Major element contents (%) of mudstone samples in the Dahonggou section
样品号 深度/m SiO2 TiO2 Al2O3 Fe2O3 MnO MgO CaO Na2O K2O P2O5 DH−19−1 2601.4 53.1 0.7 17.4 7.5 0.06 2.8 4.9 1.4 3.5 0.15 DH−19−3 3002.8 57.1 0.7 15.9 6.1 0.06 3.1 3.7 2.0 3.4 0.13 DH−19−5 3323.9 64.4 0.7 13.1 5.0 0.06 2.3 3.4 2.2 2.6 0.13 DH−19−7 3708.8 50.6 0.6 13.1 5.5 0.13 2.9 10.0 1.9 2.8 0.16 DH−19−9 4102.5 51.7 0.8 17.0 6.3 0.07 3.3 6.2 1.5 3.4 0.13 DH−19−11 4342.5 61.3 0.6 11.4 4.3 0.09 1.9 7.2 2.1 2.2 0.14 DH−19−13 4577.0 59.9 0.7 14.4 6.4 0.07 2.9 3.8 2.1 3.0 0.14 DH−19−15 4856.0 61.7 0.6 15.1 5.9 0.08 2.5 2.7 1.7 3.0 0.14 DH−19−17 5269.6 52.6 0.7 16.1 6.7 0.11 3.1 5.9 2.0 3.2 0.14 UCC 65.9 0.5 15.2 4.5 0.07 2.2 4.2 3.9 3.4 0.20 注:UCC数据来自Taylor and McLennan (1985)。 表 2 大红沟剖面泥岩样品的微量元素含量与比值
Table 2 Trace element contents and ratio of mudstone samples in the Dahonggou section
样品号 深度/m 元素含量/10−6 比值 V Cr Co Zn Rb Sr Ba Th U Zr Sc Rb/Sr Th/Sc DH−19−1 2601.4 127 89 17.3 109 153.0 151.5 445 16.8 2.8 159 16.0 1.01 1.05 DH−19−3 3002.8 118 87 18.0 100 160.5 188.0 505 19.0 5.9 193 14.6 0.85 1.30 DH−19−5 3323.9 95 75 13.1 75 122.0 168.0 431 15.5 3.6 280 11.1 0.73 1.39 DH−19−7 3708.8 98 72 14.3 82 126.5 262.0 1090 14.6 3.2 162 11.6 0.48 1.25 DH−19−9 4102.5 130 95 20.9 110 154.0 209.0 461 18.2 4.5 163 15.9 0.74 1.14 DH−19−11 4342.5 80 61 11.0 61 98.4 184.5 477 11.3 2.9 209 9.0 0.53 1.26 DH−19−13 4577.0 111 85 16.6 89 130.5 171.0 472 14.2 3.3 165 12.9 0.76 1.10 DH−19−15 4856.1 110 81 17.0 88 136.5 153.0 457 14.3 3.7 173 13.0 0.89 1.10 DH−19−17 5269.6 132 83 17.6 97 141.0 166.5 487 15.1 3.8 137 13.7 0.85 1.10 UCC 60 35 10.0 71 112.0 350.0 550 10.7 2.8 190 11.0 注:UCC数据来自Taylor and McLennan (1985)。 表 3 大红沟剖面泥岩样品的稀土元素含量与比值
Table 3 Rare earth element contents and ratio of mudstone samples in the Dahonggou section
样品号 深度/m 元素含量/10−6 比值 La Ce Pr Nd Sm Eu Tb Gd Dy Ho Er Tm Lu Yb Eu/Eu* DH−19−1 2601.4 41.1 85.0 9.4 33.7 6.6 1.3 0.9 6.1 5.4 1.1 2.9 0.5 0.5 2.8 0.62 DH−19−3 3002.8 46.2 93.1 10.6 37.2 7.3 1.4 1.0 6.4 5.7 1.2 3.4 0.5 0.5 3.1 0.62 DH−19−5 3323.9 41.6 87.0 9.6 35.4 7.0 1.3 1.0 6.6 5.9 1.2 3.4 0.5 0.5 3.4 0.59 DH−19−7 3708.8 40.7 80.0 8.7 31.2 6.0 1.2 0.8 5.7 5.0 1.0 2.9 0.5 0.4 2.7 0.59 DH−19−9 4102.5 45.5 91.5 9.8 37.0 6.8 1.4 1.0 6.4 5.2 1.1 3.0 0.5 0.5 2.9 0.64 DH−19−11 4342.5 33.9 67.1 7.6 28.1 5.3 1.1 0.8 5.1 4.5 0.9 2.7 0.4 0.4 2.5 0.62 DH−19−13 4577.0 33.8 69.0 7.9 28.9 5.6 1.1 0.8 5.3 4.5 0.9 2.7 0.4 0.4 2.5 0.62 DH−19−15 4856.1 36.0 78.6 8.4 30.3 5.9 1.2 0.8 5.7 4.6 1.0 2.7 0.4 0.4 2.5 0.61 DH−19−17 5269.6 36.1 76.4 8.1 29.6 5.7 1.1 0.8 5.4 4.7 0.9 2.7 0.4 0.4 2.4 0.61 注:Eu/Eu*=Eu(N) /0.5(Sm(N)+Gd(N)),N表示球粒陨石标准化,数据来自Palme (1988)。 表 4 大红沟剖面8件砂岩的碎屑颗粒组成
Table 4 Detrital framework grain composition of 8 sandstones in the Dahonggou section
样品号 深度/m 石英(Qt) 长石(F) 岩屑(L) Qt/% F/% L/% DH−19−4 3002.8 257 27 59 74.9 7.9 17.2 DH−19−6 3323.9 258 10 32 86.0 3.3 10.7 DH−19−8 3708.8 247 18 35 82.3 6.0 11.7 DH−19−10 4102.5 225 25 50 75.0 8.3 16.7 DH−19−12 4342.5 223 21 56 74.3 7.0 18.7 DH−19−14 4577.0 249 13 38 83.0 4.3 12.7 DH−19−16 4856.1 241 20 39 80.3 6.7 13.0 DH−19−18 5269.6 250 16 41 81.4 5.2 13.4 表 5 大红沟剖面砂岩重矿物含量(%)
Table 5 Heavy mineral contents (%) of sandstones in the Dahonggou section
样品号 深度/m 锆石 磷灰石 金红石 锐钛矿 榍石 白钛石 蓝晶石 绿帘石 电气石 石榴石 辉石 钛铁矿 褐铁矿 磁铁矿 角闪石 DH−19−2 2601.40 13.20 6.02 1.50 1.50 0.50 11.28 N 4.17 0.13 6.38 N 23.70 21.48 10.13 N DH−19−4 3002.76 8.79 2.66 1.40 0.22 0.44 13.01 N 2.66 N 9.15 N 39.08 18.79 3.78 N DH−19−6 3323.86 5.97 5.22 0.75 0.05 2.39 5.04 0.33 23.88 0.25 14.28 0.25 17.48 23.88 N 0.25 DH−19−8 3708.76 8.62 4.31 2.21 0.53 7.82 8.94 2.31 18.31 0.42 14.93 0.56 12.39 16.06 1.49 0.99 DH−19−10 4102.48 5.54 4.28 1.68 0.63 2.24 7.92 0.14 22.04 0.73 21.30 1.71 3.91 7.59 1.42 18.85 DH−19−12 4342.54 5.23 1.42 3.27 N 7.19 7.29 6.86 16.93 0.40 17.13 1.21 12.90 14.71 0.94 4.43 DH−19−14 4577.02 2.49 2.85 1.97 0.15 4.31 7.53 8.33 12.60 0.64 19.44 0.21 16.24 21.36 0.53 1.28 DH−19−16 4856.05 7.65 1.26 1.98 0.63 4.32 11.34 1.08 10.82 1.30 14.42 0.15 20.33 19.47 5.10 0.10 DH−19−18 5269.57 2.32 0.77 2.17 N 1.55 4.18 10.68 18.05 1.09 22.80 1.36 10.72 13.43 4.65 5.16 注:表格中N指该处没有数据。 表 6 大红沟剖面黏土矿物分析结果
Table 6 The results of clay minerals in the Dahonggou section
样品号 深度/m 伊蒙混层/% 伊利石/% 高岭石/% 绿泥石/% DH−19−1 2601.40 50 36 6 8 DH−19−3 3002.76 57 29 6 8 DH−19−5 3323.86 70 19 4 7 DH−19−7 3708.76 64 24 5 7 DH−19−9 4102.48 59 28 6 7 DH−19−11 4342.54 38 42 8 12 DH−19−13 4577.02 47 34 7 12 DH−19−15 4856.05 46 37 7 10 DH−19−17 5269.57 58 30 5 7 -
[1] BGMBQP (Bureau of Geology and Mineral Bureau of the Qinghai Province). 1991. Regional Geology of Qinghai Province[M]. Beijing: Geological Publishing House (in Chinese with English abstract).
[2] Bhatia M R, Crook K A W. 1986. Trace element characteristics of graywackes and tectonic setting discrimination of sedimentary basins[J]. Contributions to Mineralogy & Petrology, 92(2): 181−193.
[3] Bush M, Saylor J, Horton B, Nie J. 2016. Growth of the Qaidam Basin during Cenozoic exhumation in the northern Tibetan Plateau: Inferences from depositional patterns and multiproxy detrital provenance signatures[J]. Lithosphere, 8: 58−82. doi: 10.1130/L449.1
[4] Chen N S, Zhang L, Sun M, Wang Q Y, Kusky T M. 2012. U−Pb and Hf isotopic compositions of detrital zircons from the paragneisses of the Quanji Massif, NW China: Implications for its early tectonic evolutionary history[J]. Journal of Asian Earth Sciences, 54/55: 110−130. doi: 10.1016/j.jseaes.2012.04.006
[5] Colombo F. 1994. Normal and reverse unroofing sequences in syntectonic conglomerates as evidence of progressive basinward deformation[J]. Geology, 22(3): 235−238. doi: 10.1130/0091-7613(1994)022<0235:NARUSI>2.3.CO;2
[6] Dickinson W R. 1985. Interpreting provenance relations from detrital modes of sandstones, in Zuffa G G, ed. , Provenance of Arenites: New York, D. Reidel Publishing, North Atlantic Treaty Organization (NATO) Advanced Study Institute (ASI) Series C[J]. Mathematical and Physical Sciences, 148: 333−361.
[7] Fang X M, Zhang W L, Meng Q Y, Gao J P, Wang X M, King J, Song C H, Dai S, Miao Y F. 2007. High−resolution magnetostratigraphy of the Neogene Huaitoutala section in the eastern Qaidam Basin on the NE Tibetan Plateau, Qinghai Province, China, and its implication on tectonic uplift of the NE Tibetan Plateau[J]. Earth and Planetary Science Letters, 258(1/2): 293−306. doi: 10.1016/j.jpgl.2007.03.042
[8] Fosdick J C, Grove M, Graham S A, Hourigan J K, Lovera O, Romans B W. 2014. Detrital thermochronologic record of burial heating and sediment recycling in the Magallanes foreland basin, Patagonian Andes[J]. Basin Research, 27(4): 546−572.
[9] Garver J I, Brandon M T, Roden-Tice M, Kamp P J J. 1999. Exhumation history of orogenic highlands determined by detrital fission-track thermochronology[J]. Geological Society, London, Special Publications, 154: 283−304.
[10] Gehrels G E, Yin A, Wang X. 2003. Detrital−zircon geochronology of the northeastern Tibetan Plateau[J]. Geological Society of America Bulletin, 115: 881−896. doi: 10.1130/0016-7606(2003)115<0881:DGOTNT>2.0.CO;2
[11] Gehrels G, Kapp P, DeCelles P, Pullen A, Blakey R, Weislogel A, Ding L, Guynn J, Martin A, McQuarrie N, Yin A. 2011. Detrital zircon geochronology of pre−Tertiary strata in the Tibetan−Himalayan orogen[J]. Tectonics, 30(5): TC5016.1−TC5016.27.
[12] Heermance R V, Pullen A, Kapp P, Garzione C N, Bogue S, Ding L, Song P P. 2013. Climatic and tectonic controls on sedimentation and erosion during the Pliocene−Quaternary in the Qaidam Basin (China)[J]. Geological Society of America Bulletin, 125(5/6): 833−856. doi: 10.1130/B30748.1
[13] Hubert J F. 1962. A zircon−tourmaline−rutile maturity index and the interdependence of the composition of heavy mineral assemblages with the gross composition and texture of sandstones[J]. Journal of Sedimentary Research, 32(3): 440−450.
[14] Ingersoll R V, Bullard T F, Ford R L, Grimm J P, Pickle J D, Sares S W. 1984. The effect of grain size on detrital modes: A test of the Gazzi−Dickinson point−counting method[J]. Journal of Sedimentary Research, 54(1): 103−116.
[15] Ji J L, Zhang K X, Clift P, Zhuang G S, Song B W, Ke X, Xu Y D. 2017. High−resolution magnetostratigraphic study of the Paleogene−Neogene strata in the northern Qaidam Basin: Implications for the growth of the northeastern Tibetan Plateau[J]. Gondwana Research, 46: 141−155. doi: 10.1016/j.gr.2017.02.015
[16] Jian X, Guan P, Zhang D W, Zhang W, Feng F, Liu R J, Lin S D. 2013. Provenance of Tertiary sandstone in the northern Qaidam basin, northeastern Tibetan Plateau: Integration of framework petrography, heavy mineral analysis and mineral chemistry[J]. Sedimentary Geology, 290: 109−125. doi: 10.1016/j.sedgeo.2013.03.010
[17] Kapp P, Pelletier J D, Rohrmann A, Heermance R, Russell J, Ding L. 2011. Wind erosion in the Qaidam basin, central Asia: Implications for tectonics, paleoclimate, and the source of the Loess Plateau[J]. GSA Today, 21: 4−10.
[18] Liu Yun. 1985. Clay Minerals of late Cretaceous Song−Liao Basin and their sedimentary environment[J]. Journal of Sedimentology, 3(4): 131−140 (in Chinese).
[19] Liu Yongjiang, Franz N, Li Weimin, Johann G, Li Wei. 2012. Tectono−thermal events of the northern Qaidam margin−southern Qilian area, Western China[J]. Journal of Jilin University (Earth Science Edition), 42(5): 1317−1329 (in Chinese).
[20] Liu Zechun, Wang Jian, Wang Yongjin, Sun Shiying, Chen Yan'an, Zhang Jianxin, Jiang Wenying, Fan Lianshun, Li Jianqing, Yang Fan. 1996. On lower Tertiary chronostratigraphy and climatostratigraphy of Mangyai Depression in western Qaidam Basin[J]. Journal of Stratigraphy, 20(2): 104−113 (in Chinese).
[21] Lu H J, Ye J C, Guo L C, Pan J W, Xiong S F, Li H B. 2019. Towards a clarification of the provenance of Cenozoic sediments in the northern Qaidam basin[J]. Lithosphere, 1(12): 252−272.
[22] McLennan S M, Hemming S R, Mcdaniel D K, Hanson G N. 1993. Geochemical approaches to sedimentation, provenance, and tectonics[J]. Geological Society of America Special Paper, 284: 21−40.
[23] Meng Q R, Fang X. 2008. Cenozoic tectonic development of the Qaidam Basin in the northeastern Tibetan Plateau, in Burchfiel B C, and Wang E, eds. , Investigations into the Tectonics of the Tibetan Plateau[J]. Geological Society of America Special Paper, 444: 1−24.
[24] Menold C A, Manning C E, Yin A, Tropper P, Chen X H, Wang X F. 2009. Metamorphic evolution, mineral chemistry and thermobarometry of orthogneiss hosting ultrahighpressure eclogites in the North Qaidam metamorphic belt, western China[J]. Journal of Asian Earth Sciences, 35(3/4): 273−284. doi: 10.1016/j.jseaes.2008.12.008
[25] Métivier F, Gaudemer Y, Tapponnier P, Meyer B. 1998. Northeastward growth of the tibet plateau deduced from balanced reconstruction of two depositional areas: The Qaidam and Hexi Corridor basins, China[J]. Tectonics, 17(6): 823−842. doi: 10.1029/98TC02764
[26] Morton A C. 1985. A new approach to provenance studies: electron microprobe analysis of detrital garnets from Middle Jurassic sandstones of the northern North Sea[J]. Sedimentology, 32(4): 553−566. doi: 10.1111/j.1365-3091.1985.tb00470.x
[27] Morton A C, Ellis D, Fanning M, Jolley D W, Whitham A G. 2012. The importance of an integrated approach to provenance studies: A case study from the Paleocene of the Faroe−Shetland Basin, NE Atlantic[J]. Geological Society London Special Publications, 487(7): 472−481.
[28] Nie J S, Ren X P, Saylor J E, Su Q D, Pfaff K. 2019. Magnetic polarity stratigraphy, provenance, and paleoclimate analysis of Cenozoic strata in the Qaidam Basin, NE Tibetan Plateau[J]. Geological Society of America Bulletin, 132(1/2): 310−320.
[29] Palme H. 1988. Chemical Abundances in Meteorites[J]. Cosmic Chemistry, 28–51.
[30] Pang J Z, Yu J X, Zheng D W, Wang W T, Ma Y, Wang Y Z, Li C P, Li Y J, Wang Y. 2019. Neogene expansion of the Qilian Shan, north Tibet: Implications for the dynamic evolution of the Tibetan Plateau[J]. Tectonics, 38(3): 1018−1032. doi: 10.1029/2018TC005258
[31] Petroleum and Natural Gas Industry Standards Writing Group. 2018. Analysis method for clay minerals and ordinary non−clay minerals in sedimentary rocks by the X−ray diffraction (SY/T 5163−2018) [S]. Beijing: Petroleum Industry Press.
[32] Pullen A, Kapp P, Mccallister A T, Chang H, Gehrel G E, Garzione C N, Heermance R V, Ding L. 2011. Qaidam Basin and northern Tibetan Plateau as dust sources for the Chinese Loess Plateau and paleoclimatic implications[J]. Geology, 39(11): 1031−1034. doi: 10.1130/G32296.1
[33] Pu Haibo. 2011. Method of identifying clay mineral by X−Ray diffraction analysis[J]. Investigation Science and Technology, (5): 16−18 (in Chinese with English abstract).
[34] Ren Yingxin. 1987. Separation and Identification of Heavy Sand Minerals[M]. Wuhan: China University of Geosciences Press (in Chinese).
[35] Rieser A B, Neubauer F, Liu Y, Ge X. 2005. Sandstone provenance of north−western sectors of the intracontinental Cenozoic Qaidam basin, western China: Tectonic vs. climatic control[J]. Sedimentary Geology, 177(1−2): 1−18. doi: 10.1016/j.sedgeo.2005.01.012
[36] Rieser A B, Liu Y, Genser J, Neubauer F, Handler R, Friedl G, Ge X H. 2006. 40Ar/39Ar ages of detrital white mica constrain the Cenozoic development of the intracontinental Qaidam Basin, China[J]. Geological Society of America Bulletin, 118(11−12): 1522−1534. doi: 10.1130/B25962.1
[37] Sun G Q, Wang M, Guo J J, Wang Y T, Yang Y H. 2020. Geochemical significance of clay minerals and elements in Paleogene sandstones in the Center of the northern margin of the Qaidam Basin, China[J]. Minerals, 10(6): 505. doi: 10.3390/min10060505
[38] Tapponnier P. 2001. Oblique stepwise rise and growth of the Tibet plateau[J]. Science, 294(5547): 1671−1677. doi: 10.1126/science.105978
[39] Taylor S R, McLennan S M. 1985. The continental crust: Its composition and evolution[J]. The Journal of Geology, 94(4): 57−72.
[40] Wang Guocan, Zhang Kexin, Cao Kai, Wang An, Xu Yadong, Meng Yanning. 2010. Expanding processes of the Qinghai−Tibet Plateau during Cenozoic: An insight from spatio−temporal difference of uplift[J]. Earth Science:Journal of China University of Geosciences, 35(5): 713−727 (in Chinese with English abstract). doi: 10.3799/dqkx.2010.086
[41] Wang W T, Zheng W J, Zhang P Z, Li Q, Kirby E, Yuan D Y, Zheng D W, Liu C C, Wang Z C, Zhang H P. 2017. Expansion of the Tibetan Plateau during the Neogene[J]. Nature Communications, 8: 15887. doi: 10.1038/ncomms15887
[42] Wang Yetong, Sun Guoqiang, Yang Yongheng, Wang Meng, Ma Fuqiang, Zhang Chengjuan, Zhao Jian, Shi Ji'an. 2019. U−Pb geochronology analysis of detrital zircons in the paleogene lower Xiaganchaigou Formation in the northern Mahai area, northern margin of Qaidam basin[J]. Journal of Lanzhou University (Natural Sciences) 55(2): 141−148, 157 (in Chinese with English abstract).
[43] Wu Zhenhan, Hu Daogong, Wu Zhonghai, Ye Peisheng, Zhou Chunjing. 2009. Quaternary sinistral−slip thrusting in north margin of Qaidam basin[J]. Quaternary Sciences, 29(3): 599−607 (in Chinese with English abstract).
[44] Yang Jingsui, Xu Zhiqin, Song Shuguang, Wu Cailai, Shi Rendeng, Zhang Jianxin, Wan Yusheng, Li Haibing, Jin Xiaochi, Marc J. 2000. Discovery of eclogite in Dulan, Qinghai Province and its significance for studying the HP−UHP metamorphic belt along the Central Orogenic Belt of China[J]. Acta Geologica Sinica, 74(2): 156−168 (in Chinese with English abstract).
[45] Yang Lirong, Li Jianxing, Yue Leping, Wang Hongliang, Guo Huaijun, Zhu Xiaohui, Zhu Tao, Du Kai, Zhang Rui, Zhang Yunxiang, Gong Hujun. 2017. Stratigraphic division and tectonic−sedimentary evolution of Paleogene in Qilian Mountain and its adjacent areas[J]. Science China: Earth Sciences, 47(5): 586−600 (in Chinese).
[46] Yin A, Rumelhart P E, Butler R, Cowgill E, Harrison T M, Foster D A, Ingersoll R V, Zhang Q, Zhou X Q, Wang X F. 2002. Tectonic history of the Altyn Tagh fault system in northern Tibet inferred from Cenozoic sedimentation[J]. Geological Society of America Bulletin, 114(10): 1257−1295. doi: 10.1130/0016-7606(2002)114<1257:THOTAT>2.0.CO;2
[47] Yin A, Dang Y Q, Zhang M, McRivette M W, Burgess W P, Chen X H. 2007a. Cenozoic tectonic evolution of Qaidam Basin and its surrounding regions (Part 2): Wedge tectonics in southern Qaidam basin and the eastern Kunlun Range[J]. Geological Society of America Special Papers, 433: 369−390.
[48] Yin A, Manning C E, Lovera O, Menold C A, Chen X H, Gehrels G E. 2007b. Early Paleozoic tectonic and thermomechanical evolution of ultrahigh−pressure (UHP) metamorphic rocks in the northern Tibetan Plateau, Northwest China[J]. International Geology Review, 49(8): 681−716. doi: 10.2747/0020-6814.49.8.681
[49] Yin A, Dang Y Q, Wang L C, Jiang W M, Zhou S P, Chen X H, Gehrels G E, Mcrivette M W. 2008a. Cenozoic tectonic evolution of Qaidam basin and its surrounding regions (Part 1): The southern Qilian Shan−Nan Shan thrust belt and northern Qaidam basin[J]. Geological Society of America Bulletin, 120(7/8): 813−846. doi: 10.1130/B26180.1
[50] Yin An, Dang Yuqi, Zhang Min, Chen Xuanhua, McRivette M W. 2008b. Cenozoic tectonic evolution of the Qaidam basin and its surrounding regions (Part 3): Structural geology, sedimentation, and regional tectonic reconstruction[J]. Geological Society of America Bulletin, 120(7/8): 847−876. doi: 10.1130/B26232.1
[51] Yu L, Xiao A C, Wu L, Tian Y T, Rittner M, Lou Q Q, Pan X T. 2017. Provenance evolution of the Jurassic northern Qaidam Basin (West China) and its geological implications: evidence from detrital zircon geochronology[J]. International Journal of Earth Sciences, 106(8): 1−14.
[52] Zeng Xu, Lin Tong, Wang Wei, Yan Zhandong, Hao Cuiguo, Bian Yingying, Wang Jun. 2019. Detrital zircon dating of LA−ICP−MSin the Upper Jurassic and indicative significanceof the Qaidam Basin[J]. Natural Gas Geoscience, 30(5): 662−672 (in Chinese with English abstract).
[53] Zhang Chenyu, Wu Lei, Chen Wuke, Zhang Yongshu, Xiao Ancheng, Zhang Junyong, Chen Siyuan, Chen Hanlin. 2020. Early Cretaceous foreland−like Northeastern Qaidam Basin, Tibetan Plateau and its tectonic implications: Insights from sedimentary investigations, detrital zircon U−Pb analyses and seismic profiling[J]. Palaeogeography, Palaeoclimatology, Palaeoecology, 557: 109912.
[54] Zhu L D, Wang C S, Zheng H B, Xiang F, Yi H S, Liu D Z. 2006. Tectonic and sedimentary evolution of basins in the northeast of Qinghai−Tibet Plateau and their implication for the northward growth of the Plateau[J]. Palaeogeography, Palaeoclimatology, Palaeoecology, 241(1): 49−60.
[55] Zhu Xiaomin. 2008. Sedimentary Petrology[M]. Bejing: Petroleum Industry Press, 90−105 (in Chinese).
[56] Zhuang G S, Hourigan J K, Ritts B D, Kent−Corson M L. 2011. Cenozoic multiple−phase tectonic evolution of the Northern Tibetan Plateau: constraints from sedimentary records from Qaidam Basin, Hexi corridor, and Subei Basin, Northwest China[J]. American Journal of Science, 311(2): 116−152. doi: 10.2475/02.2011.02
[57] 石油天然气行业标准编写组. 2018. 沉积岩中黏土矿物和常见非黏土矿物X射线衍射分析方法 (SY/T 5163−2018) [S] 北京: 石油工业出版社. [58] 刘云. 1985. 松辽盆地晚白垩世黏土矿物特微及沉积环境分析[J]. 沉积学报, (4): 131−140. [59] 刘永江, Franz Neubauer, 李伟民, Johann Genser, 李伟. 2012. 柴北缘−南祁连地区构造热事件[J]. 吉林大学学报(地球科学版), 42(5): 1317−1329. [60] 刘泽纯, 王建, 汪永进, 孙世英, 陈延安, 张建新, 姜文英, 范连顺, 李建青, 杨藩. 1996. 柴达木盆地茫崖凹陷井下下第三系的年代地层学与气候地层学研究[J]. 地层学杂志, 20(2): 104−-113. [61] 蒲海波. 2011. 用X射线衍射分析鉴定黏土矿物的方法[J]. 勘察科学技术, (5): 16−18. [62] 青海省地质矿产局. 1991. 青海省区域地质志. [M]. 北京: 地质出版社. [63] 任迎新. 1987. 重砂矿物分选及鉴定[M]. 武汉: 中国地质大学出版社. [64] 吴珍汉, 胡道功, 吴中海, 叶培盛, 周春景. 2009. 柴达木盆地北缘第四纪左旋斜冲推覆构造运动[J]. 第四纪研究, 29(3): 599−607. [65] 王国灿, 张克信, 曹凯, 王岸, 徐亚东, 孟艳宁. 2010. 从青藏高原新生代构造隆升的时空差异性看青藏高原的扩展与高原形成过程[J]. 地球科学(中国地质大学学报), 35(5): 713−727. [66] 王晔桐, 孙国强, 杨永恒, 王猛, 马富强, 张成娟, 赵健, 史基安. 2019. 柴北缘马北地区下干柴沟组下段碎屑锆石U−Pb年代学分析[J]. 兰州大学学报(自然科学版), 55(2): 141−148,157. [67] 杨经绥, 许志琴, 宋述光, 吴才来, 史仁灯, 张建新, 万渝生, 李海兵, 金小赤, Marc Jolivet. 2000. 青海都兰榴辉岩的发现及对中国中央造山带内高压—超高压变质带研究的意义[J]. 地质学报, 74(2): 156−168. [68] 杨利荣, 李建星, 岳乐平, 王洪亮, 郭怀军, 朱小辉, 朱涛, 杜凯, 张睿, 张云翔, 弓虎军. 2017. 祁连山及邻区古—新近纪地层分区与构造−沉积演化[J]. 中国科学:地球科学, 47(5): 586−600. [69] 曾旭, 林潼, 王薇, 闫占冬, 郝翠果, 边滢滢, 王军. 2019. 柴达木盆地上侏罗统碎屑锆石LA−ICP−MS定年及指示意义[J]. 天然气地球科学, 30(5): 662−672. [70] 朱筱敏. 2008. 沉积岩石学[M]. 北京: 石油工业出版社, 90−105. -
期刊类型引用(0)
其他类型引用(1)


 下载:
下载:
