Difference study on microbial community structure and diversity of groundwater in different coastal zones
-
摘要:研究目的
海水入侵已成为全球沿海地区面临的重大环境地质问题及研究热点,探究海水入侵区地下水微生物群落特征可以对海水入侵的管理与防治起到支撑作用。
研究方法本研究选取黄渤海地区两个典型海岸带(烟台龙口西海岸及青岛大沽河海岸),基于高通量测序方法对当地地下水微生物进行16S rDNA分析,对比海水入侵程度不同的海岸带地下水微生物群落结构与多样性特征差异。
研究结果大沽河研究区相比龙口研究区地下水受海水入侵的影响更为严重,地下水TDS含量在1.06~3.19 g/L,以Na–Cl–HCO3和Na–Cl型水为主,而龙口研究区地下水TDS相对较低,以Ca–Na–Cl–HCO3型水为主。Alpha多样性指数表明,龙口研究区地下水微生物的均匀度和丰富度随着海水入侵程度的增强而减小,而大沽河研究区地下水微生物多样性变化复杂。龙口研究区三个监测点地下水微生物群落结构相似,而大沽河研究区的微生物群落结构差异较大。龙口研究区标志微生物为伯克霍尔德氏菌目(Burkholderiales),丛毛单胞菌科(Comamonadaceae)和噬氢菌属(Hydrogenophaga);大沽河研究区标志微生物较少,在阈值St≥4.0时标志微生物仅为变形菌门(Proteobacteria)。龙口研究区地下水TOC和DO与微生物丰度呈现正相关关系;而大沽河研究区中,Na+、Cl–、SO42–等指标与微生物丰度呈显著负相关关系,这与当地受海水入侵时间较长有关。
结论本研究揭示了在不同程度的海水入侵影响下地下水微生物与环境的响应特征,并表现出了不同的标志微生物,表明微生物指标可作为识别海水入侵的新型有效方法。
创新点:采用高通量测序方式揭示不同海岸带地下水微生物群落特征;探究沿海地区地下水微生物与环境因子的响应关系。
Abstract:This paper is the result of environmental geological survey engineering.
ObjectiveSeawater intrusion has become a major environmental and geological problem as well as research hotspot in coastal areas all over the world. To explore the characteristics of groundwater microbial communities in coastal areas can play a fundamental role in the management and prevention of seawater intrusion.
MethodsThis study took two typical costal zones in Yellow Sea and Bohai Sea such as Longkou west bank and Dagu river coast. The microbial 16S rDNA of groundwater was analyzed by high–throughput sequencing method, to explore the diversity and structure characteristics of groundwater microbial communitiesin different areas.
ResultsThe groundwater in Dagu river study area was more seriously affected by seawater intrusion than that in Longkou. In Dagu river study area, the TDS concentration of groundwater was 1.06−3.19 g/L, mainly Na–Cl–HCO3 and Na–Cl type water. In Longkou study area, the TDS of groundwater was relatively low, mainly Ca–Na–Cl–HCO3 type water. The Alpha diversity index showed that the microbial uniformity and richness of groundwater decreased with the increasing seawater intrusion in Longkou, while the variation of microbial diversity of groundwater in Dagu river study area was complex. The groundwater microbial community structures of three monitoring wells in Longkou study area were similar, but the groundwater microbial community structures in Dagu river study area were different. The representative microorganisms of groundwater in Longkou were Burkholderiales, Comamonadaceae and Hydrogenophaga. In Dagu river study area, the representative microorganisms of groundwater are a little, only Proteobacteria was identified at the threshold St≥4.0. TOC and DO were positively correlated with bacterial abundance in groundwater in Longkou study area. In the Dagu river study area, Na+, Cl–, SO42– and other indicators were negatively correlated with bacterial abundance in groundwater, which was related to the long period of seawater intrusion.
ConclusionsThis study revealed the response characteristics of groundwater microorganisms and the environment under the influence of seawater intrusion at different degrees, and showed different representative microorganisms, indicating that microbial indicators can be used as a new and effective method to identify seawater intrusion.
Highlights:High−throughput sequencing was used to reveal the characteristics of groundwater microbial communities in different coastal zones; To explore the response relationship between groundwater microbial communities and environmental factors in coastal areas.
-
1. 引 言
在沿海地区,由于人类对地下水的过度开采,导致海水侵入到淡水含水层系统,人们通常将这个过程称之为海水入侵(王辉和许学工,2016)。它不仅受到人为因素的影响,海平面上升(夏军等,2013;Shi et al., 2020)以及降水量减少(李选彧,2020;赵洁等,2020)等自然因素也会造成入侵程度的增加。除此之外,海岸带的类型和地质条件同样控制着海水入侵的发生地点、方式和途径(Shen et al., 2020;王焰新等,2020;孙金华等,2021)。目前人们已经逐渐认识到地下水微生物在海水入侵过程中的重要性。Liu et al.(2014)针对珠江三角洲地区的地下水化学与细菌群落的关系进行分析,认为细菌群落可以揭示当地海水入侵和三角洲演化等地质事件现象,同时也控制着含水层地下水的质量。Unno et al.(2015)在济州岛沿海地区采用微生物分析手段进行地下水质量和海水入侵检测研究,并认为部分细菌可作为海水入侵的微生物指标。Rocca et al.(2019)则通过咸水与淡水混合实验来模拟海水入侵,进一步揭示微生物对其的响应关系。
黄渤海沿海地区作为中国海水入侵最为严重的区域之一,至今仍是很多学者们关注的重点(吴吉春等,2018;Gao et al., 2019;孙金华等,2021;Yu et al., 2021)。目前已有相关学者对当地海水入侵区的地下水微生物特征进行研究(Chen et al., 2019),并且针对咸淡水过渡区中地下水微生物在时间上的变化进行了详细分析,对比了丰枯水期地下水微生物群落结构与多样性特征(Chen et al., 2020)。然而从空间角度全面探究当地海岸带地下水微生物群落差异的研究还鲜有报道,地下水微生物能否与大型生物有着相似的地理分布格局,因各种条件的不同而产生明显差异(黄艺等,2018),这是本文所研究的重点,同时对于理解不同海岸带地下水微生物群落特征有指导意义。本文在黄渤海沿海地区选取两个典型海岸带,通过高通量测序方式对地下水微生物进行16S rDNA分析,对比两个典型海岸带的地下水微生物群落多样性和结构组成,揭示在不同入侵程度和环境差异显著的区域地下水微生物群落差异,为海水入侵的微生物识别提供借鉴。
2. 材料与方法
2.1 研究区概况与样品采集
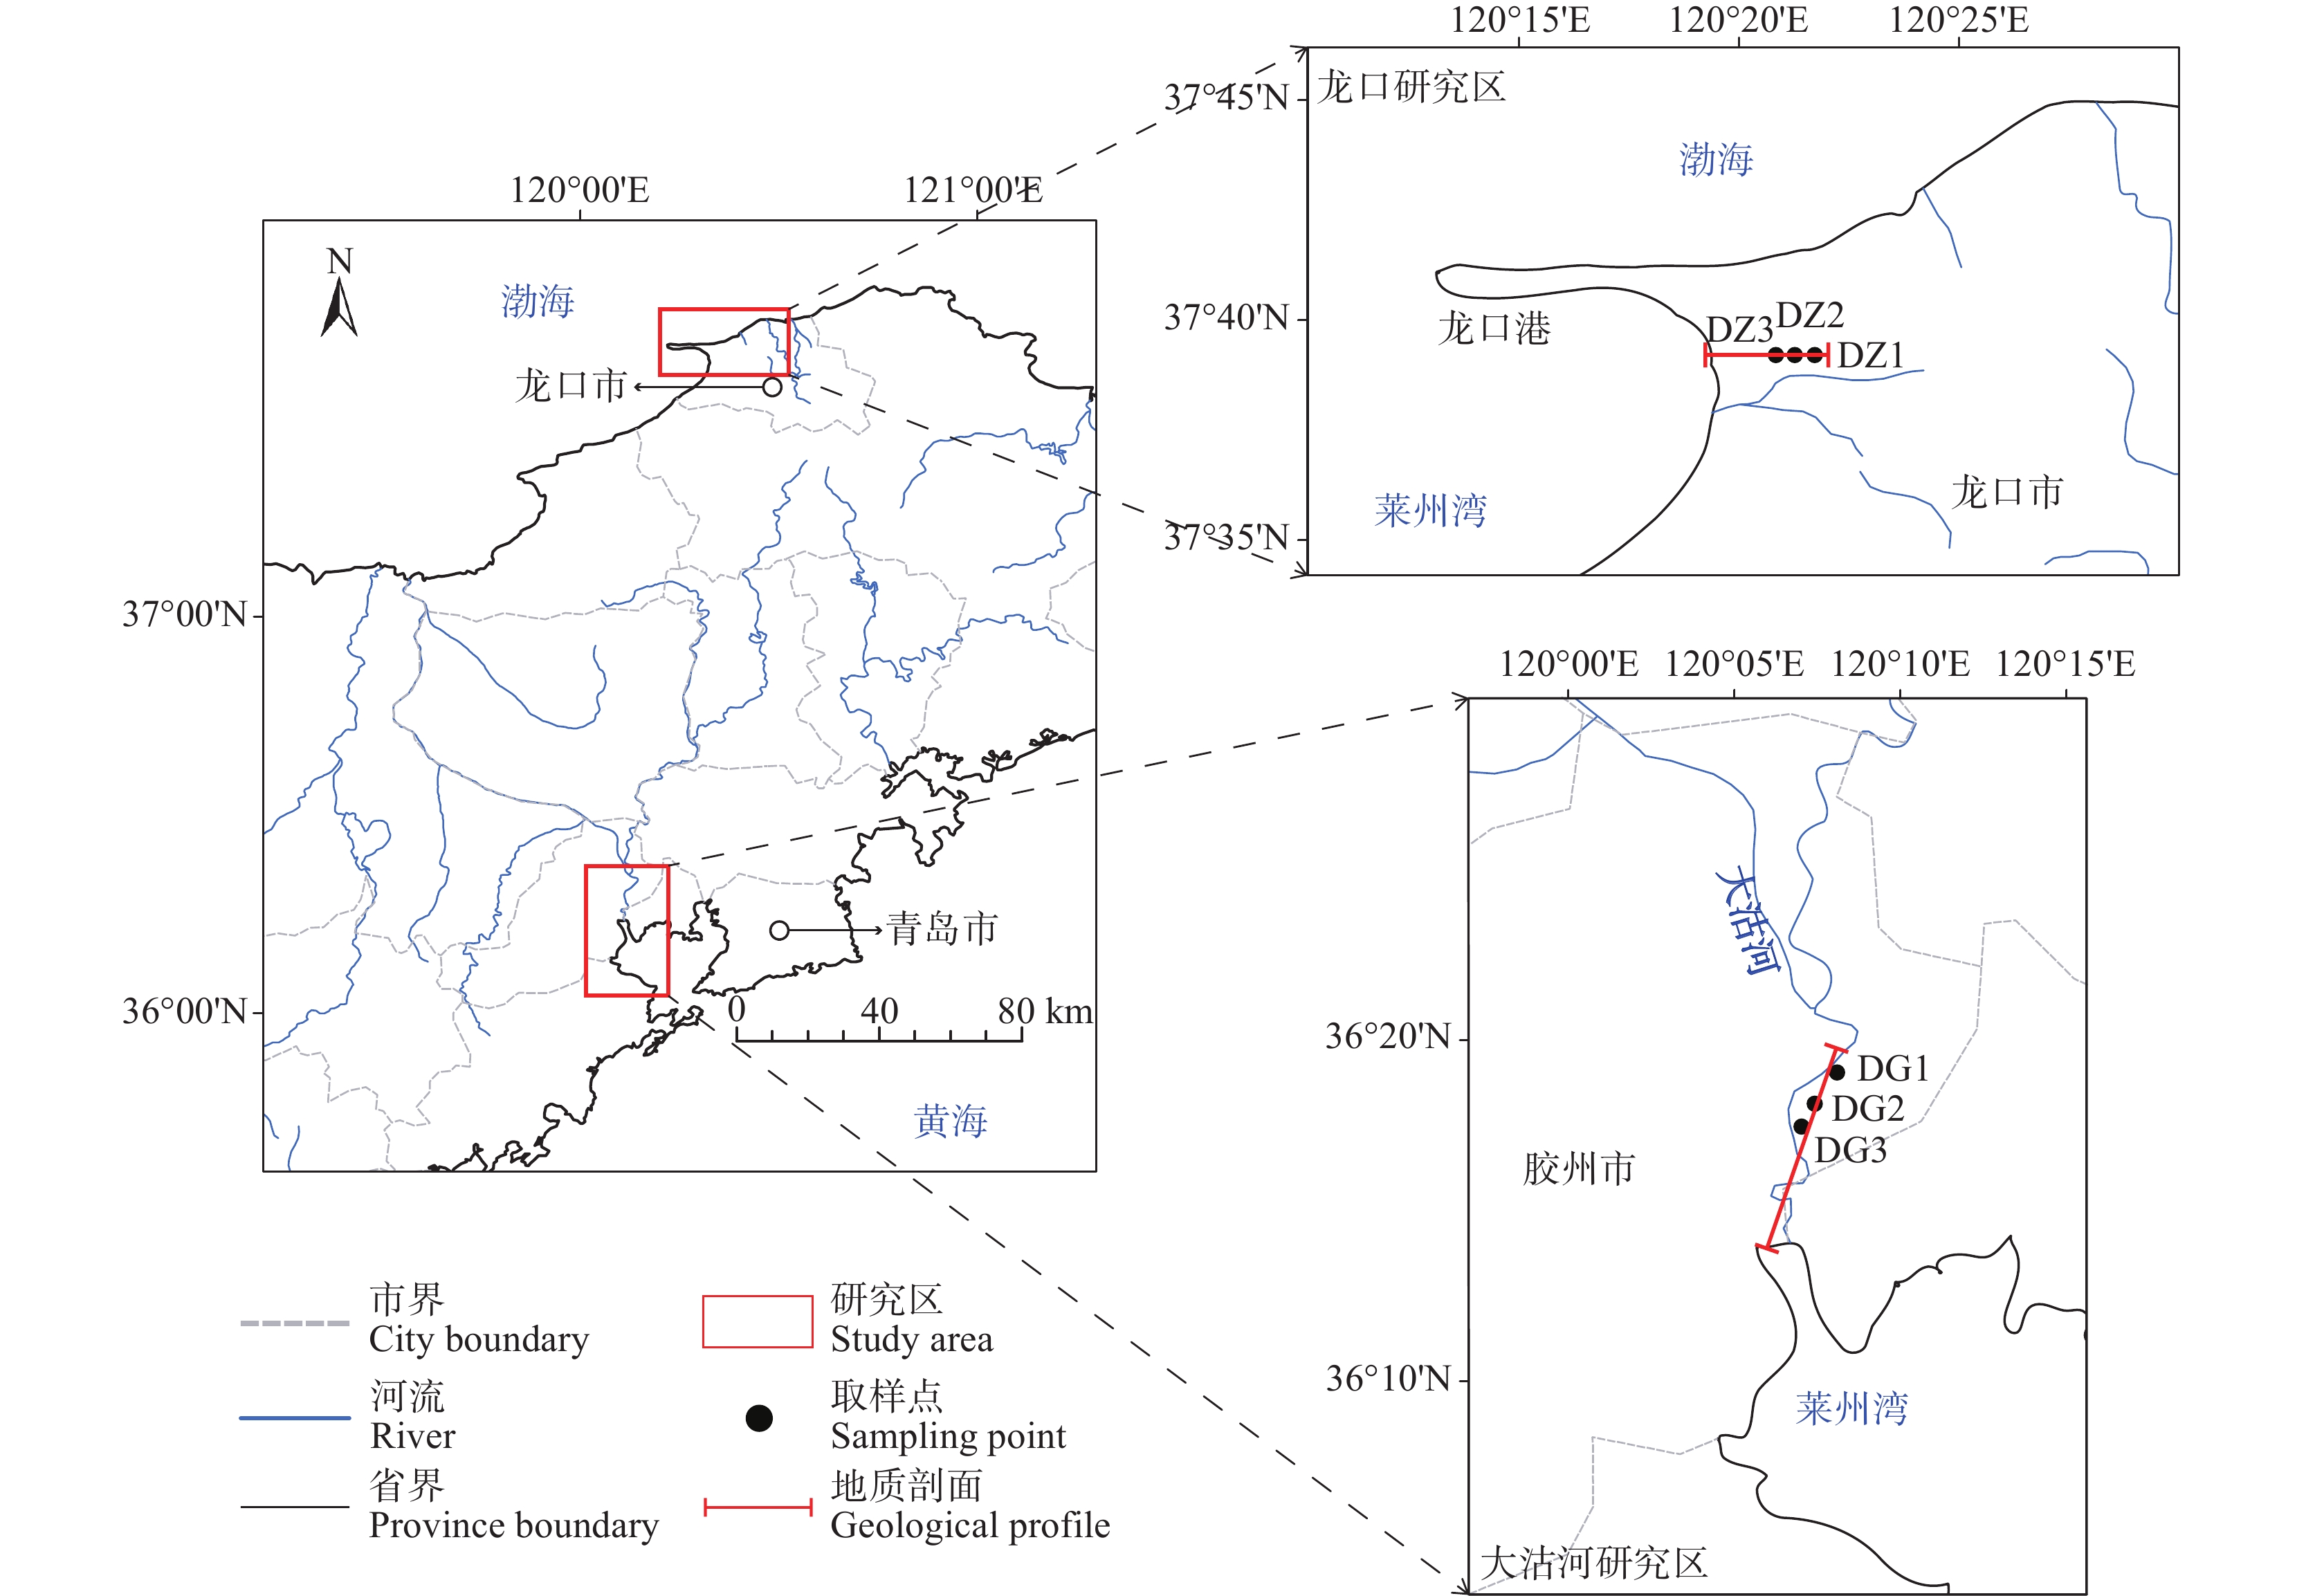
选择两个典型海岸带研究区,一个位于龙口市西沿岸,临近渤海,另一个位于青岛大沽河沿岸,临近黄海(图1)。分别在龙口研究区以及大沽河研究区的三眼监测井采集6组地下水样,编号分别为DZ1、DZ2、DZ3、DG1、DG2和DG3,每组水样采集3个平行样品,共采集18个水样。六眼监测井的成井深度在14.4~20.0 m,取水层位均为第四系潜水含水层,岩性以砂、砂砾和砾石为主。其中每一眼监测井的一部分水样收集在4 L无菌样品瓶中,第一时间将水样通过0.22 μm无菌微孔滤膜进行过滤。将过滤好的滤膜放置于50 mL无菌离心管,并储存于干冰内(温度达到−80℃),及时送往实验室进行微生物测试;用于检测常规离子指标和TOC的水样收集在500 mL样品瓶中,并储存于4℃冰箱内,直至测试分析。
2.2 DNA提取与PCR扩增
使用Power Water® DNA Isolation Kit装置对过滤后的滤膜进行微生物DNA提取,并将其保存在−80℃超低温冰柜内。使用引物341F(5'–CCTAYGGGRBGCASCAG–3')和806R(5'–GGACTACNNGGGTATCTAAT–3')对16S rDNA基因的V3–V4区域进行PCR(聚合酶链反应,Polymerase Chain Reaction)扩增。实验所使用的PCR扩增仪型号为ABI GeneAmp® 9700,循环条件为:95℃变性5 min,95℃循环30 s,55℃热处理30 s,72℃扩增45 s,72℃拉伸10 min直至降低到10℃。
然后将PCR产物汇总成一个样本进行排序测序。所有的读数都与条形码完全匹配,以便获得有效的原始读数。通过Illumina HiSeq2500型(BIPES)管道处理原始序列并生成重叠标记,最后采用QIIME软件进行分析。
2.3 统计分析
使用Alpha多样性指数来表征微生物OTU(操作分类单元,Operational Taxonomic Unit)的数目和群落多样性,这些指数的计算都在QIIME软件中完成(QIIME计算方法见http://qiime.org/)。其中丰富度指数包括Chao1指数和Observed species指数,它们用于代表样品物种数目的多少。均匀度指数为Shannon指数,用于代表样品的均匀程度(章妮等,2022)。PD指数用于代表系统发育程度(Lozupone and Knight, 2008;路丹等,2015)。基于样品相对丰度数据,可以直观显示地下水微生物群落结构特征。线性判别分析法(LEfSe)可以识别出两个海岸带的标志微生物。通过对两个不同海岸带地下水微生物丰度和环境因子进行回归分析,讨论环境因子对微生物群落丰度值的响应。利用PICRUSt对地下水微生物的功能进行预测,并比较其功能特性差异。
3. 结果与讨论
3.1 地下水化学特征
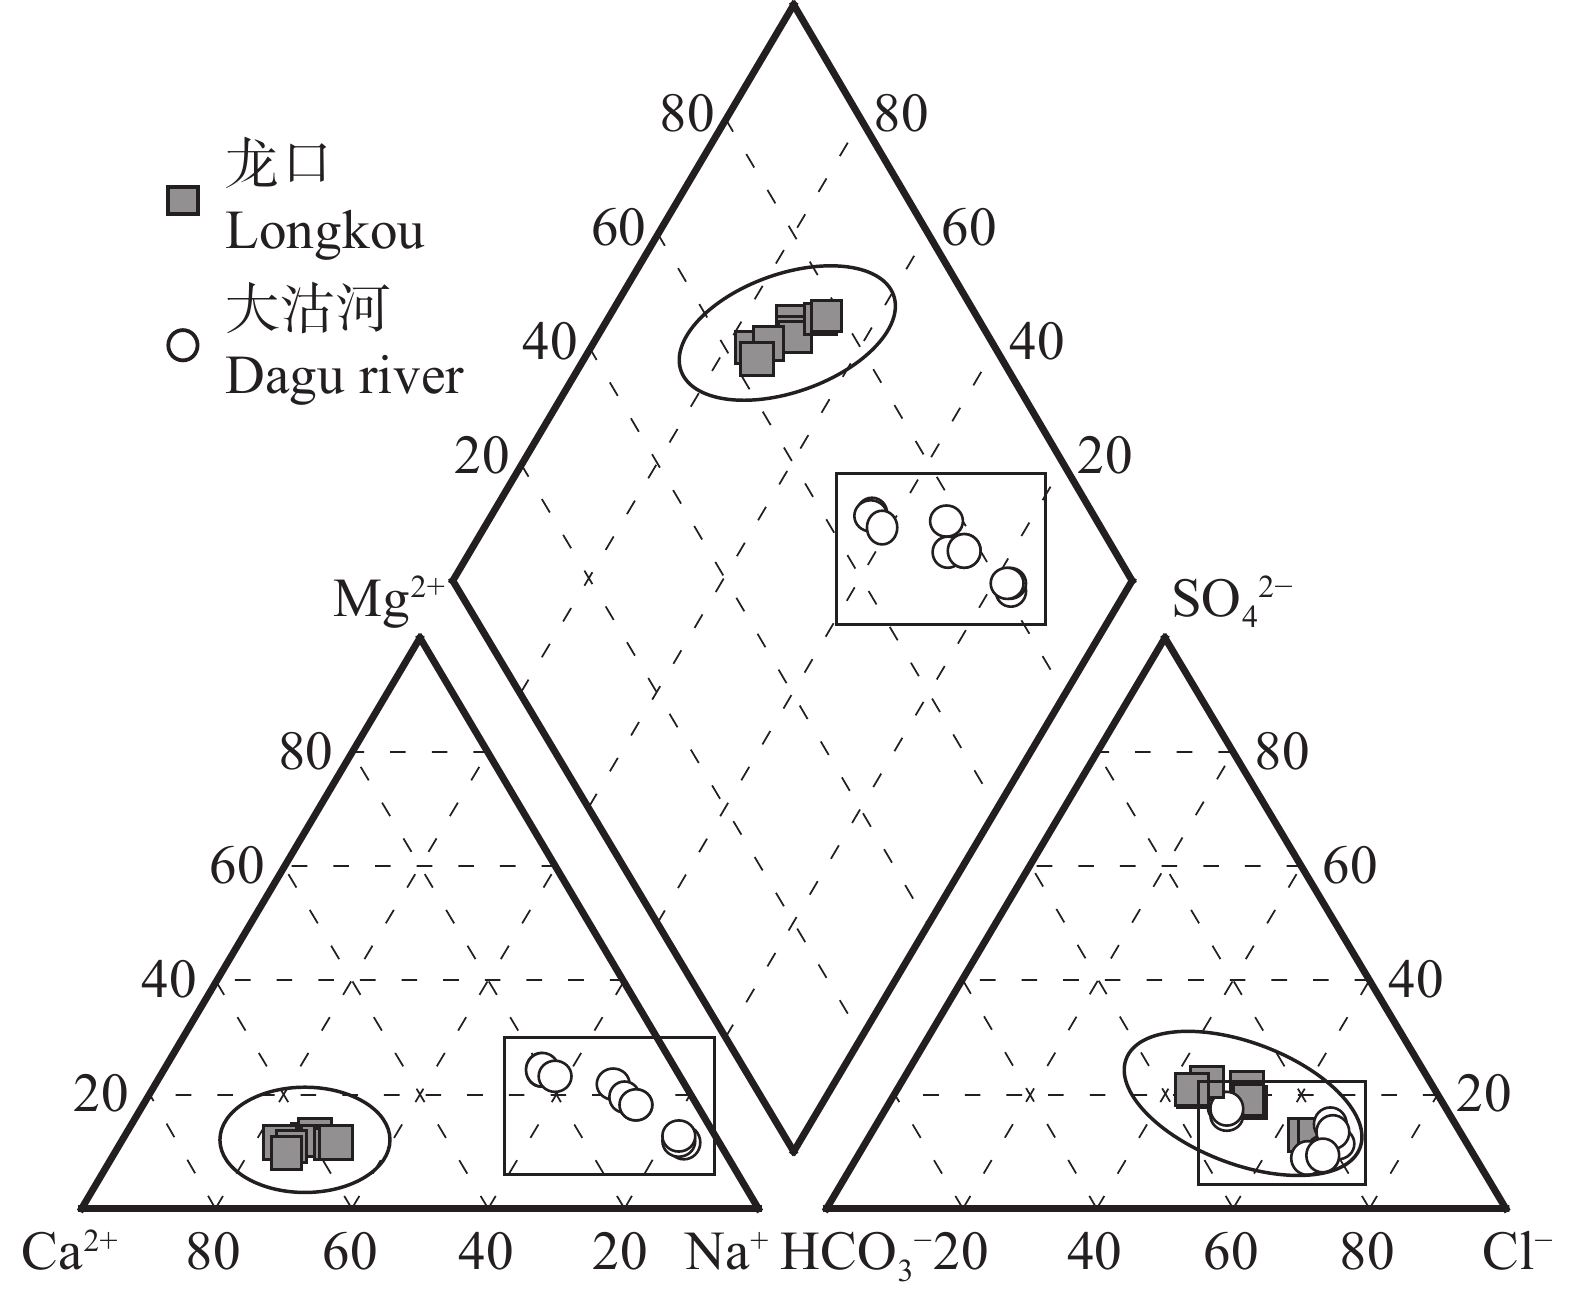
由表1可以看出,两个研究区地下水pH值介于7.30~7.68,差异不大,以中性偏弱碱性为主。龙口和大沽河两个研究区地下水TDS浓度均呈现逐渐增加的趋势,其TDS平均值分别为0.95 g/L和2.43 g/L。大沽河研究区地下水以Na–Cl型水为主,而龙口研究区地下水以Ca–Na–Cl–HCO3型水为主(图2)。由于海水中Mg2+浓度高于Ca2+浓度,因此常用Mg/Ca摩尔比来评价海水入侵的程度(Wook et al., 2003;Valenzuela−Madrigal et al., 2017)。根据表1水化学组分计算得到,大沽河研究区Mg/Ca比值介于1.28~2.23,而龙口研究区Mg/Ca比值介于0.18~0.21。另外,Cl/HCO3摩尔比反映了相同的海水入侵特征,Cl–作为海水的特征指标,HCO3–作为地下淡水的特征指标,两个研究区的Cl/HCO3比值分别介于1.54~3.67和1.21~2.76。根据两个研究区主要物化指标和前人研究结论可以得出,大沽河研究区地下水受海水入侵的影响较为严重(熊贵耀等,2019),而龙口市研究区地下水存在明显的阳离子交换作用(吴吉春等,1996)。
表 1 龙口和大沽河研究区地下水样品物化指标Table 1. Physico–chemical parameters of groundwater samples of Longkou and Dagu river study areas物化指标 龙口 大沽河 DZ1 DZ2 DZ3 DG1 DG2 DG3 GL/m –3.31 –2.91 –1.89 –0.52 –0.40 –0.69 T/℃ 16.51 17.08 16.60 18.97 18.74 19.50 pH 7.62 7.30 7.35 7.61 7.68 7.54 TOC/(mg/L) 1.70 1.80 1.70 1.80 2.50 2.80 EC/(mS/cm) 1.37 1.82 2.52 1.45 4.13 4.40 TDS/(g/L) 0.68 0.91 1.26 1.06 3.05 3.19 ORP/mV 13.00 21.00 6.00 72.00 49.00 –59.00 DO/(mg/L) 5.28 4.38 4.40 6.28 6.05 2.10 Cl–/(mg/L) 173.08 311.79 604.26 279.15 1314.62 1408.37 HCO3–/(mg/L) 246.01 289.27 376.42 311.71 616.20 787.62 NO3–/(mg/L) 286.01 98.34 153.07 1.08 1.14 32.73 SO42–/(mg/L) 114.09 178.80 167.22 135.74 299.03 269.80 Ca2+/(mg/L) 198.20 208.62 284.48 52.02 50.43 75.18 Na+/(mg/L) 81.00 106.37 174.50 188.03 886.81 676.60 Mg2+/(mg/L) 22.00 26.74 34.90 40.07 67.59 91.07 K+/(mg/L) 2.10 3.08 3.24 23.40 48.04 45.84 注:GL—潜水地下水位;TOC—总有机碳;EC—电导率;TDS—总溶解固体;ORP—氧化还原电位;DO—溶解氧。 3.2 微生物群落结构与多样性
通过比较龙口和大沽河两个典型海岸带地下水微生物alpha多样性指标可以看出,龙口研究区样品中除Chao1指数,其他3个指数都逐渐降低,说明地下水微生物的均匀度和丰富度随着海水入侵程度的增强而减小。而大沽河研究区的样品除Shannon指数,其他3个指数都是在DG2取样点位显示为最低,说明DG2点位地下水微生物的丰富度较低,这可能是受到其他因素的影响(表2)。
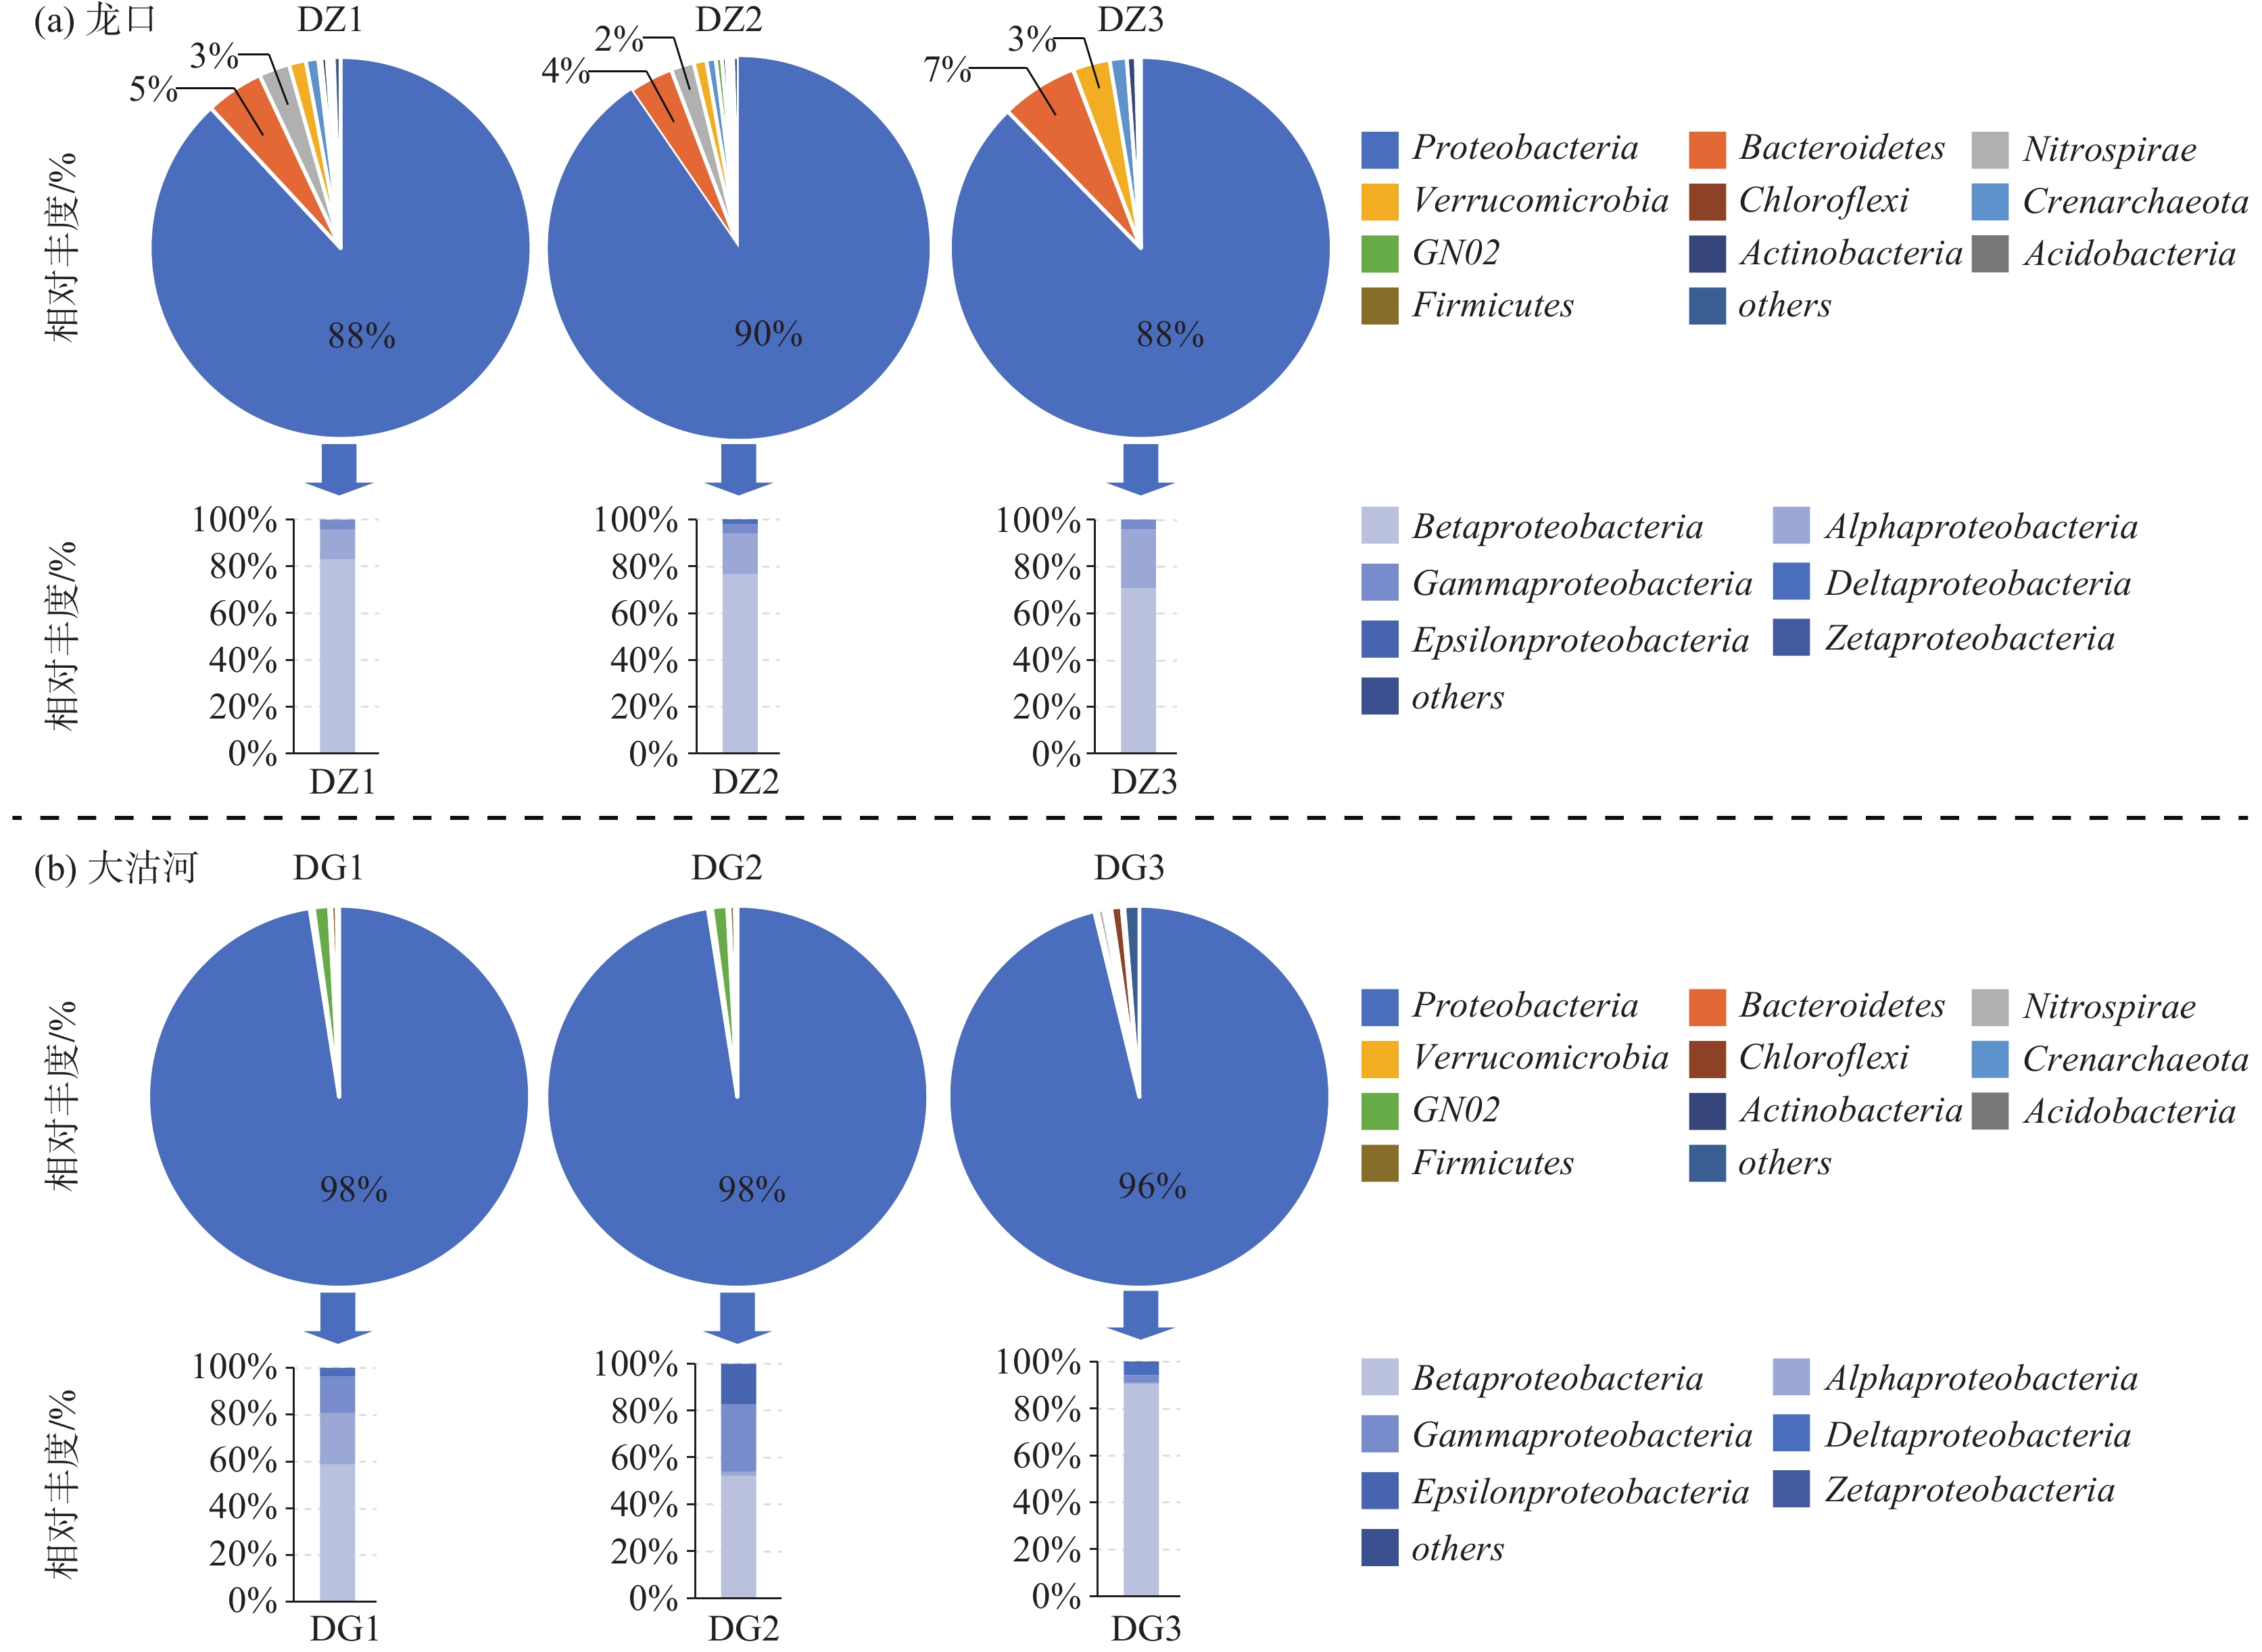
表 2 龙口与大沽河研究区地下水样品的微生物群落Alpha多样性指标Table 2. Microbial community Alpha diversity indices for the groundwater samples of Longkou and Dagu river study areas多样性指标 龙口 大沽河 DZ1 DZ2 DZ3 DG1 DG2 DG3 Shannon 4.49 4.75 3.46 4.54 4.48 4.20 Chao1 706 573 701 728 338 572 Observed species 239 200 179 218 131 190 PD 17.0 17.0 14.2 20.6 9.4 15.9 在微生物群落结构方面,分别对两个研究区地下水微生物按门、纲、目、科和属进行分类。在门水平上,变形菌门(Proteobacteria)在所有细菌门中占比最大,两个研究区样品中平均占比分别为89%和97%。除此之外,拟杆菌门(Bacteroidetes)和硝化螺旋菌门(Nitrospirae)也占据一定比例。基于上述结论,进一步对变形菌门(Proteobacteria)在纲水平上的组成进行分析,其中β–变形菌纲(Betaproteobacteria)和α–变形菌纲(Alphaproteobacteria)占据主要地位。龙口研究区三口井的微生物群落结构的梯度特征明显,并表现出了一致性,β–变形菌纲(Betaproteobacteria)的百分比含量随着盐度的增加而逐渐降低,而α–变形菌纲(Alphaproteobacteria)则与之相反。大沽河研究区的三口井的微生物群落结构特征相对较为杂乱,其中在靠近海水附近的井点DG3与其他两口井明显不同,几乎被β–变形菌纲(Betaproteobacteria)所占据,这可能与DG3靠近养鸭场有关(图3)。已有研究表明,养殖场肥料、粪污入渗对土壤、地下水微生物群落具有显著影响(He et al., 2019;Gai et al., 2021)。
![]() 图 3 龙口与大沽河研究区样品优势菌群在门类水平的结构示意图以及变形菌门在纲类水平的结构示意图Figure 3. Pie charts representing relative abundance of the dominant bacterial communities from groundwater samples classified at the phylum level in Longkou and Dagu river study areas; Bar graphs representing relative abundance of the dominant bacterial communities from groundwater samples classified at the class level of Proteobacteria
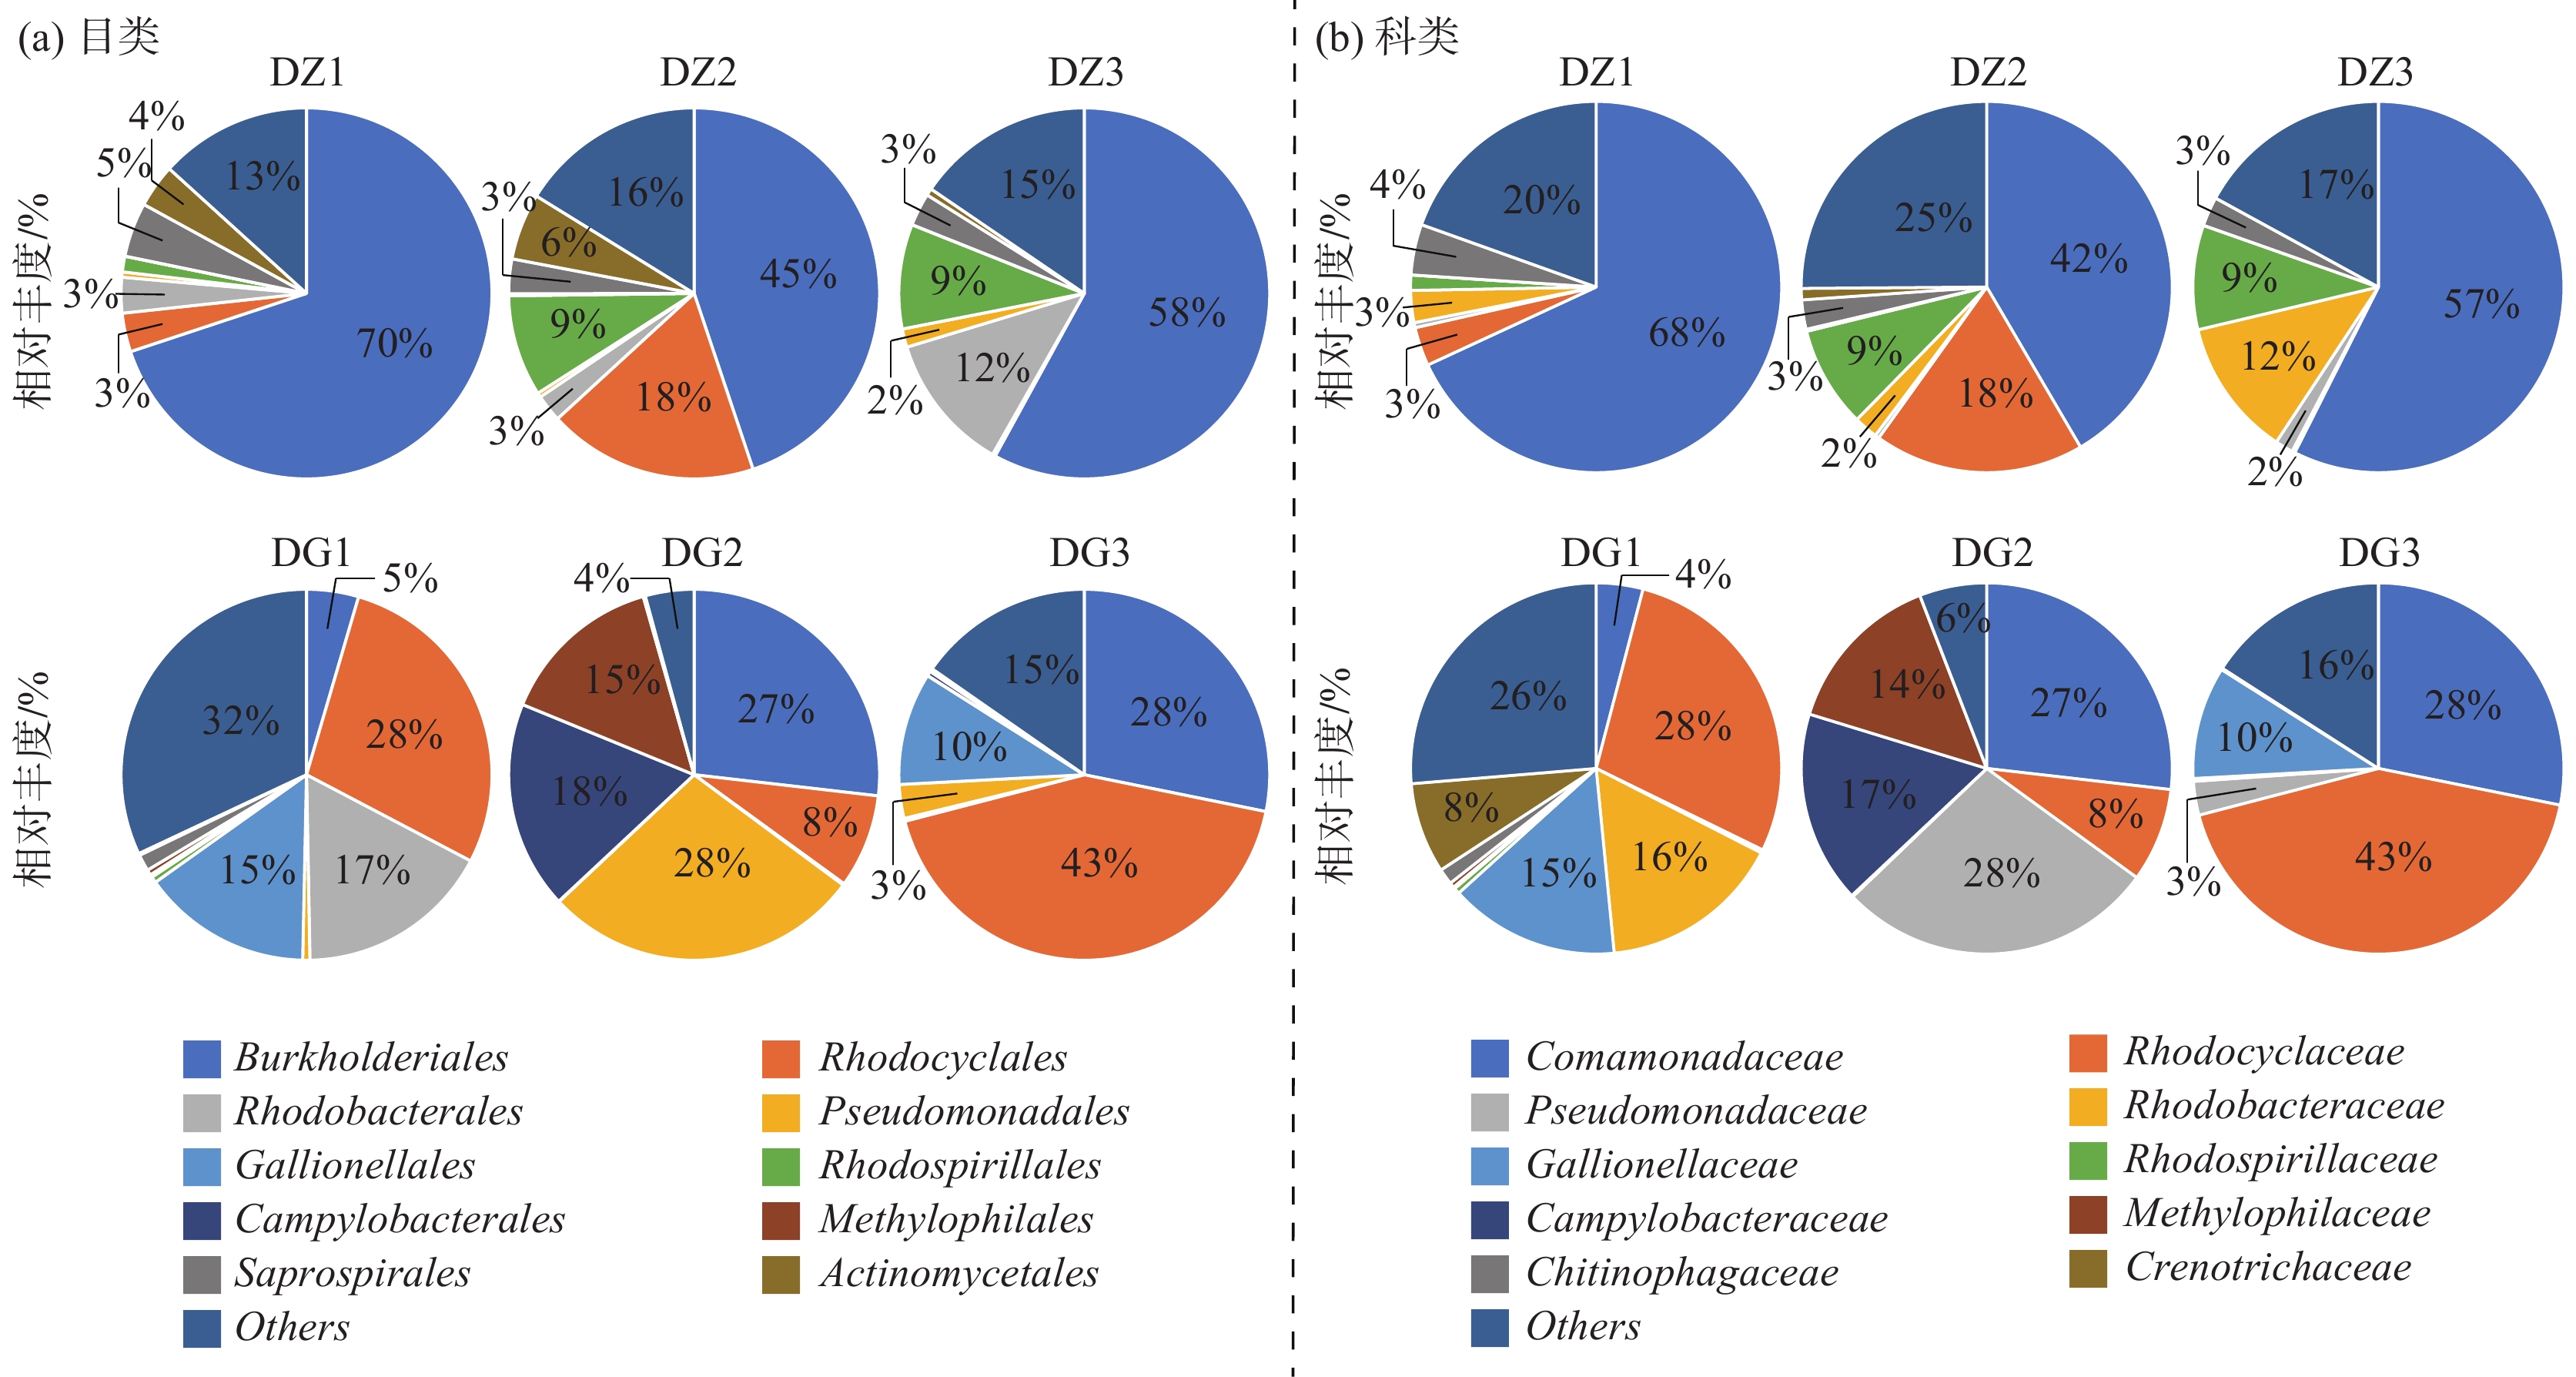
图 3 龙口与大沽河研究区样品优势菌群在门类水平的结构示意图以及变形菌门在纲类水平的结构示意图Figure 3. Pie charts representing relative abundance of the dominant bacterial communities from groundwater samples classified at the phylum level in Longkou and Dagu river study areas; Bar graphs representing relative abundance of the dominant bacterial communities from groundwater samples classified at the class level of Proteobacteria两个研究区地下水微生物群落在各自的目和科水平上结构特征相似。如图4所示,龙口研究区地下水微生物在目类水平上主要以伯克氏菌目(Burkholderiales)为主,在科水平上主要以丛毛单胞菌科(Comamonadaceae)为主。而大沽河研究区地下水微生物在两种水平上相对复杂,伯克氏菌目(Burkholderiales),红环菌目(Rhodocyclales),假单胞菌目(Pseudomonadales),红细菌目(Rhodobacterales),丛毛单胞菌科(Comamonadaceae),红环菌科(Rhodocyclaceae),假单胞菌科(Pseudomonadaceae),红细菌科(Rhodobacteraceae)都呈现出较高的相对丰度。
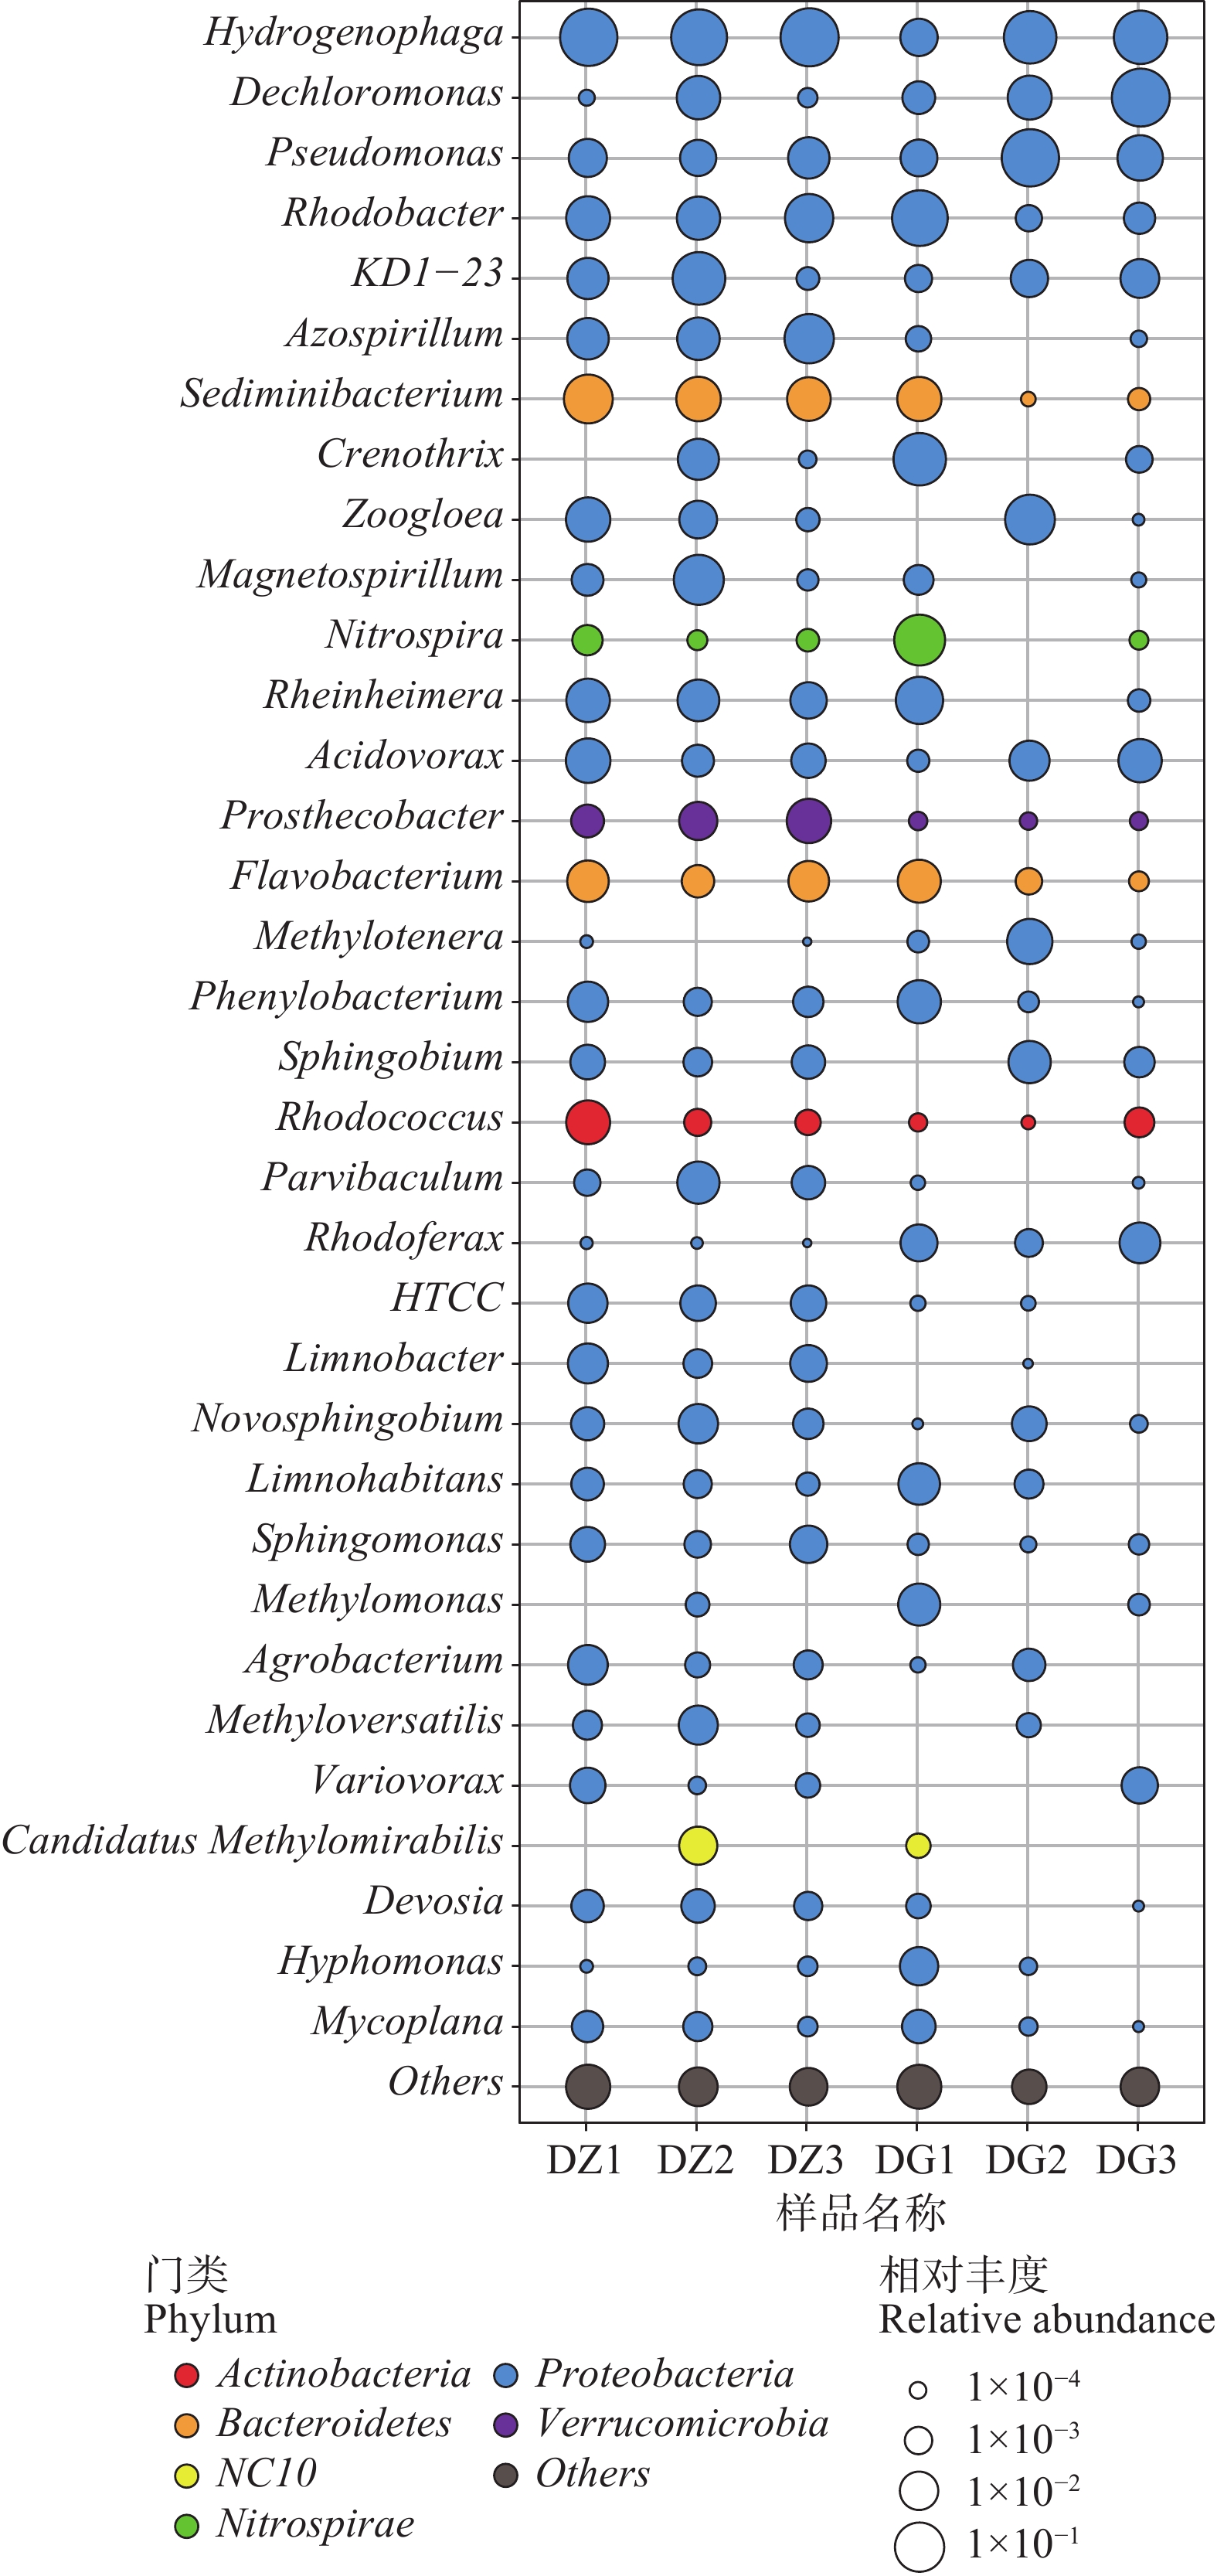
两个研究区地下水微生物群落在属水平上的特征如图5所示。可以发现在龙口研究区中,三口监测井存在相同的优势属:噬氢菌属(Hydrogenophaga)和沉积物杆状菌属(Sediminibacterium)。在大沽河研究区中三口监测井都存在各自的优势属,并且互不干扰。DG1存在4种优势属,包括:红杆菌属(Rhodobacter),泉发菌属(Crenothrix),硝化螺旋菌属(Nitrospira)和伦黑墨氏菌属(Rheinheimera)。DG2存在4个优势属,包括:绿脓杆菌属(Pseudomonas),噬氢菌属(Hydrogenophaga),菌胶团(Zoogloea)和Methylotenera菌属。DG3存在3个优势属,包括:Dechloromonas菌属,噬氢菌属(Hydrogenophaga)和绿脓杆菌属(Pseudomonas)。
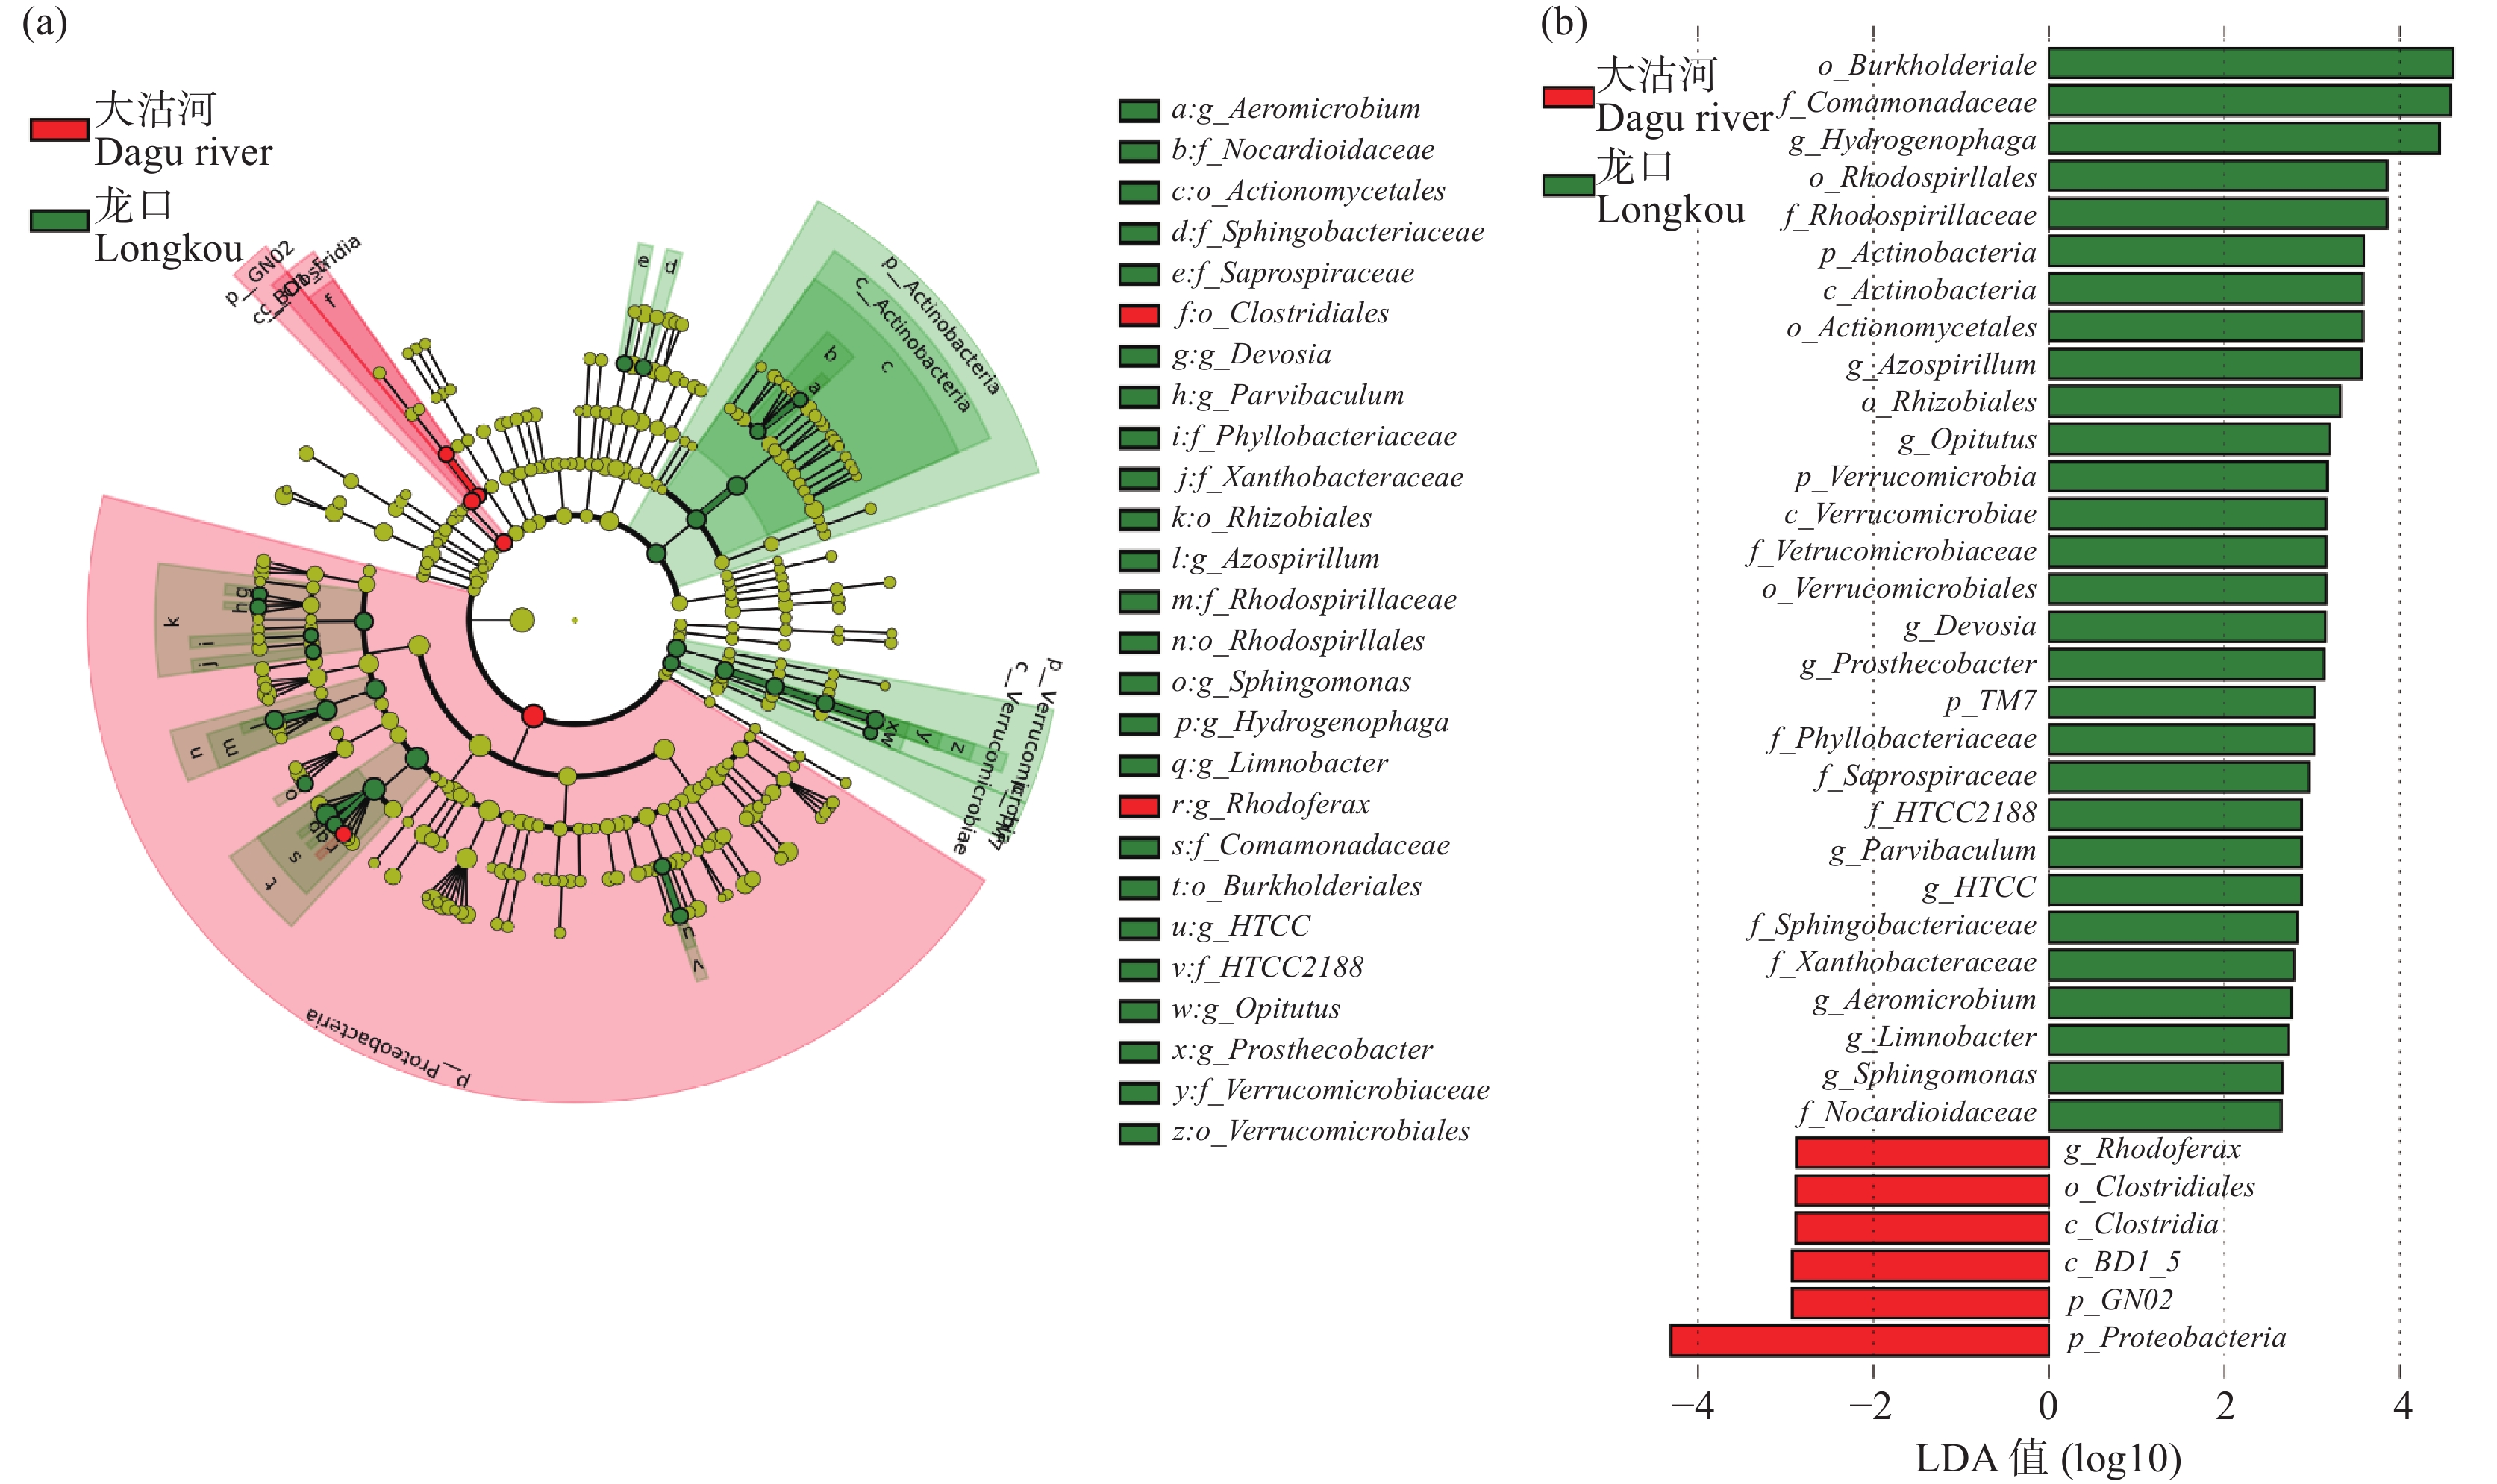
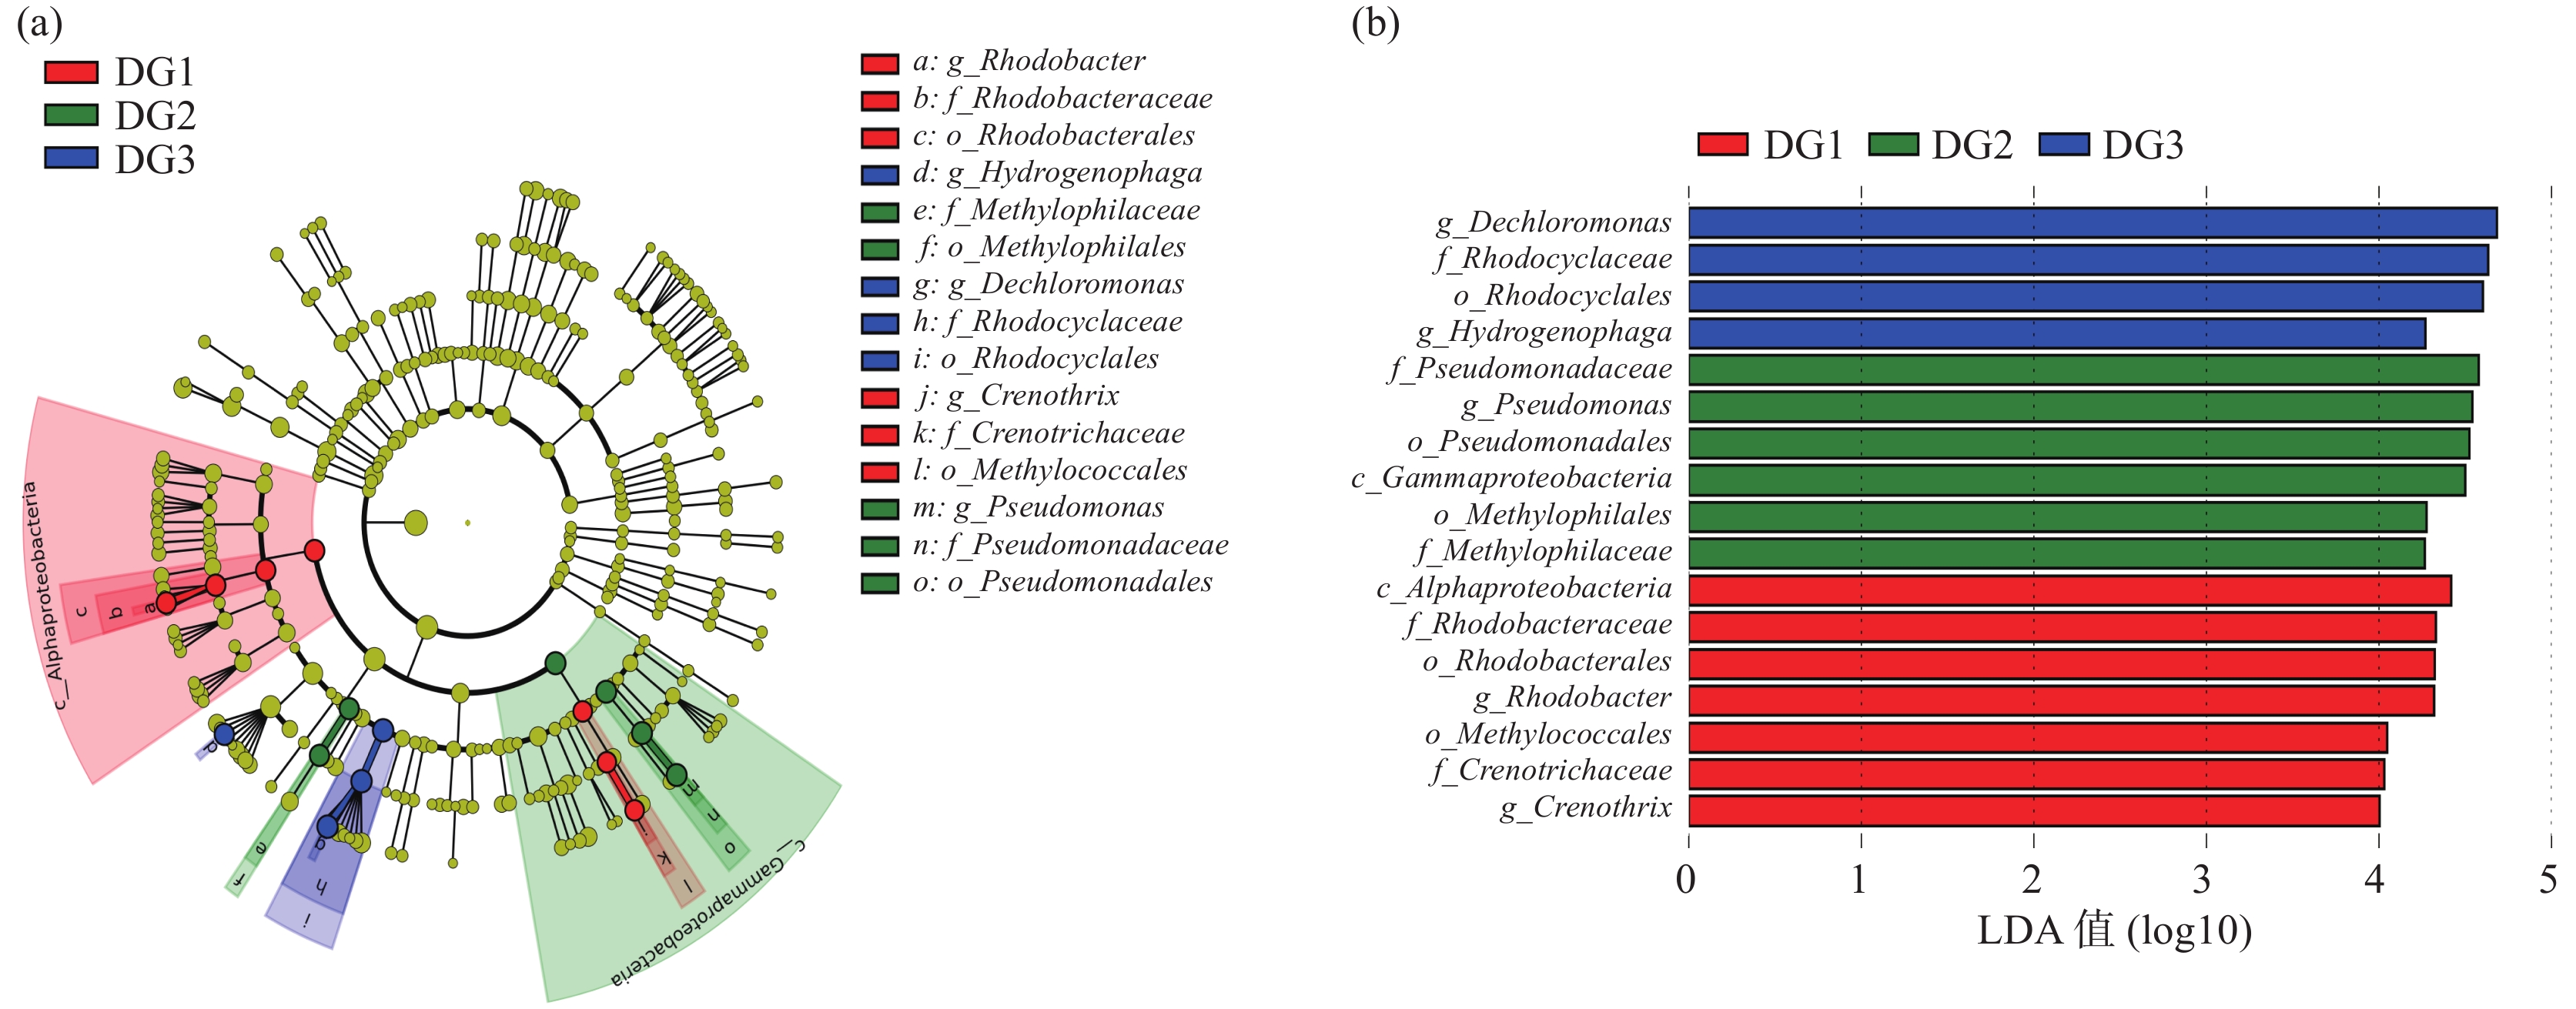
为进一步探究两个研究区中地下水微生物的丰度差异,采用线性判别分析法(LEfSe)来识别微生物类群,进而揭示其标志微生物(图6)。从图中可以看出,龙口研究区的标志微生物要明显多于大沽河研究区。在阈值2.5≤St<4.0时,龙口研究区标志微生物多达26种,而大沽河研究区仅有5种。在阈值St≥4.0时,龙口研究区标志微生物分别为伯克霍尔德氏菌目(Burkholderiales),丛毛单胞菌科(Comamonadaceae)和噬氢菌属(Hydrogenophaga),而大沽河研究区标志微生物仅为变形菌门(Proteobacteria)。这是由于大沽河研究区三个取样点的地下水微生物差异较大,所以进一步对大沽河样品进行线性判别分析。从图7可以看出,大沽河三口井在属类水平上的标志微生物不尽相同。分别为脱氯单胞菌属(Dechloromonas),假单胞菌属(Pseudomonas)和红细菌属(Rhodobacter)。
微生物群落结构特征也可以侧面揭示当地地下水水质状况。例如有研究表明,脱氯单胞菌属(Dechloromonas)、假单胞菌属(Pseudomonas)以及噬氢菌属(Hydrogenophaga)是自然界著名的反硝化细菌,它们的含量与硝酸盐浓度有关,在水环境中可以将硝酸盐转化为一氧化二氮和气态氮等不溶气体(Marcus et al., 2005;Yang et al., 2018;Ahn et al., 2019);变形菌门(Proteobacteria)具有硫酸盐的还原能力(刘新展等,2009)。
3.3 环境因子对微生物群落丰度的响应
环境因素是影响地下水微生物群落的重要指标(朱瑞杰等,2023)。通过对地下水微生物丰度和环境因子进行回归分析,讨论环境因子对微生物群落丰度值的响应。从表3可以看出,龙口和大沽河研究区的地下水微生物丰度与环境因子的相关性差异显著。相比于龙口研究区,大沽河研究区中地下水的大部分物化指标(除T、TOC和Ca2+)与微生物丰度显著相关,说明环境对当地地下水微生物影响较大。同时,Na+、Cl–、SO42–与微生物丰度呈显著负相关关系(P<0.01),表明随着海水入侵程度的增强,地下水微生物群落丰度降低。而龙口研究区物化指标与微生物丰度相关性较低,仅TOC和DO与微生物丰度呈正相关关系(P<0.05)。出现这种情况的原因与两个研究区海水入侵的程度和时间密不可分,有研究表明,咸淡水过渡区的低盐和中盐部分,可以在较短的时间和空间上让所处的环境不断变化(Sharp et al., 2009;Telesh and Khlebovich, 2010),而这种变化又会导致微生物不能及时适应新的环境,从而丰度较低(Gilbert et al., 2009)。
表 3 龙口和大沽河研究区地下水微生物丰度与环境因子回归分析Table 3. Regression analysis of microbial richness and environmental factors in Longkou and Dagu river study areas物化指标 龙口 大沽河 回归方程 R2 P 回归方程 R2 P GL y=−0.00654x+0.69245 0.079 0.463 y=7.91×10⁻⁶x²−0.0075x+1.126 0.658 < 0.05* T y=18.7x−0.0181 0.004 0.864 y=17.8x0.0118 0.044 0.589 pH y=0.00159x+6.6094 0.099 0.410 y=3.83×10⁻⁶x²−0.0037x+8.425 0.817 < 0.01** TOC y=3.98×10−5x1.72 0.530 < 0.05* y=−2.25×10⁻⁵x²+0.0203x−2.0486 0.256 0.411 EC y=−6.0932x+5080.9 0.097 0.415 y=−0.04561x²+32.549x−1479.7 0.908 < 0.01** TDS y=−3.1274x+2578.8 0.107 0.391 y=−0.03122x²+21.672x−597.56 0.905 < 0.01** ORP y=−0.00475x²+4.9775x−1286.9 0.097 0.415 y=0.00399x²−3.4867x−714.53 0.642 < 0.05* DO y=0.01107x−0.91302 0.507 < 0.05* y=0.00036x²−0.2680x+52.943 0.902 < 0.01** Cl– y=−2.0873x+1454.8 0.087 0.442 y=−3.5751x+2545.5 0.792 < 0.01** HCO3– y=−0.7111x+673.06 0.111 0.380 y=−0.00886x²+6.966x−650.11 0.835 < 0.01** NO3– y=0.86755x−276.62 0.102 0.401 y=−0.0009x²+0.811x−159.45 0.648 < 0.05* SO42– y=−0.4688x+395.58 0.224 0.198 y=−0.7276x+567.62 0.887 < 0.01** Ca2+ y=35468x−0.807 0.047 0.576 y=−0.00088x²+0.7918x−100.75 0.554 0.089 Na+ y=−0.3520x+306.59 0.053 0.550 y=−2.4546x+1671.8 0.949 < 0.01** Mg2+ y=−0.0731x+65.035 0.089 0.435 y=−0.00142x²+1.1802x−151 0.762 < 0.05* K+ y=5528x−1.2 0.164 0.280 y=−0.00044x²+0.3235x−9.36 0.847 < 0.01** 注:**表示显著相关(P<0.01);*表示相关(P<0.05)。 3.4 微生物群落功能基因特征
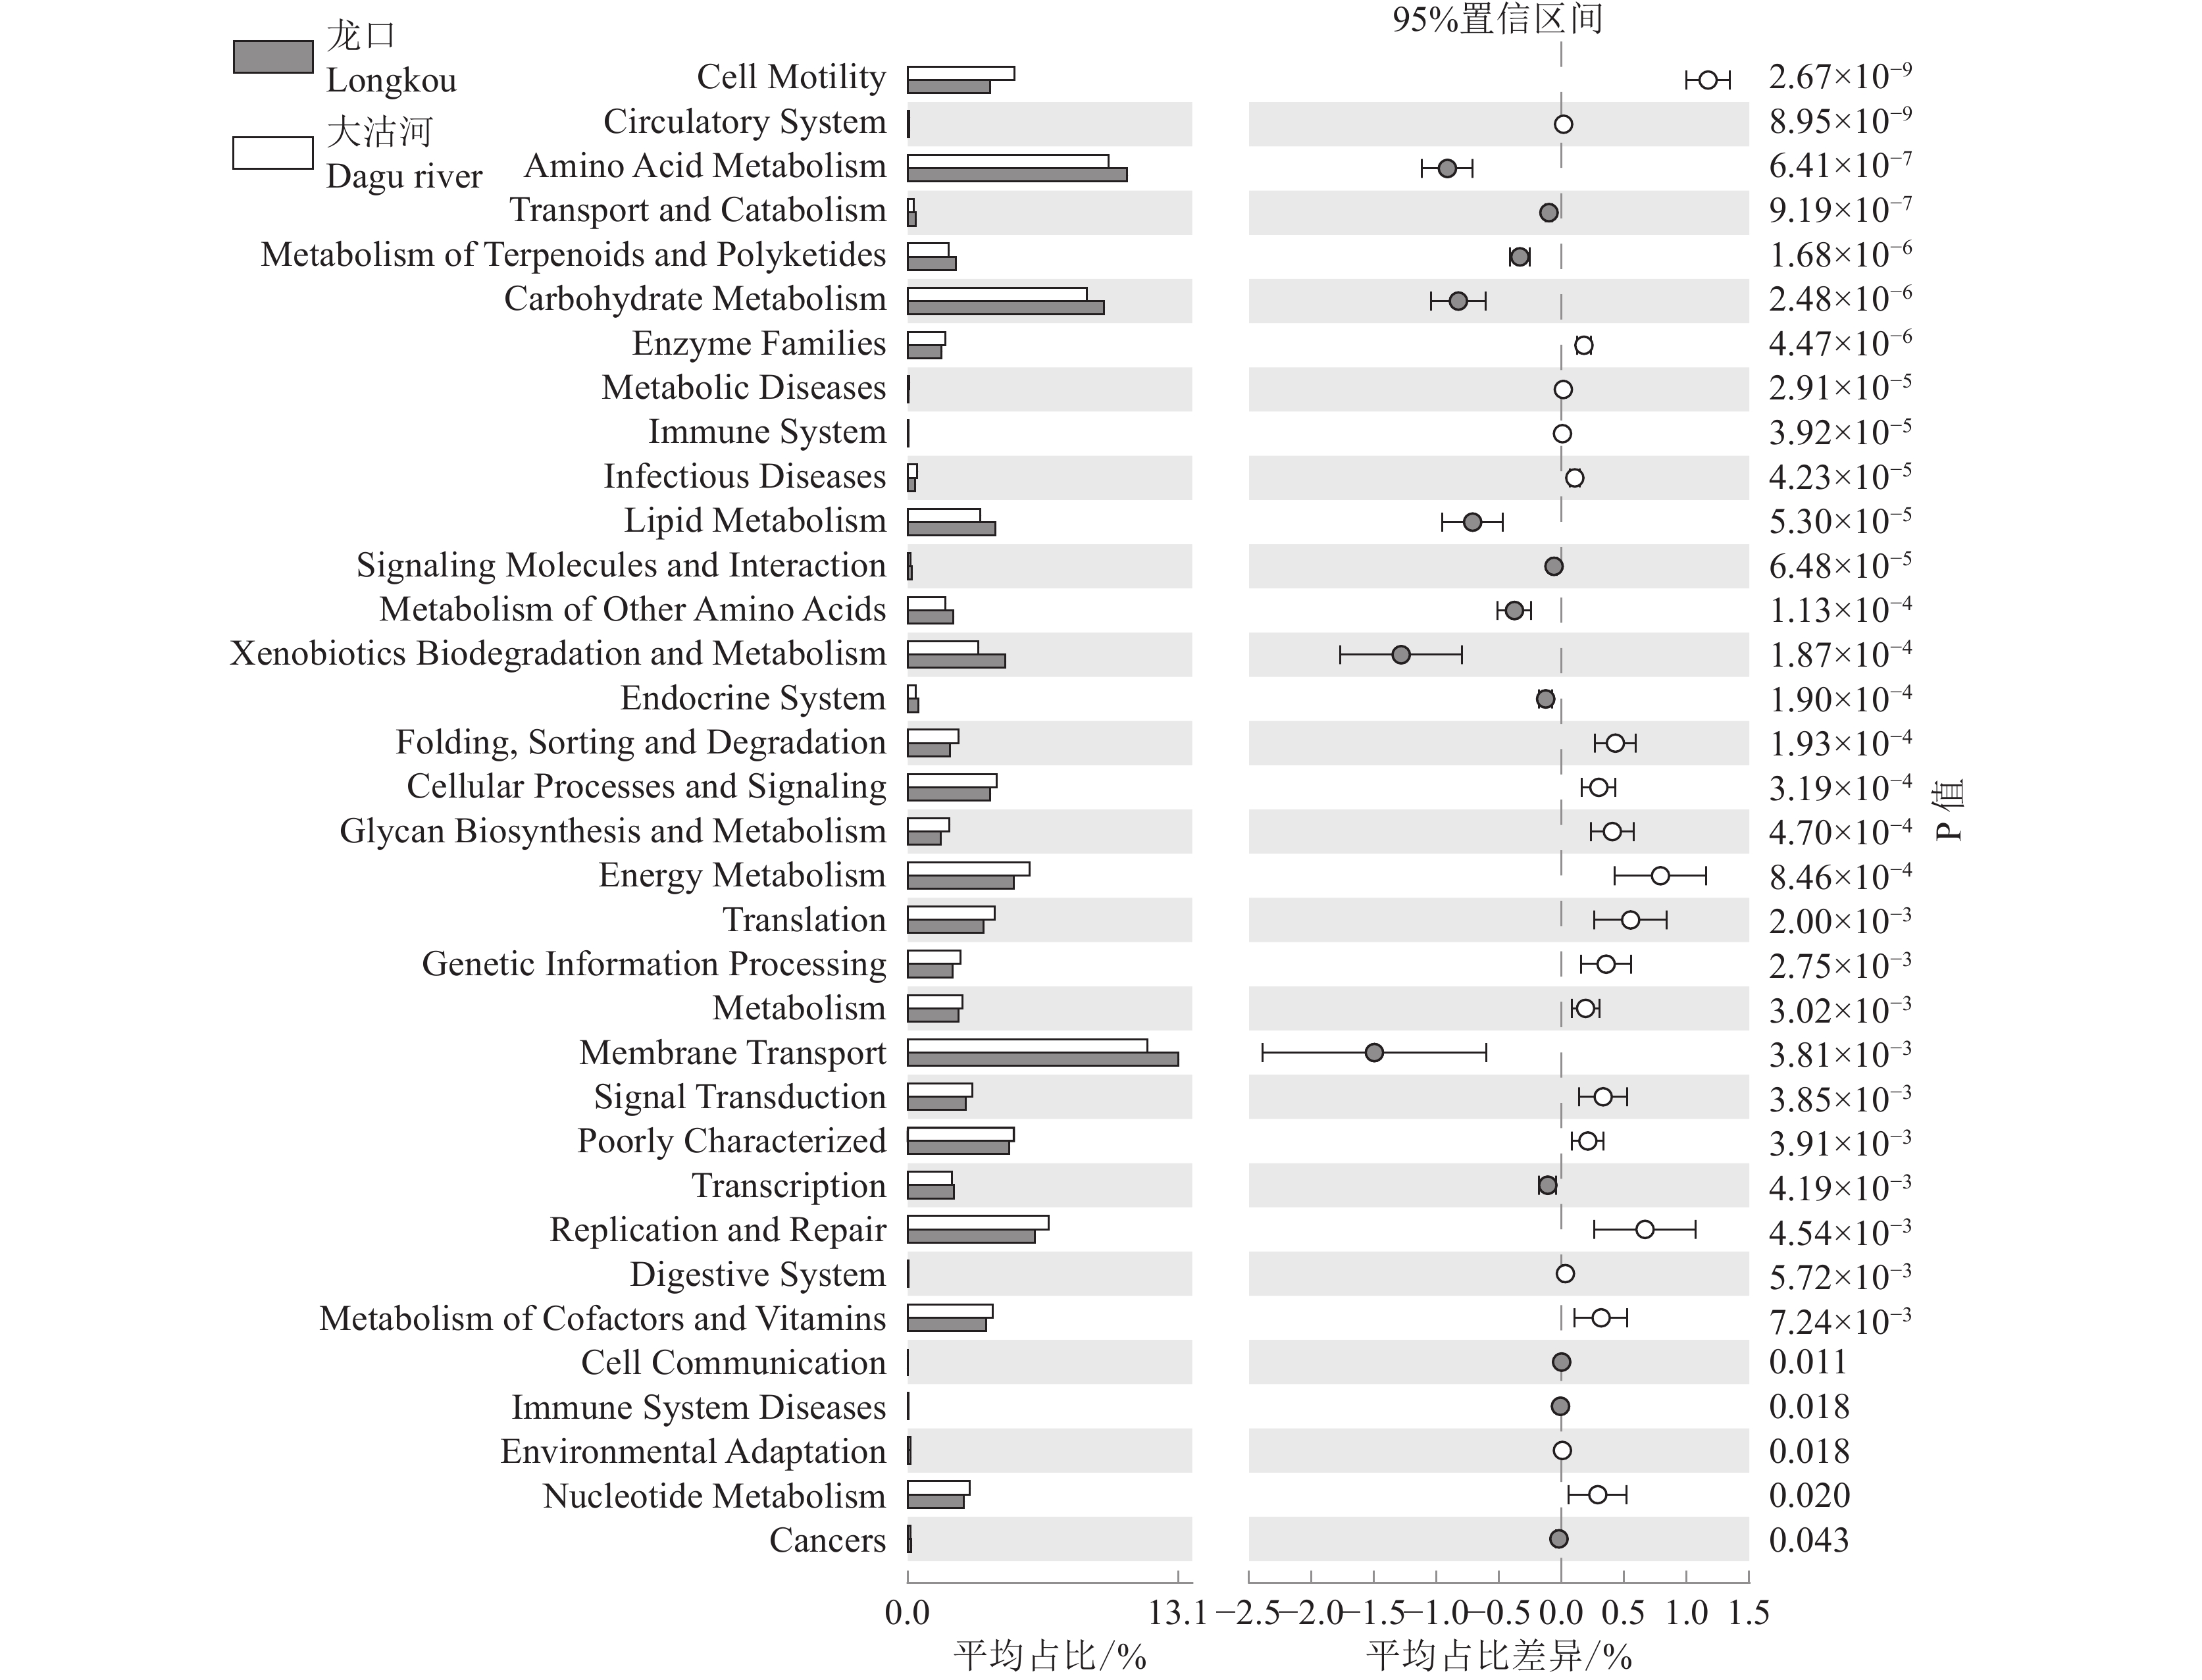
结合16S rDNA测序数据,利用PICRUSt对两个研究区的地下水微生物的功能进行预测,共包含7类一级功能基因和42个二级功能基因簇。对龙口以及大沽河研究区地下水微生物在二级功能基因进行对比分析发现,在总计的42个基因簇中,存在35个不同功能基因簇(图8)。相对于大沽河研究区,龙口研究区中显著富集了包括膜转运(Membrane Transport),生物降解和代谢作用(Xenobiotics Biodegradation and Metabolism),氨基酸代谢作用(Amino Acid Metabolism)等代谢通路,这有利于有机物和抗生素的去除(Qu et al., 2022)。相反,细胞运动(Cell Motility)、能量代谢作用(Energy Metabolism)、复制和修复(Replication and Repair)等在大沽河研究区富集较为明显。有研究表明,当污染程度不同时,地下水微生物的降解污染物和抗性基因等功能存在显著差异(Wang et al., 2018),侧面反映出两个研究区所处环境的区别。同时微生物的功能基因也会随着地理位置的变化呈现明显的不同(Yang et al., 2014),本次研究很好地证明了这一点。
4. 结 论
本研究通过对地下水物理化学指标以及微生物进行分析,对黄渤海不同海岸带中地下水水质与地下水微生物群落差异进行了表征,主要结论如下:
(1)大沽河研究区地下水受海水入侵的影响较为严重,由内陆向滨海地下水TDS由1.06 g/L增大为3.19 g/L,地下水以Na–Cl–HCO3和Na–Cl型为主;龙口研究区受海水入侵的影响相对较弱,由内陆向滨海地下水TDS由0.68 g/L增大为1.26 g/L,地下水以Ca–Na–Cl–HCO3型为主。
(2)两个研究区地下水微生物群落多样性、结构和功能特性差异显著,且存在不同的标志性微生物。其中龙口研究区的反硝化细菌高于大沽河研究区,而大沽河研究区中具有硫酸根离子还原能力的细菌高于龙口研究区。
(3)龙口研究区中物化指标与微生物群落丰度相关性不显著,仅TOC和DO对细菌丰度呈现正相关关系;而大沽河研究区中物化指标与微生物群落丰度相关性显著,其中Na+、Cl–、SO42–与细菌丰度呈显著负相关关系,表明其地下水微生物群落受海水入侵影响突出。
致谢: 感谢夏传安、孟详博、徐祖霖等在野外调查及室内实验中给予的帮助。感谢匿名专家及编辑在审稿过程中对本文提出的宝贵意见。
-
图 3 龙口与大沽河研究区样品优势菌群在门类水平的结构示意图以及变形菌门在纲类水平的结构示意图
Figure 3. Pie charts representing relative abundance of the dominant bacterial communities from groundwater samples classified at the phylum level in Longkou and Dagu river study areas; Bar graphs representing relative abundance of the dominant bacterial communities from groundwater samples classified at the class level of Proteobacteria
表 1 龙口和大沽河研究区地下水样品物化指标
Table 1 Physico–chemical parameters of groundwater samples of Longkou and Dagu river study areas
物化指标 龙口 大沽河 DZ1 DZ2 DZ3 DG1 DG2 DG3 GL/m –3.31 –2.91 –1.89 –0.52 –0.40 –0.69 T/℃ 16.51 17.08 16.60 18.97 18.74 19.50 pH 7.62 7.30 7.35 7.61 7.68 7.54 TOC/(mg/L) 1.70 1.80 1.70 1.80 2.50 2.80 EC/(mS/cm) 1.37 1.82 2.52 1.45 4.13 4.40 TDS/(g/L) 0.68 0.91 1.26 1.06 3.05 3.19 ORP/mV 13.00 21.00 6.00 72.00 49.00 –59.00 DO/(mg/L) 5.28 4.38 4.40 6.28 6.05 2.10 Cl–/(mg/L) 173.08 311.79 604.26 279.15 1314.62 1408.37 HCO3–/(mg/L) 246.01 289.27 376.42 311.71 616.20 787.62 NO3–/(mg/L) 286.01 98.34 153.07 1.08 1.14 32.73 SO42–/(mg/L) 114.09 178.80 167.22 135.74 299.03 269.80 Ca2+/(mg/L) 198.20 208.62 284.48 52.02 50.43 75.18 Na+/(mg/L) 81.00 106.37 174.50 188.03 886.81 676.60 Mg2+/(mg/L) 22.00 26.74 34.90 40.07 67.59 91.07 K+/(mg/L) 2.10 3.08 3.24 23.40 48.04 45.84 注:GL—潜水地下水位;TOC—总有机碳;EC—电导率;TDS—总溶解固体;ORP—氧化还原电位;DO—溶解氧。 表 2 龙口与大沽河研究区地下水样品的微生物群落Alpha多样性指标
Table 2 Microbial community Alpha diversity indices for the groundwater samples of Longkou and Dagu river study areas
多样性指标 龙口 大沽河 DZ1 DZ2 DZ3 DG1 DG2 DG3 Shannon 4.49 4.75 3.46 4.54 4.48 4.20 Chao1 706 573 701 728 338 572 Observed species 239 200 179 218 131 190 PD 17.0 17.0 14.2 20.6 9.4 15.9 表 3 龙口和大沽河研究区地下水微生物丰度与环境因子回归分析
Table 3 Regression analysis of microbial richness and environmental factors in Longkou and Dagu river study areas
物化指标 龙口 大沽河 回归方程 R2 P 回归方程 R2 P GL y=−0.00654x+0.69245 0.079 0.463 y=7.91×10⁻⁶x²−0.0075x+1.126 0.658 < 0.05* T y=18.7x−0.0181 0.004 0.864 y=17.8x0.0118 0.044 0.589 pH y=0.00159x+6.6094 0.099 0.410 y=3.83×10⁻⁶x²−0.0037x+8.425 0.817 < 0.01** TOC y=3.98×10−5x1.72 0.530 < 0.05* y=−2.25×10⁻⁵x²+0.0203x−2.0486 0.256 0.411 EC y=−6.0932x+5080.9 0.097 0.415 y=−0.04561x²+32.549x−1479.7 0.908 < 0.01** TDS y=−3.1274x+2578.8 0.107 0.391 y=−0.03122x²+21.672x−597.56 0.905 < 0.01** ORP y=−0.00475x²+4.9775x−1286.9 0.097 0.415 y=0.00399x²−3.4867x−714.53 0.642 < 0.05* DO y=0.01107x−0.91302 0.507 < 0.05* y=0.00036x²−0.2680x+52.943 0.902 < 0.01** Cl– y=−2.0873x+1454.8 0.087 0.442 y=−3.5751x+2545.5 0.792 < 0.01** HCO3– y=−0.7111x+673.06 0.111 0.380 y=−0.00886x²+6.966x−650.11 0.835 < 0.01** NO3– y=0.86755x−276.62 0.102 0.401 y=−0.0009x²+0.811x−159.45 0.648 < 0.05* SO42– y=−0.4688x+395.58 0.224 0.198 y=−0.7276x+567.62 0.887 < 0.01** Ca2+ y=35468x−0.807 0.047 0.576 y=−0.00088x²+0.7918x−100.75 0.554 0.089 Na+ y=−0.3520x+306.59 0.053 0.550 y=−2.4546x+1671.8 0.949 < 0.01** Mg2+ y=−0.0731x+65.035 0.089 0.435 y=−0.00142x²+1.1802x−151 0.762 < 0.05* K+ y=5528x−1.2 0.164 0.280 y=−0.00044x²+0.3235x−9.36 0.847 < 0.01** 注:**表示显著相关(P<0.01);*表示相关(P<0.05)。 -
[1] Ahn J, Kim W S, Park J B, Francis A J, Um W. 2019. Temporal changes of geochemistry and microbial community in low and intermediate level waste (LILW) repository, South Korea[J]. Annals of Nuclear Energy, 128: 309−317. doi: 10.1016/j.anucene.2019.01.029
[2] Chen L, Hu Bill X, Dai H, Zhang X Y, Xia C A, Zhang J. 2019. Characterizing microbial diversity and community composition of groundwater in a salt–freshwater transition zone[J]. Science of the Total Environment, 678: 574−584. doi: 10.1016/j.scitotenv.2019.05.017
[3] Chen L, Zhang J, Dai H, Hu Bill X, Tong J X, Gui D W, Zhang X Y, Xia C A. 2020. Comparison of the groundwater microbial community in a salt–freshwater mixing zone during the dry and wet seasons[J]. Journal of Environmental Management, 271: 110969. doi: 10.1016/j.jenvman.2020.110969
[4] Gai X, Li S C, Zhang X P, Bian F Y, Yang C B, Zhong Z K. 2021. Changes in soil phosphorus availability and associated microbial properties after chicken farming in Lei bamboo (Phyllostachys praecox) forest ecosystems[J]. Land Degradation & Development, 32(10): 3008−3022.
[5] Gao M S, Guo F, Huang X Y, Hou G H. 2019. Sediment distribution and provenance since Late Pleistocene in Laizhou Bay, Bohai Sea, China[J]. China Geology, 2(1): 16−25. doi: 10.31035/cg2018062
[6] Gilbert J A, Field D, Swift P, Newbold L, Oliver A, Smyth T, Somerfield P J, Huse S, Joint I. 2009. The seasonal structure of microbial communities in the Western English Channel[J]. Environmental Microbiology, 11(12): 3132−3139. doi: 10.1111/j.1462-2920.2009.02017.x
[7] He L Y, He L K, Liu Y S, Zhang M, Zhao J L, Zhang Q Q, Ying G G. 2019. Microbial diversity and antibiotic resistome in swine farm environments[J]. Science of the Total Environment, 685: 197−207. doi: 10.1016/j.scitotenv.2019.05.369
[8] Huang Yi, Huang Muke, Chai Liwei, Zhao Yanran. 2018. Drivers of the spatial patterns of soil microbial communities in aridand semi–arid regions[J]. Ecology and Environmental Sciences, 27(1): 191−198 (in Chinese with English abstract).
[9] Li Xuanyu. 2020. Forecast of influence of future climate change on degree of seawater intrusion in Dandong City[J]. Heilongjiang Hydraulic Science and Technology, 48(10): 59−64 (in Chinese with English abstract).
[10] Liu K, Jiao J J, Gu J D. 2014. Investigation on bacterial community and diversity in the multilayer aquifer–aquitard system of the Pearl River Delta, China[J]. Ecotoxicology, 23(10): 2041−2052. doi: 10.1007/s10646-014-1311-x
[11] Liu Xinzhan, He Jizheng, Zhang Limei. 2009. The sulfate–reducing bacteria and surfer cycle in paddy soil[J]. Acta Ecologica Sinica, 29(8): 4455−4463 (in Chinese with English abstract).
[12] Lozupone C A, Knight R. 2008. Species divergence and the measurement of microbial diversity[J]. Fems Microbiology Reviews, 32(4): 557−578. doi: 10.1111/j.1574-6976.2008.00111.x
[13] Lu Dan, Lei Jing, Wei YanYan, Shen Fangke, Huang Yanfei, Gu Minghua. 2015. Effect of microbial community and diversity index of paddy soil under short no–tillage and ridge tillage[J]. Southwest China Journal of Agricultural Sciences, 28(4): 1670−1674 (in Chinese with English abstract).
[14] Marcus A H, Julian I, Carola M, Andreas S, Georg A, Harold L D. 2005. Dechloromonas denitrificans sp. nov., Flavobacterium denitrificans sp. nov., Paenibacillus anaericanus sp. nov. and Paenibacillus terrae strain MH72, N2O–producing bacteria isolated from the gut of the earthworm Aporrectodea caliginosa[J]. International Journal of Systematic and Evolutionary Microbiology, 55: 1255–1265.
[15] Qu M W, Liu Y, Hao M Q, Wang M T, Chen R, Wang X C C, Zheng Y C, Dzakpasu M. 2022. Microbial community and carbon–nitrogen metabolism pathways in integrated vertical flow constructed wetlands treating wastewater containing antibiotics[J]. Bioresource Technology, 354: 127217. doi: 10.1016/j.biortech.2022.127217
[16] Rocca J D, Simonin M, Bernhardt E S, Washburne A D, Wright J P, Ecology J. 2019. Rare microbial taxa emerge when communities collide: freshwater and marine microbiome responses to experimental mixing[J]. Ecology, 101(3): e02956.
[17] Sharp J H, Yoshiyama K, Parker A E, Schwartz M C, Curless S E, Beauregard A Y, OssolinskiJ E, Davis A R. 2009. A biogeochemical view of estuarine eutrophication: Seasonal and spatial trends and correlations in the Delaware Estuary[J]. Estuaries & Coasts, 32(6): 1023−1043.
[18] Shen L J, Nuchit S. 2020. The characteristics, formation and exploration progress of the potash deposits on the Khorat Plateau, Thailand and Laos, Southeast Asia[J]. China Geology, 3(1): 67−82. doi: 10.31035/cg2020009
[19] Shi W L, Lu C H, Werner A D. 2020. Assessment of the impact of sea–level rise on seawater intrusion in sloping confined coastal aquifers[J]. Journal of Hydrology, 586: 124872. doi: 10.1016/j.jhydrol.2020.124872
[20] Sun Jinhua, Wu Yongxiang, Lin Jing, Zhong Huaping, Li Wei, Han Jiangbo, Li Daiyuan. 2021. Seawater intrusion prevention and groundwater management and study in the coastal area of the Yellow Sea and the Bohai Sea[J]. China Water Resources, 7: 20−23 (in Chinese with English abstract).
[21] Telesh I V, Khlebovich V V. 2010. Principal processes within the estuarine salinity gradient: A review[J]. Marine Pollution Bulletin, 61(4−6): 149−155. doi: 10.1016/j.marpolbul.2010.02.008
[22] Unno T, Kim J, Kim Y, Nguyen S, Guevarra R B, Kim G P, Lee J H, Sadowsky M J. 2015. Influence of seawater intrusion on microbial communities in groundwater[J]. Science of the Total Environment, 532: 337−343. doi: 10.1016/j.scitotenv.2015.05.111
[23] Valenzuela–Madrigal I E, Valenzuela–Quinonez W, Esparza–Leal H M, Rodriguez–Quiroz G, Aragon–Noriega E A. 2017. Effects of ionic composition on growth and survival of white shrimp Litopenaeus vannamei culture at low–salinity well water[J]. Revista de Biologia Marina y Oceanografia, 52(1): 103−112. doi: 10.4067/S0718-19572017000100008
[24] Wang Hui, Xu Xuegong. 2016. Evaluation of carrying capacity of water resources under the pressure of seawater intrusion in Laizhou, Shandong Province[J]. China Rural Water and Hydropower, 6: 43−46, 50 (in Chinese with English abstract).
[25] Wang L, Zhang J, Li H L, Yang H, Peng C, Peng Z S, Lu L. 2018. Shift in the microbial community composition of surface water and sediment along an urban river[J]. Science of the Total Environment, 627: 600−612. doi: 10.1016/j.scitotenv.2018.01.203
[26] Wang Yanxin, Gan Yiqun, Deng Yamin, Xie Xianjun. 2020. Land–ocean interactions and their eco–environmental effects in the coastal zone: Current progress and future perspectives[J]. Bulletin of Geological Science and Technology, 39(1): 1−10 (in Chinese with English abstract).
[27] Wook C B, Dae L B, Yun U, Clm H C. 2003. Study on the possibility of seawater intrusion in the Ulsan Area using Br : Cl weight ratios of groundwater[J]. Economic and Environmental Geology, 36(5): 339–347.
[28] Wu Jichun, Xue Yuqun, Xie Chunhong, Zhang Zhihui. 1996. Cations exchange between water and soilin the process of seawater intrusion[J]. Hydrogeology & Engineering Geology, (3): 18−19 (in Chinese with English abstract).
[29] Wu Jichun, Wu Yongxiang, Lin Jin, Han Jiangbo. 2018. Study on the groundwater management and seawater intrusion prevention in the coastal areas of the Bohai Sea and the Yellow Sea[J]. Chinese Journal of Environmental Management, 10(2): 91−92 (in Chinese with English abstract).
[30] Xia Jun, Li Miao, Li Fulin, Liu Jian, Meng Dejuan. 2013. Effects of sea level rise on seawater intrusion in coastal areas of Shandong Province[J]. Yellow River, 35(9): 1−3 (in Chinese with English abstract).
[31] Xiong Guiyao, Fu Tengfei, Han Jiangbo, Chen Guangquan, Xu Xingyong, Xu Xiuli, Liu Guanqun, Liu Wenquan. 2019. Hydrogeochemical and isotopic characteristics of groundwater in Dagu River Basin[J]. Advances in Marine Science, 37(4): 626−637 (in Chinese with English abstract).
[32] Yang H, Li D, Zeng H P, Zhang J. 2018. Autotrophic nitrogen conversion process and microbial population distribution in biofilter that simultaneously removes Fe, Mn and ammonia from groundwater[J]. International Biodeterioration & Biodegradation, 135: 53−61.
[33] Yang Y F, Gao Y, Wang S P, Xu D P, Yu H, Wu L W, Lin Q Y, Hu Y G, Li X Z, He Z L, Deng Y, Zhou J Z. 2014. The microbial gene diversity along an elevation gradient of the Tibetan grassland[J]. The ISME Journal, 8(2): 430−440. doi: 10.1038/ismej.2013.146
[34] Yu J B, Zhou D, Yu M, Yang J S, Li Y Z, Guan B, Wang X H, Zhan C, Wang Z K, Qu F Z. 2021. Environmental threats induced heavy ecological burdens on the coastal zone of the Bohai Sea, China[J]. Science of the Total Environment, 765: 142694. doi: 10.1016/j.scitotenv.2020.142694
[35] Zhang Ni, Chen Kelong, Wang Hengsheng, Yang Yang. 2022. Changes of microbial community characteristics in freezing–thaw degradation of alpine wetland[J]. Ecological Science, 41(2): 20−28 (in Chinese with English abstract).
[36] Zhao Jie, Lin Jin, Wu Jianfeng, Wu Jichun. 2020. Prediction of the impact of future climate change on the extent of seawater intrusion in Zhoushuizi district of Dalian City in northern China[J]. Hydrogeology & Engineering Geology, 47(3): 17−24 (in Chinese with English abstract).
[37] Zhu Ruijie, Zhou Xuejun, Zhan Tao, Ma Yongfa, Wang Xu, Dong Junling, Liu Ling, Yang Fengtian, Li Dong, Shi Yujia, Su Yujuan. 2023. Analysis of microbial diversity and community structure in thermal watersfrom Lindian geothermal field, Heilongjiang Province[J]. Geology in China, 50(6): 1667−1677 (in Chinese with English abstract).
[38] 黄艺, 黄木柯, 柴立伟, 赵嫣然. 2018. 干旱半干旱区土壤微生物空间分布格局的成因[J]. 生态环境学报, 27(1): 191−198. [39] 李选彧. 2020. 未来气候变化对丹东市海水入侵程度的影响预测[J]. 黑龙江水利科技, 48(10): 59−64. doi: 10.3969/j.issn.1007-7596.2020.10.017 [40] 刘新展, 贺纪正, 张丽梅. 2009. 水稻土中硫酸盐还原微生物研究进展[J]. 生态学报, 29(8): 4455−4463. doi: 10.3321/j.issn:1000-0933.2009.08.053 [41] 路丹, 雷静, 韦燕燕, 沈方科, 黄雁飞, 顾明华. 2015. 短期免耕和垄作对稻田土壤微生物群落及多样性指数的影响[J]. 西南农业学报, 28(4): 1670−1674. [42] 孙金华, 吴永祥, 林锦, 钟华平, 李伟, 韩江波, 李岱远. 2021. 黄渤海沿海地区海水入侵防治与地下水管理研究[J]. 中国水利, 7: 20−23. doi: 10.3969/j.issn.1000-1123.2021.07.012 [43] 王辉, 许学工. 2016. 海水入侵胁迫下的莱州市水资源承载力评价[J]. 中国农村水利水电, 6: 43−46, 50. doi: 10.3969/j.issn.1007-2284.2016.03.011 [44] 王焰新, 甘义群, 邓娅敏, 谢先军. 2020. 海岸带海陆交互作用过程及其生态环境效应研究进展[J]. 地质科技通报, 39(1): 1−10. [45] 吴吉春, 吴永祥, 林锦, 韩江波. 2018. 黄渤海沿海地区地下水管理与海水入侵防治研究[J]. 中国环境管理, 10(2): 91−92. doi: 10.3969/j.issn.1674-6252.2018.02.017 [46] 吴吉春, 薛禹群, 谢春红, 张志辉. 1996. 海水入侵过程中水−岩间的阳离子交换[J]. 水文地质工程地质, (3): 18−19. [47] 夏军, 李淼, 李福林, 刘健, 孟德娟. 2013. 海平面上升对山东省滨海地区海水入侵的影响[J]. 人民黄河, 35(9): 1−3. doi: 10.3969/j.issn.1000-1379.2013.09.001 [48] 熊贵耀, 付腾飞, 韩江波, 陈广泉, 徐兴永, 徐秀丽, 刘贯群, 刘文全. 2019. 大沽河流域地下水水化学及同位素特征[J]. 海洋科学进展, 37(4): 626−637. [49] 章妮, 陈克龙, 王恒生, 杨阳. 2022. 高寒湿地冻融退化下微生物群落特征变化[J]. 生态科学, 41(2): 20−28. [50] 赵洁, 林锦, 吴剑锋, 吴吉春. 2020. 未来气候变化对大连周水子地区海水入侵程度的影响预测[J]. 水文地质工程地质, 47(3): 17−24. [51] 朱瑞杰, 周学军, 詹涛, 马永法, 王旭, 董俊领, 刘玲, 杨峰田, 李栋, 石宇佳, 苏玉娟. 2023. 黑龙江林甸地热田热水微生物多样性与群落结构分析[J]. 中国地质, 50(6): 1667−1677. doi: 10.12029/gc20210602003 -
期刊类型引用(4)
1. 陈宏帆,支传顺,胡晓农,黄宪瑞,陈耿. 海(咸)水入侵对莱州湾南岸含水层微生物群落结构的影响. 济南大学学报(自然科学版). 2025(01): 38-45+62 .  百度学术
百度学术
2. 王卓群,陈扣平,吴吉春,王保战,柳旭. 太湖周边地下水中高硝酸盐负荷促进反硝化功能菌群富集. 中国环境科学. 2025(01): 477-486 .  百度学术
百度学术
3. 邹一飞,许明家,丁爱中,金乃夫,杨凯,杨庆,朱宜,郑蕾,金喜来. 地下水生态系统健康评价研究进展. 环境科学研究. 2024(11): 2341-2351 .  百度学术
百度学术
4. 王宁,白雨冰,樊宇. 我国数字化与低碳化的协同发展分析. 环境科学研究. 2024(12): 2599-2609 .  百度学术
百度学术
其他类型引用(1)


 下载:
下载:
