Extraction of mineral alteration information and mineralization prospecting analysis based on GF−5 hyperspectral in Zhule−Mangla, Tibet
-
摘要:研究目的
近年来,遥感在地质调查和矿产勘查领域取得了广泛的应用,基于多光谱遥感数据的蚀变矿物填图为地质找矿工作提供了重要技术支撑,然而基于国产高光谱遥感数据在此领域的研究却为数不多。高分五号(GF−5)较小的波谱间隔提供了相比于多光谱更为丰富的目标地物波谱信息,为矿物的精细识别提供了良好的数据源。本文主要基于GF−5开展西藏革吉南地区的矿物蚀变信息提取,同时结合Landsat−8、ASTER多光谱数据提取结果叠加对比,综合野外调查验证,进一步深化遥感在地质矿产资源调查领域的应用。
研究方法基于多光谱数据建立了不同类别蚀变矿物的光谱指数模型,在GF−5数据蚀变信息提取方面,摒弃了传统的光谱角匹配等方法,提出了基于决策树分类辅助混合调谐匹配滤波技术进行矿化蚀变信息的提取方法,最后综合区域构造、蚀变信息提取结果等要素,圈定成矿有利区,并开展野外调查验证。
研究结果基于Landsat−8、ASTER两种多光谱数据对铁染、羟基类(Mg−OH、Al−OH)、碳酸盐类矿物信息进行了增强与提取;基于GF−5数据识别出了方解石、钠云母、普通白云母、多硅白云母、明矾石、高岭石、地开石、绿帘石8种蚀变矿物。
结论结合不同数据源的提取与叠加结果,证实了本文提出的矿化蚀变信息提取方法的可行性。根据野外验证情况综合揭示了该地区发育高硫型浅成低温热液蚀变矿物组合,具有斑岩−浅成低温热液矿床的成矿潜力。本文认为高光谱与多光谱数据相结合有助于后续蚀变分带的分析与更精确的成矿预测,从而更好地服务于矿产勘查工程等领域。
创新点:(1)构建了多光谱数据蚀变信息增强指数;(2)基于空间域统计代替频率域滤波去除高光谱条带,并基于决策树分类辅助混合调谐匹配滤波技术进行矿化蚀变信息提取。
Abstract:This paper is the result of mineral exploration engineering.
ObjectiveRemote sensing has been widely used in geological survey and mineral exploration in recent years. Alteration mineral mapping using multispectral remote sensing data provides important technical support for geological prospecting. However, only a limited number of surveys were carried out based on the Chinese hyperspectral remote sensing data. The smaller spectral interval of the GaoFen−5 (GF−5) hyperspectral remote sensing data provides a richer spectral information of geological targets than multispectral data, which offers an ideal data source for mineral identification. This paper was mainly focusing on the extraction of alteration minerals based on GF−5 data in the south of Geji, Tibet. Moreover, the alteration minerals extracted from GF−5 were overlaid and compared with the results extracted from Landsat−8 and ASTER data. The results were verified by field survey, which could deepen the application of remote sensing in mineral resources investigation.
MethodsA spectral index model for different alteration minerals was proposed based on the multispectral data. During the extraction of alteration information from GF−5 data, traditional methods such as spectral angle mapper were abandoned, while the decision tree algorithm was adopted to support mixture tuned matched filter for the extraction of mineralized alteration information. Finally, regional structure, alteration information and other factors were integrated to delineate mineralization anomalous targets. The field investigation was carried out to verify the technical reliability.
ResultsThe information of iron−stained, hydroxyl (Mg−OH, Al−OH) and carbonate minerals was enhanced and extracted using Landsat−8 and ASTER. Eight alteration minerals including calcite, paragonite, muscovite, phengite, alunite, kaolinite, dickite and chlorite were identified by GF−5.
ConclusionsCombined with the extraction and superimposition results from different data sources, the reliability of the mineralization alteration information extraction method proposed in this paper was confirmed. The field investigation results showed that the area is characterized by high−sulfur epithermal alteration mineral assemblage, which has the potential for porphyry−epithermal hydrothermal deposit. It is suggested that the combination of hyperspectral and multispectral could help the subsequent analysis of alteration zonation and provide accurate mineralization prediction for prospecting, so as to serve the sector of mineral exploration engineering.
Highlights:The spectral index for alteration extraction using multispectral data was proposed; The hyperspectral strips were removed by spatial statistical method instead of frequency filtering, and the alteration minerals were extracted by using decision tree algorithm assisted mixed tuned matched filter.
-
1. 引 言
西藏位于中国的西南边疆,地形以高原和山地为主,自然地理环境较为恶劣,难以直接开展大范围的野外地质找矿详查。但其独特的地理位置与较长的大洋板块俯冲和陆陆碰撞的造山史为成矿物质来源与动力提供了良好条件,因而具备较大的矿产资源勘查前景(芮宗瑶等,2003;韦少港等,2016;Tang et al.,2021;高轲等,2024)。在大面积与环境恶劣的地质矿产资源勘查过程中,遥感是一种重要的先行技术手段(高扬等,2023;欧阳渊等,2023)。目前,已有研究基于Landsat−8、ASTER等多光谱遥感数据及高光谱数据建立了区域矿物光谱遥感地质找矿模型,然而相比之下,高光谱数据的应用尚不够成熟,其空间与光谱信息挖掘还不够深入(Sun et al.,2017;Jain and Sharma,2019;Kumar et al.,2020;姜琪等,2021;刘婷玥等,2021;Chen et al.,2022;孙雨等,2022a)。高光谱数据如GF−5等光谱通道间隔较窄,有着图谱合一的优势,其丰富的光谱信息为后续矿物的精细识别奠定了良好的数据源基础(孙永彬等,2018;孙允珠等,2018;Huang et al.,2020;王崇倡等,2021)。
传统的高光谱矿物精细化识别算法如波谱角匹配(SAM)对光谱曲线的细节特征不敏感,且对所有波段赋予同一权重因子,对形态相似的矿物波谱难以区分(魏祥坡等,2016;田青林等,2019;Liu et al.,2021;孙雨等,2022b),无法达到蚀变矿物的精确识别。本文以西藏革吉南地区为例,应用Landsat−8、ASTER、GF−5三种数据源进行矿化蚀变信息提取,构建多光谱数据增强型蚀变异常指数,并采用决策树分类辅助混合调谐匹配滤波方法在高光谱数据处理的基础上识别出了高岭石、明矾石等8种蚀变矿物,最终叠加多光谱数据提取的铁染、镁羟基、铝羟基、碳酸盐类矿物进行对比,初步圈定找矿异常区,结合野外验证进行区域综合成矿潜力分析。
2. 区域地质特征
研究区域地处冈底斯山脉的北缘,位于西藏自治区阿里地区革吉县南东向约50 km,面积大约800 km2。辖区内平均海拔约5000 m,由北至南的高低起伏分带明显,总体地势较好,基岩裸露面积较大,适合开展遥感地质研究(吕新彪等,2012)。
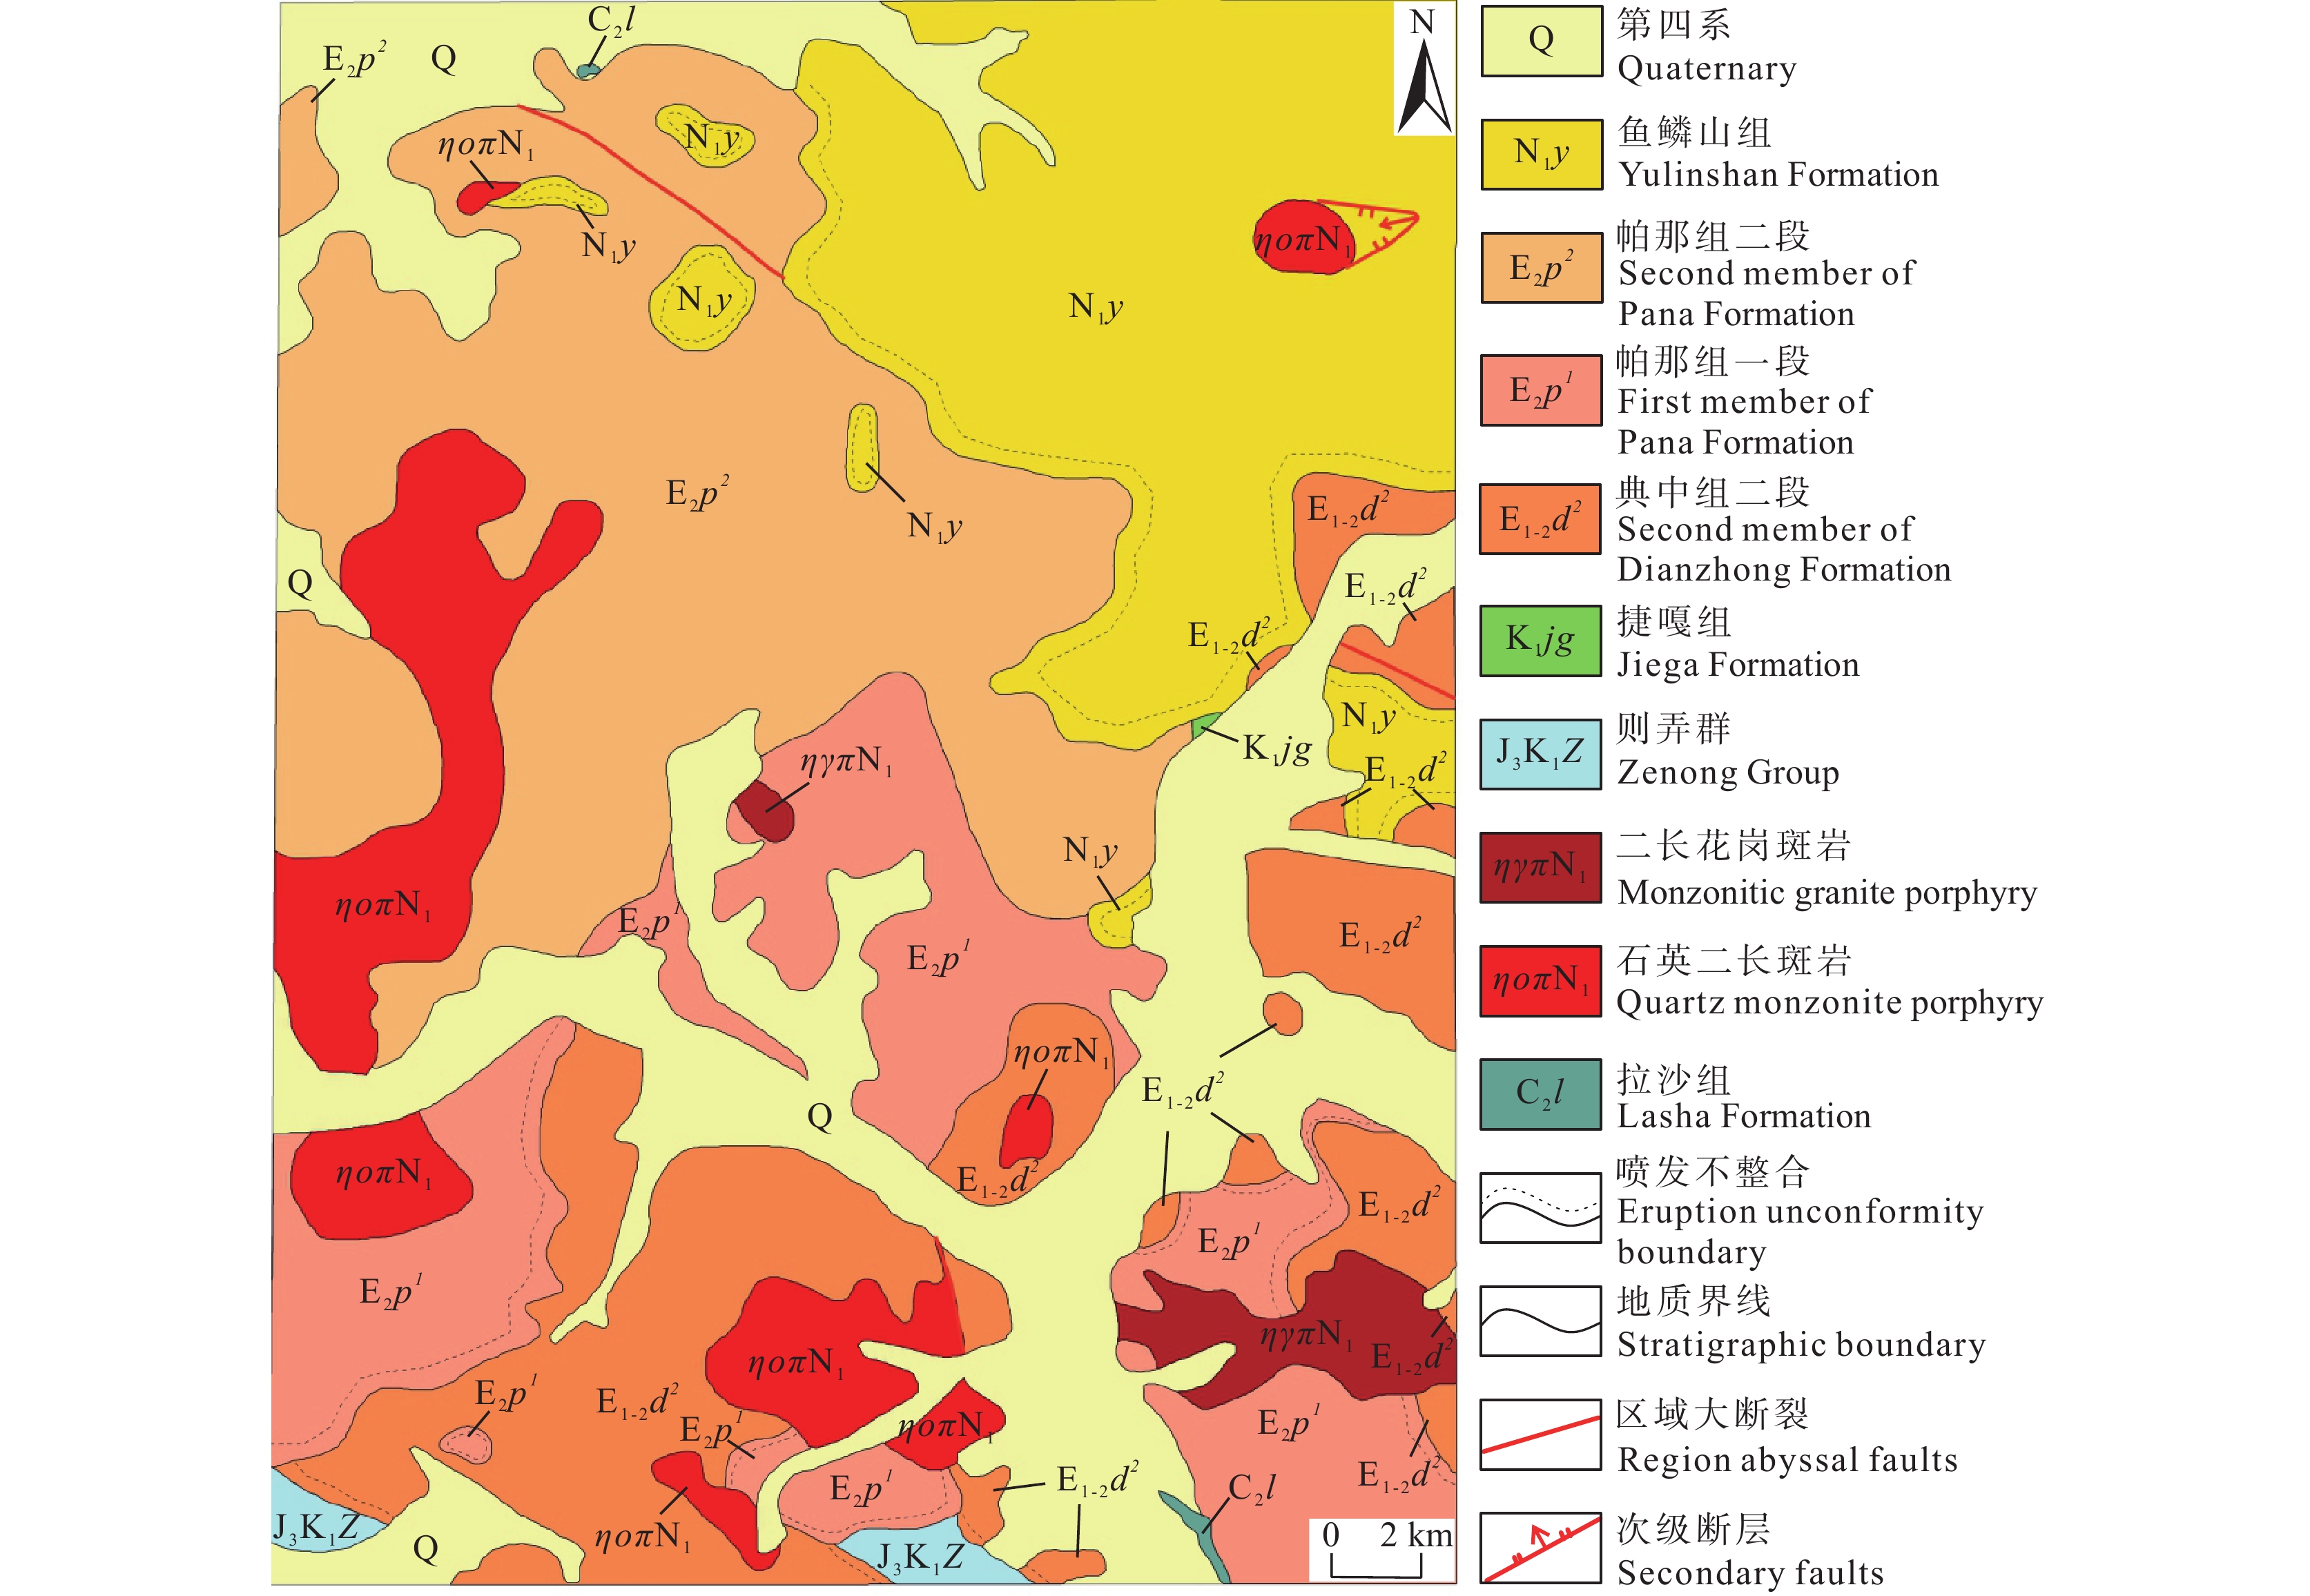
活跃的岩浆活动使研究区的地层出现了缺失,出露的地层主要为侏罗系—白垩系、古近系、新近系和第四系(图1)。侏罗系—白垩系则弄群在研究区内分布范围较局限,仅分布在研究区南侧,主要由砂岩、砾岩、泥岩、碎屑岩及安山岩组成;下白垩统仅残留捷嘎组(K1jg),与上覆的岩层间形成了喷发不整合接触,其岩性主要为青灰色泥晶和细晶灰岩、生物碎屑灰岩、圆笠虫灰岩等组成。古近系在研究范围内大致呈南北方向分布,据1︰25万亚热幅地质图资料显示,主要包括典中组二段、帕那组一段、二段等,与上伏地层间呈现不整合接触关系;典中组岩性以流纹岩、流纹质火山碎屑岩为主,帕那组一段以粗安岩、安山岩、玄武岩为主,二段则大多分布流纹岩、流纹质凝灰岩等。古近系—新近系的出露面积较大,多分布在研究区东部和北部,以帕那组(E2p)、典中组(E1-2d)及鱼鳞山组(N1y)为主,与下伏地层为不整合接触。第四系的分布范围较为广泛,主要是新生代的洪积物、冲积物、湖积、冰碛物等。
3. 遥感数据源与数据预处理
3.1 遥感数据选取
本文共使用了三类数据源:分别为Landsat−8、ASTER及GF−5。
美国陆地卫星Landsat−8搭载了OLI和TIRS两台传感器,光谱波长覆盖范围0.43~12.51 μm,其中OLI传感器包含9个波段,空间分辨率15~30 m,TIRS传感器包含2个空间分辨率为100 m的热红外波段(Guha et al.,2022;王曦等,2022)。本次研究采用OLI部分数据开展铁染、羟基蚀变信息提取研究。
ASTER数据是TERRA卫星上的一种光学传感器,由日本国际贸易和工业部制造。该传感器包含了可见光近红外至热红外波段共计14个波谱通道,光谱波长范围为0.52~11.65 μm,在VNIR波段空间分辨率为15 m,在SWIR及TIR波段,空间分辨率为30 m,用来开展铁染、铝羟基及镁羟基蚀变信息提取。
GF−5是世界上第一个同时对大气环境和陆地进行全方位观测的卫星,其上搭载了6台传感器,是目前我国搭载载荷最多、光谱分辨率最高的卫星,其可见短波高光谱红外相机(AHSI)共有330个波段通道,能够获取到0.4~2.5 μm范围内的光谱信息,空间分辨率为30 m,光谱分辨率可达5~10 nm,在蚀变矿物精细探测领域应用具备明显的优势。
3.2 数据预处理
3.2.1 波段筛选
GF−5共有330个波段通道,受水汽吸收作用的影响,对应Band193~Band200以及Band246~Band262处于无值状态,需要去除。可见光近红外谱段的Band145~Band150与短波红外谱段的Band151~Band154存在波长重复区,由于高分五号VNIR波段的信噪比高于SWIR谱段,因此保留VNIR波段的数据,即剔除SWIR中的Band151~Band154。同样SWIR谱段末波段噪声较大,极大地拉低了数据的质量,因此对后五个波段即Band326~Band330予以剔除。同时,经逐波段查看,发现Band192、Band201、Band263、Band264、Band265、Band325质量较差,因此予以剔除,并对最终保留下的290个波段进行整合(表1)。
表 1 保留的波段及波长范围(共计290个波段)Table 1. Bands remained and wavelength ranges (290 bands in total)保留波段号(波段序号) 波长范围/nm 1~150(1~150) 390~1029 155~191(151~187) 1038~1342 202~245(188~231) 1435~1797 266~324(232~290) 1974~2463 3.2.2 坏线修复及条带去除
高光谱传感器是由多个 CCD电荷耦合器件构成,每个 CCD包含了数万个检测元件,一些探测元件在标定过程中会产生误差,使GF−5图像中的某些列的像元值与周围列之间出现明显差异,称为“坏线”。本次研究中借助坏线条两侧的相邻的列/行的像元平均值来进行修复。
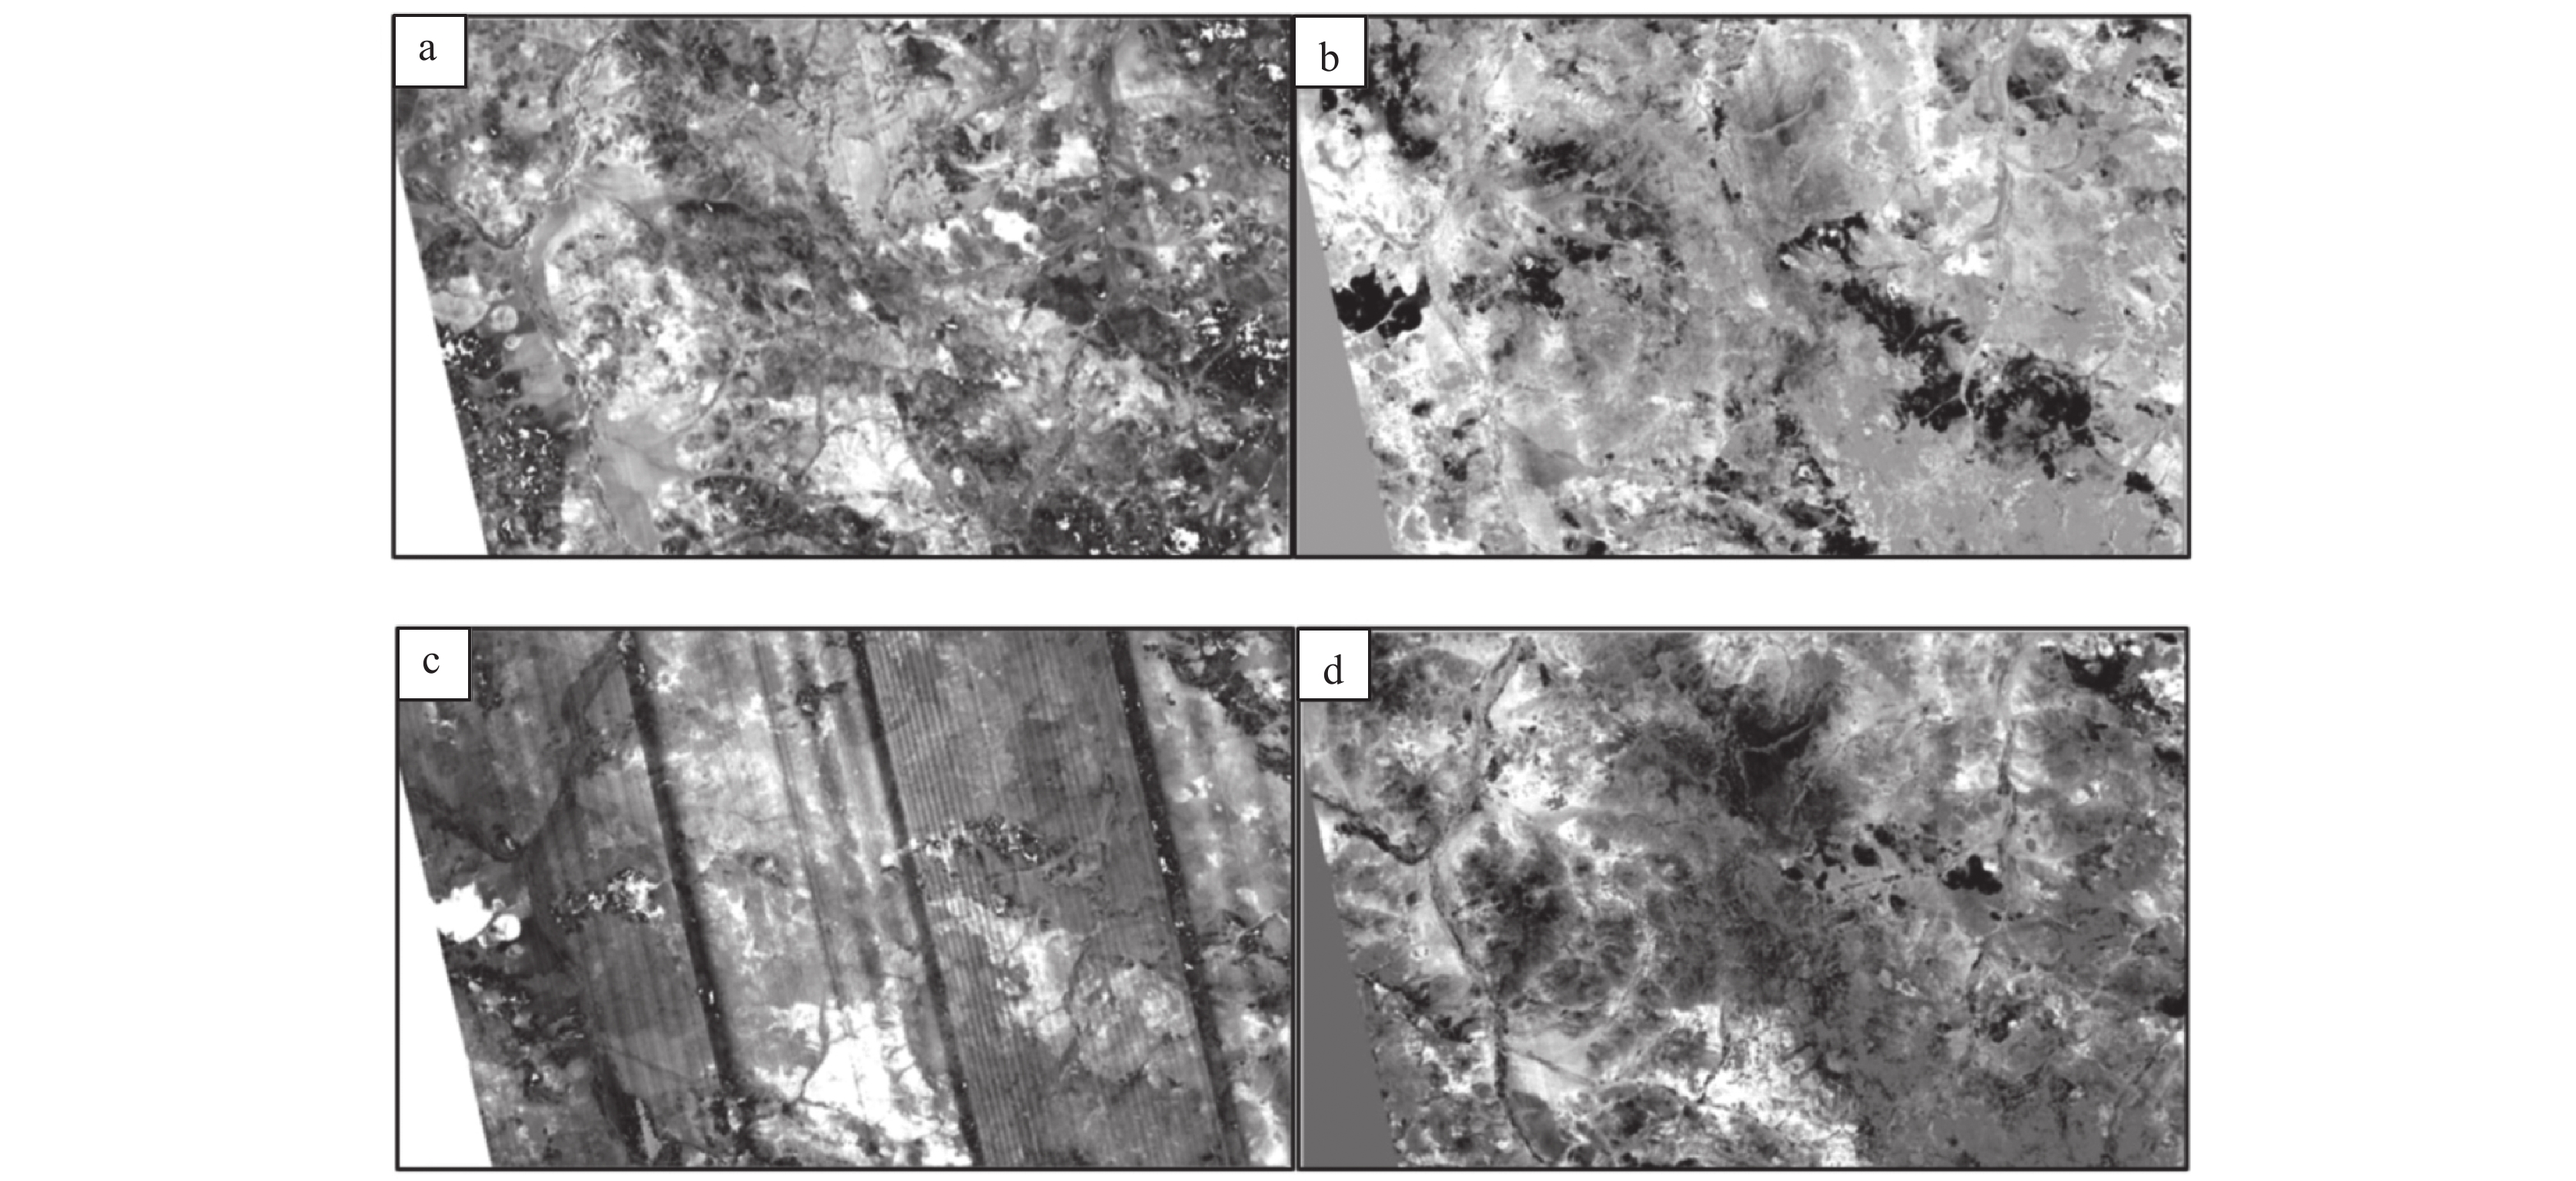
受传感器的影响,高光谱数据的部分波段会存在条纹效应严重影响数据的质量及其后续信息提取。原始数据中出现条纹的区域一般肉眼难以区分,因为其像元值与正常区域相比较小却不为0。本文分别对GF−5数据的可见光—近红外波段(VNIR)、短波红外波段(SWIR)进行最小噪声分离变换,由变换结果可知存在严重的条纹效应(图2a、c),且与VNIR波段相比,SWIR波段条纹现象更严重。对于后续进行羟基类、碳酸盐类相关矿物蚀变信息的提取而言,短波红外的波段又显得尤为重要,因此条纹噪声修复是高光谱数据处理中不可缺少的一项工作。
传统的傅里叶变换等频率域滤波法对于条带噪声的去除虽有一定的效果,但其在变换过程中容易造成信息丢失,容易对像素级分类带来影响(房彩丽和赵雅靓,2012;皮原征等,2020),对GF−5数据适用性较低。此处摒弃了频率域处理的方法,主要采用空间域统计的方法对条纹效应进行修复:设Xi、Yi分别为第m波段第i列的均值和标准差,Xi′、Yi′分别为参考图像对应第m波段第i列的均值和标准差,对应传感器的增益量记为α,偏移量记为β,其中,α=Yi′/Yi,β=Xi′−αXi。则对应图像中第m波段i列、j行的辐射值R应调整为:R′=αR+β。随后,将参考图像的平均值和标准差用整幅图像的平均值和标准差来代替。修复效果如图2b、d所示。
3.2.3 辐射定标及大气校正
为确定传感器入口处的辐射值,通常采用辐射定标的方法将原始 DN的数据转换为大气表层的反射率(或者辐射亮度值),同时校正传感器自身成像时产生的偏差。此处采用 ENVI 5.3平台的辐射定标工具对多光谱(Landsat−8、ASTER)及高光谱数据(GF−5)进行辐射定标。同时,在卫星影像的成像过程中,受大气散射作用等的影响,会产生一定的辐射偏差,导致传感器接收到的信号值无法反映目标地物的真实反射率。基于ENVI5.3中的FLAASH大气修正模块分别对Landsat−8、ASTER及GF−5进行大气校正,可削弱辐射误差。该模块是按照 MODTRAN 4+的辐射传输方式进行设计的,适用性广泛,可有效地削弱大气吸收和散射等各种因素对地物反射产生的影响。
3.2.4 几何校正及地理配准
在遥感成像处理过程中,受限于遥感平台及地理原因等客观存在的因素,图像像元相比于地面目标像元的真实地理位置会出现畸变现象,这会对后期影像数据的处理和分析产生影响,因此在蚀变信息提取之前,必须对3种影像数据进行几何校正。同时,为方便后续蚀变信息提取结果叠加与分析,削弱不同传感器影像之间存在地理误差,需要对影像进行地理配准。此处将多光谱Landsat−8数据作为参考影像,分别对GF−5、ASTER数据进行地理配准。配准过程选取8个控制点对研究区域进行控制,RMS为0.453,满足配准要求。
4. 蚀变信息提取
4.1 Landsat−8蚀变异常信息提取
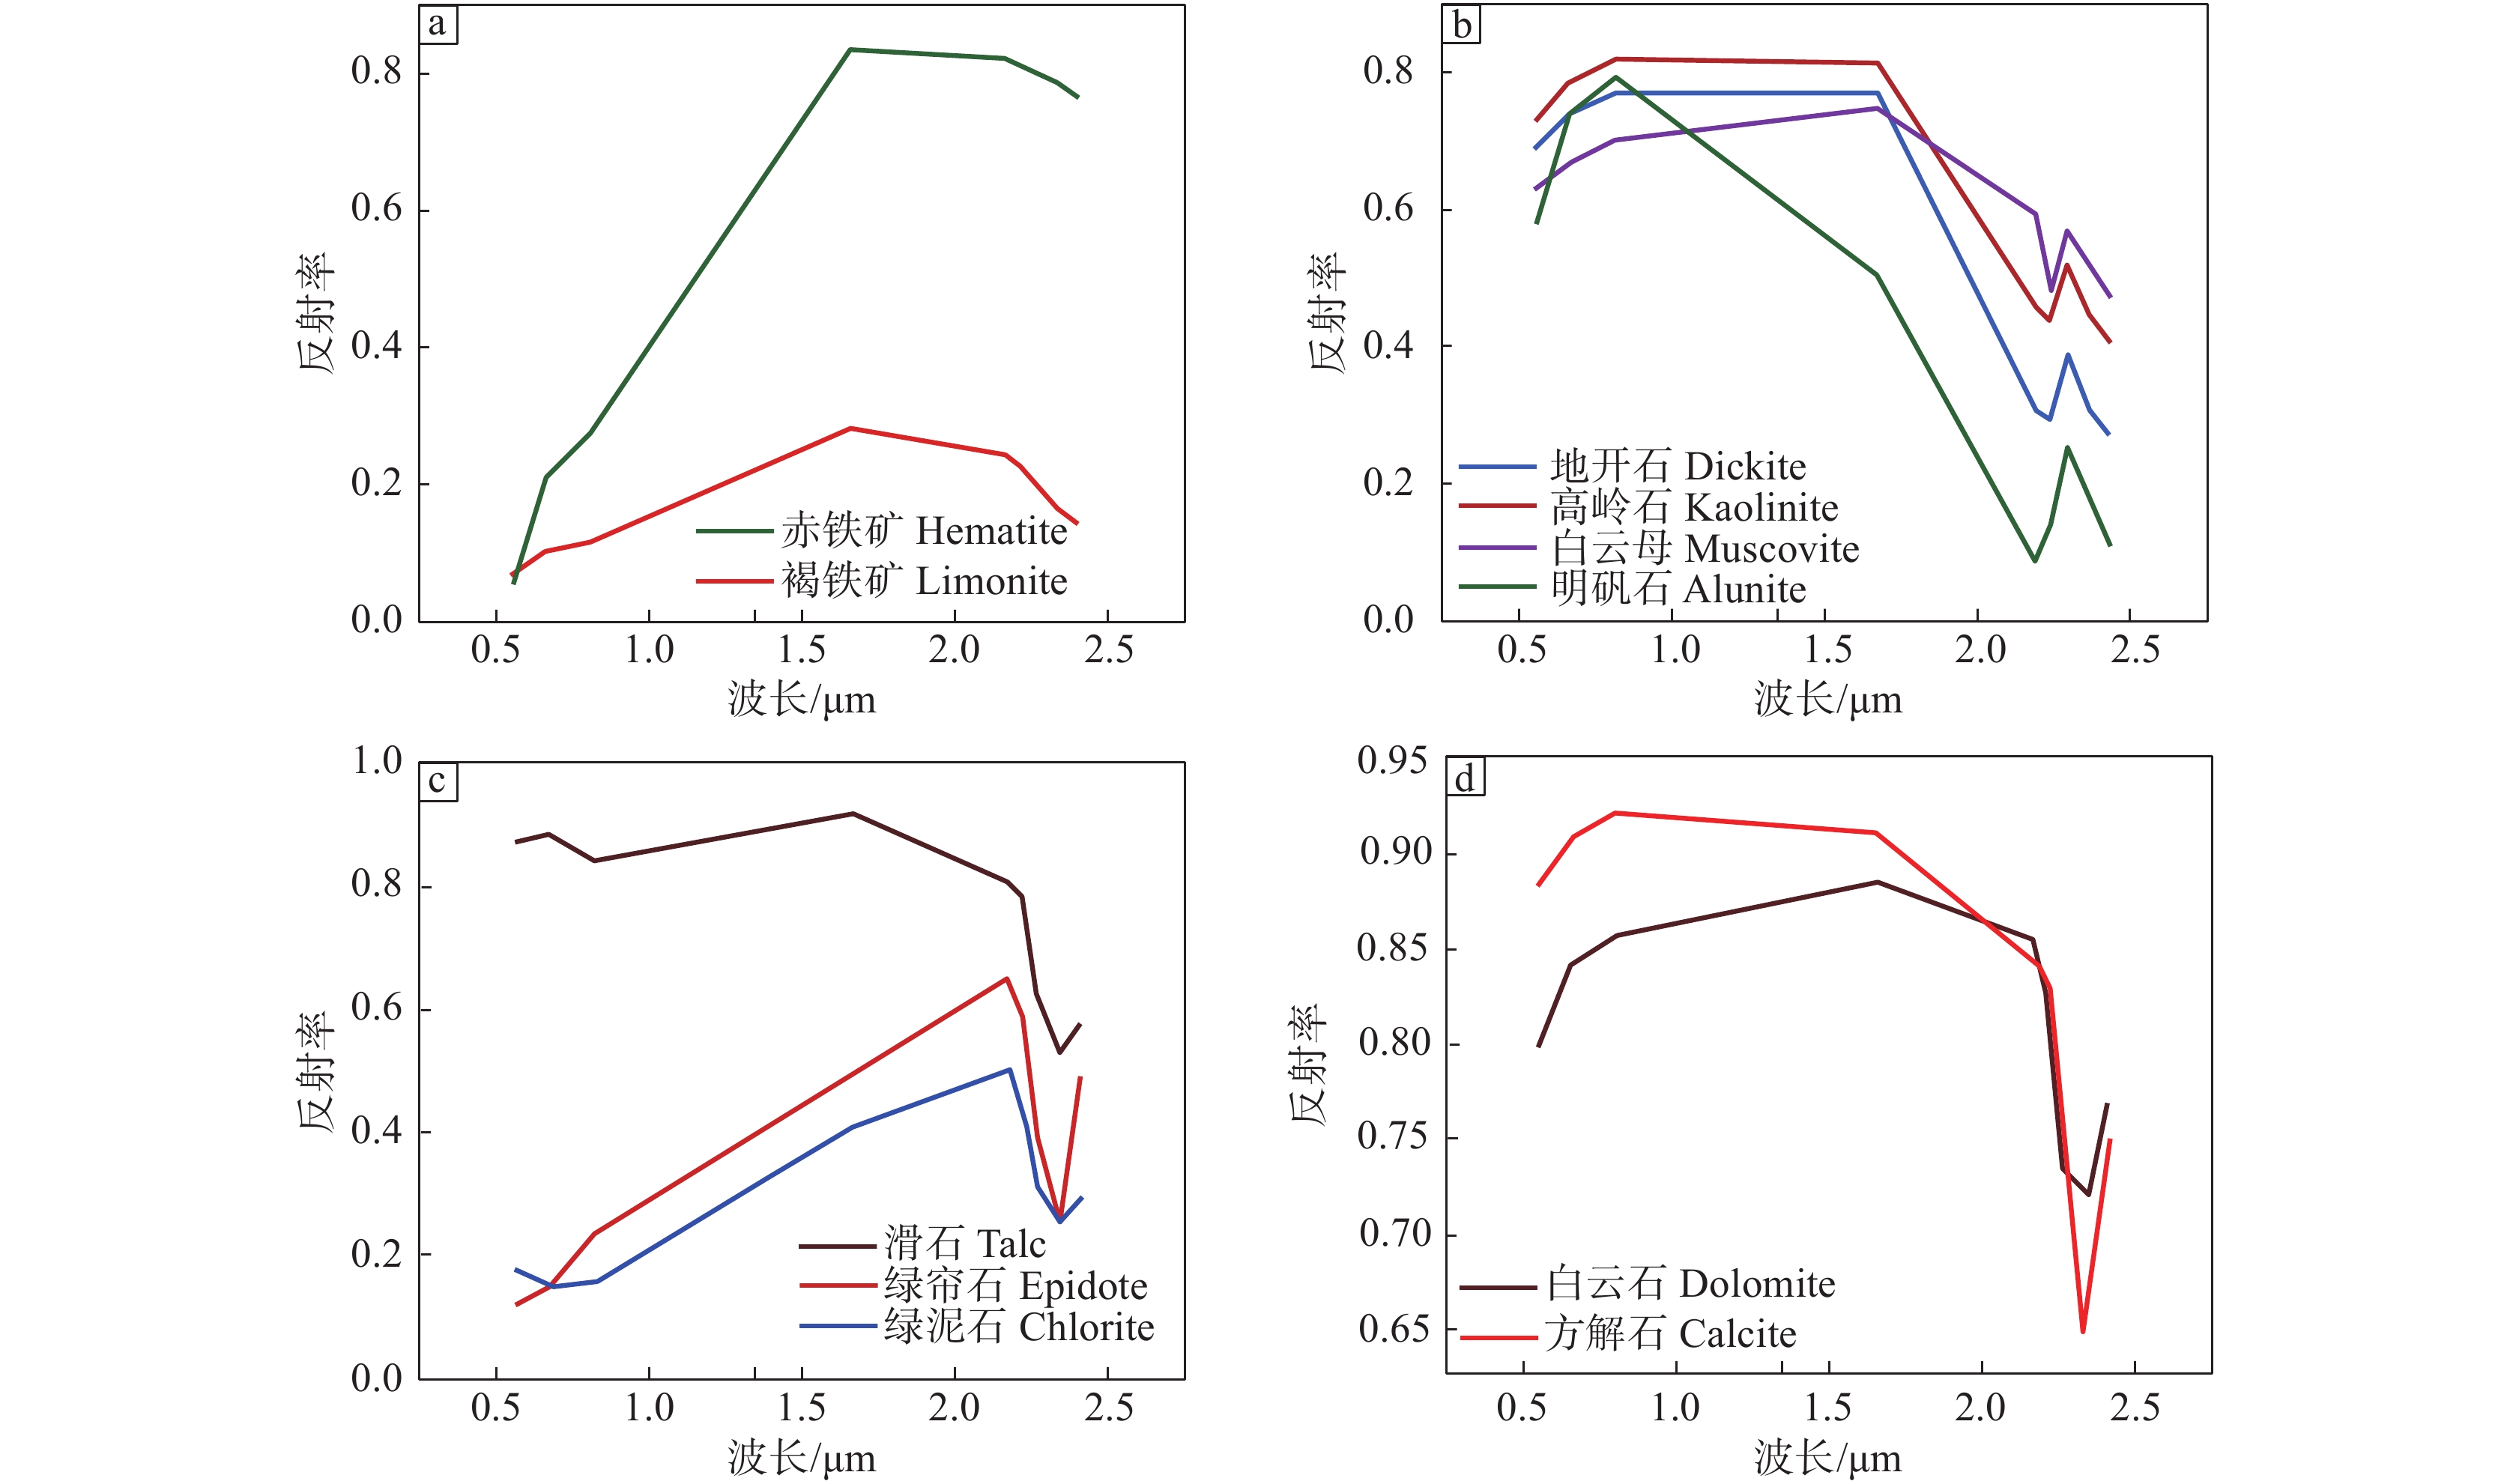
分别将铁染类、羟基类代表性蚀变矿物标准波谱曲线重采样至Landsat−8影像(图3),经分析可知铁染类蚀变矿物在Band2、Band5表现为吸收谷,而在Band4与Band6处表现为反射峰,且由Band5过渡至Band6,反射率急剧上升。因此此处借助Band6/Band5来增强铁染类蚀变信息(图4a)。
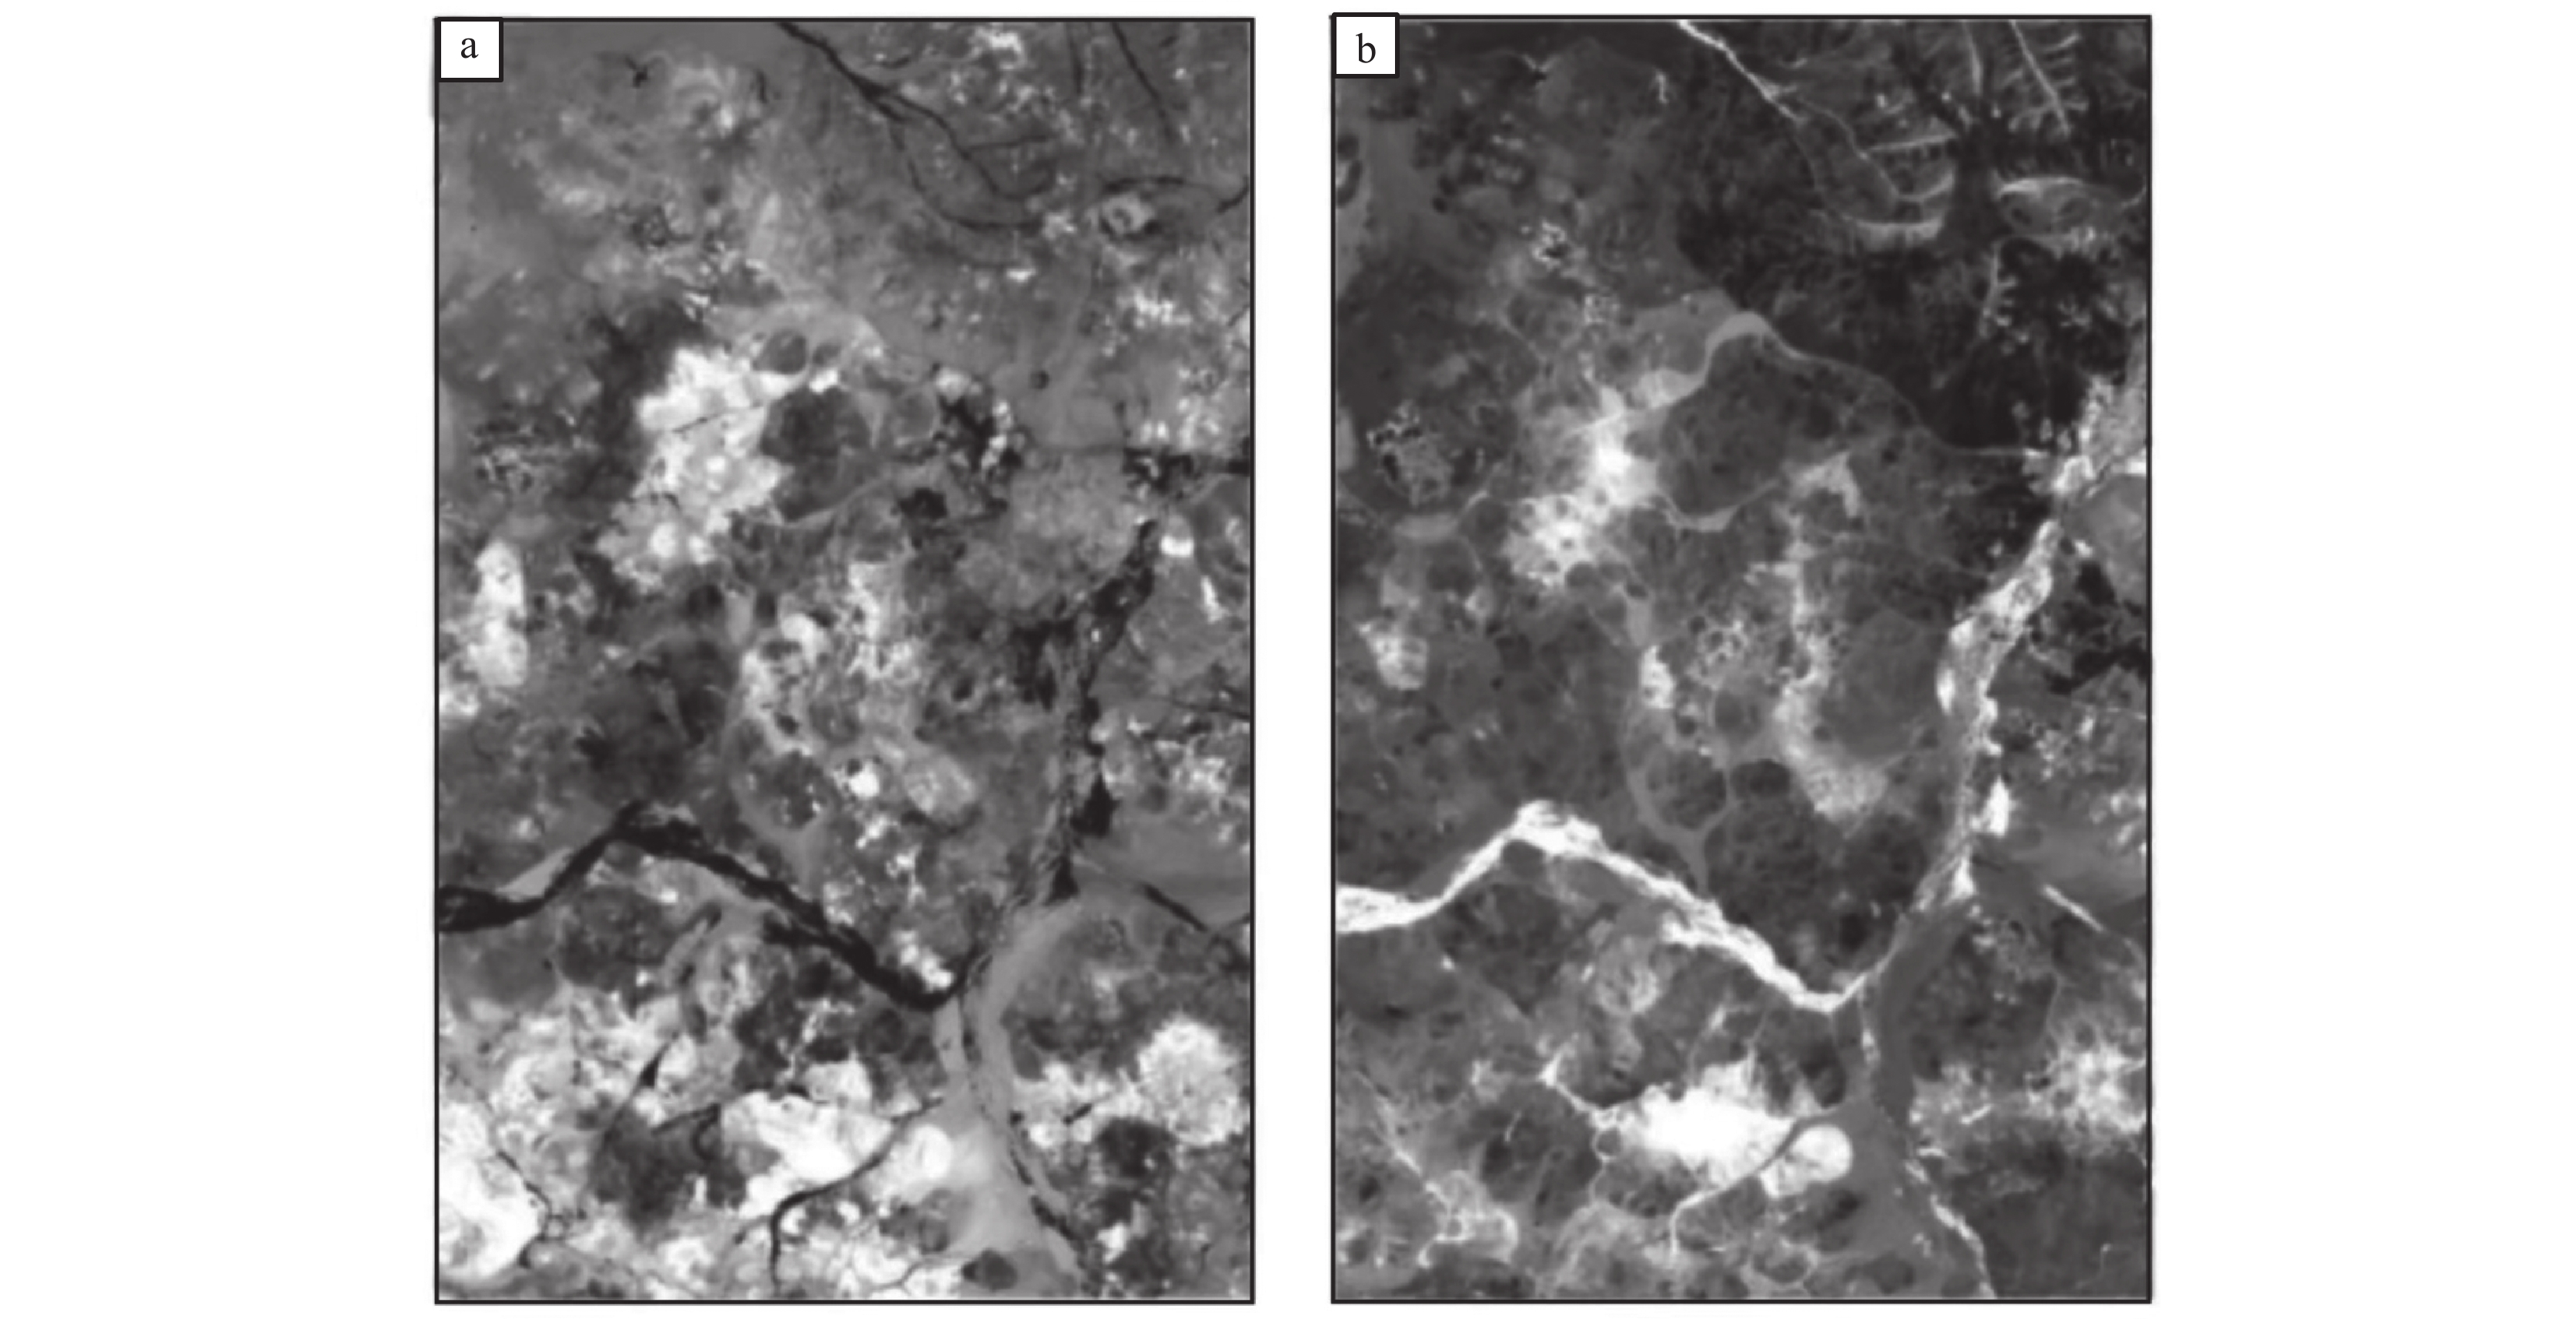
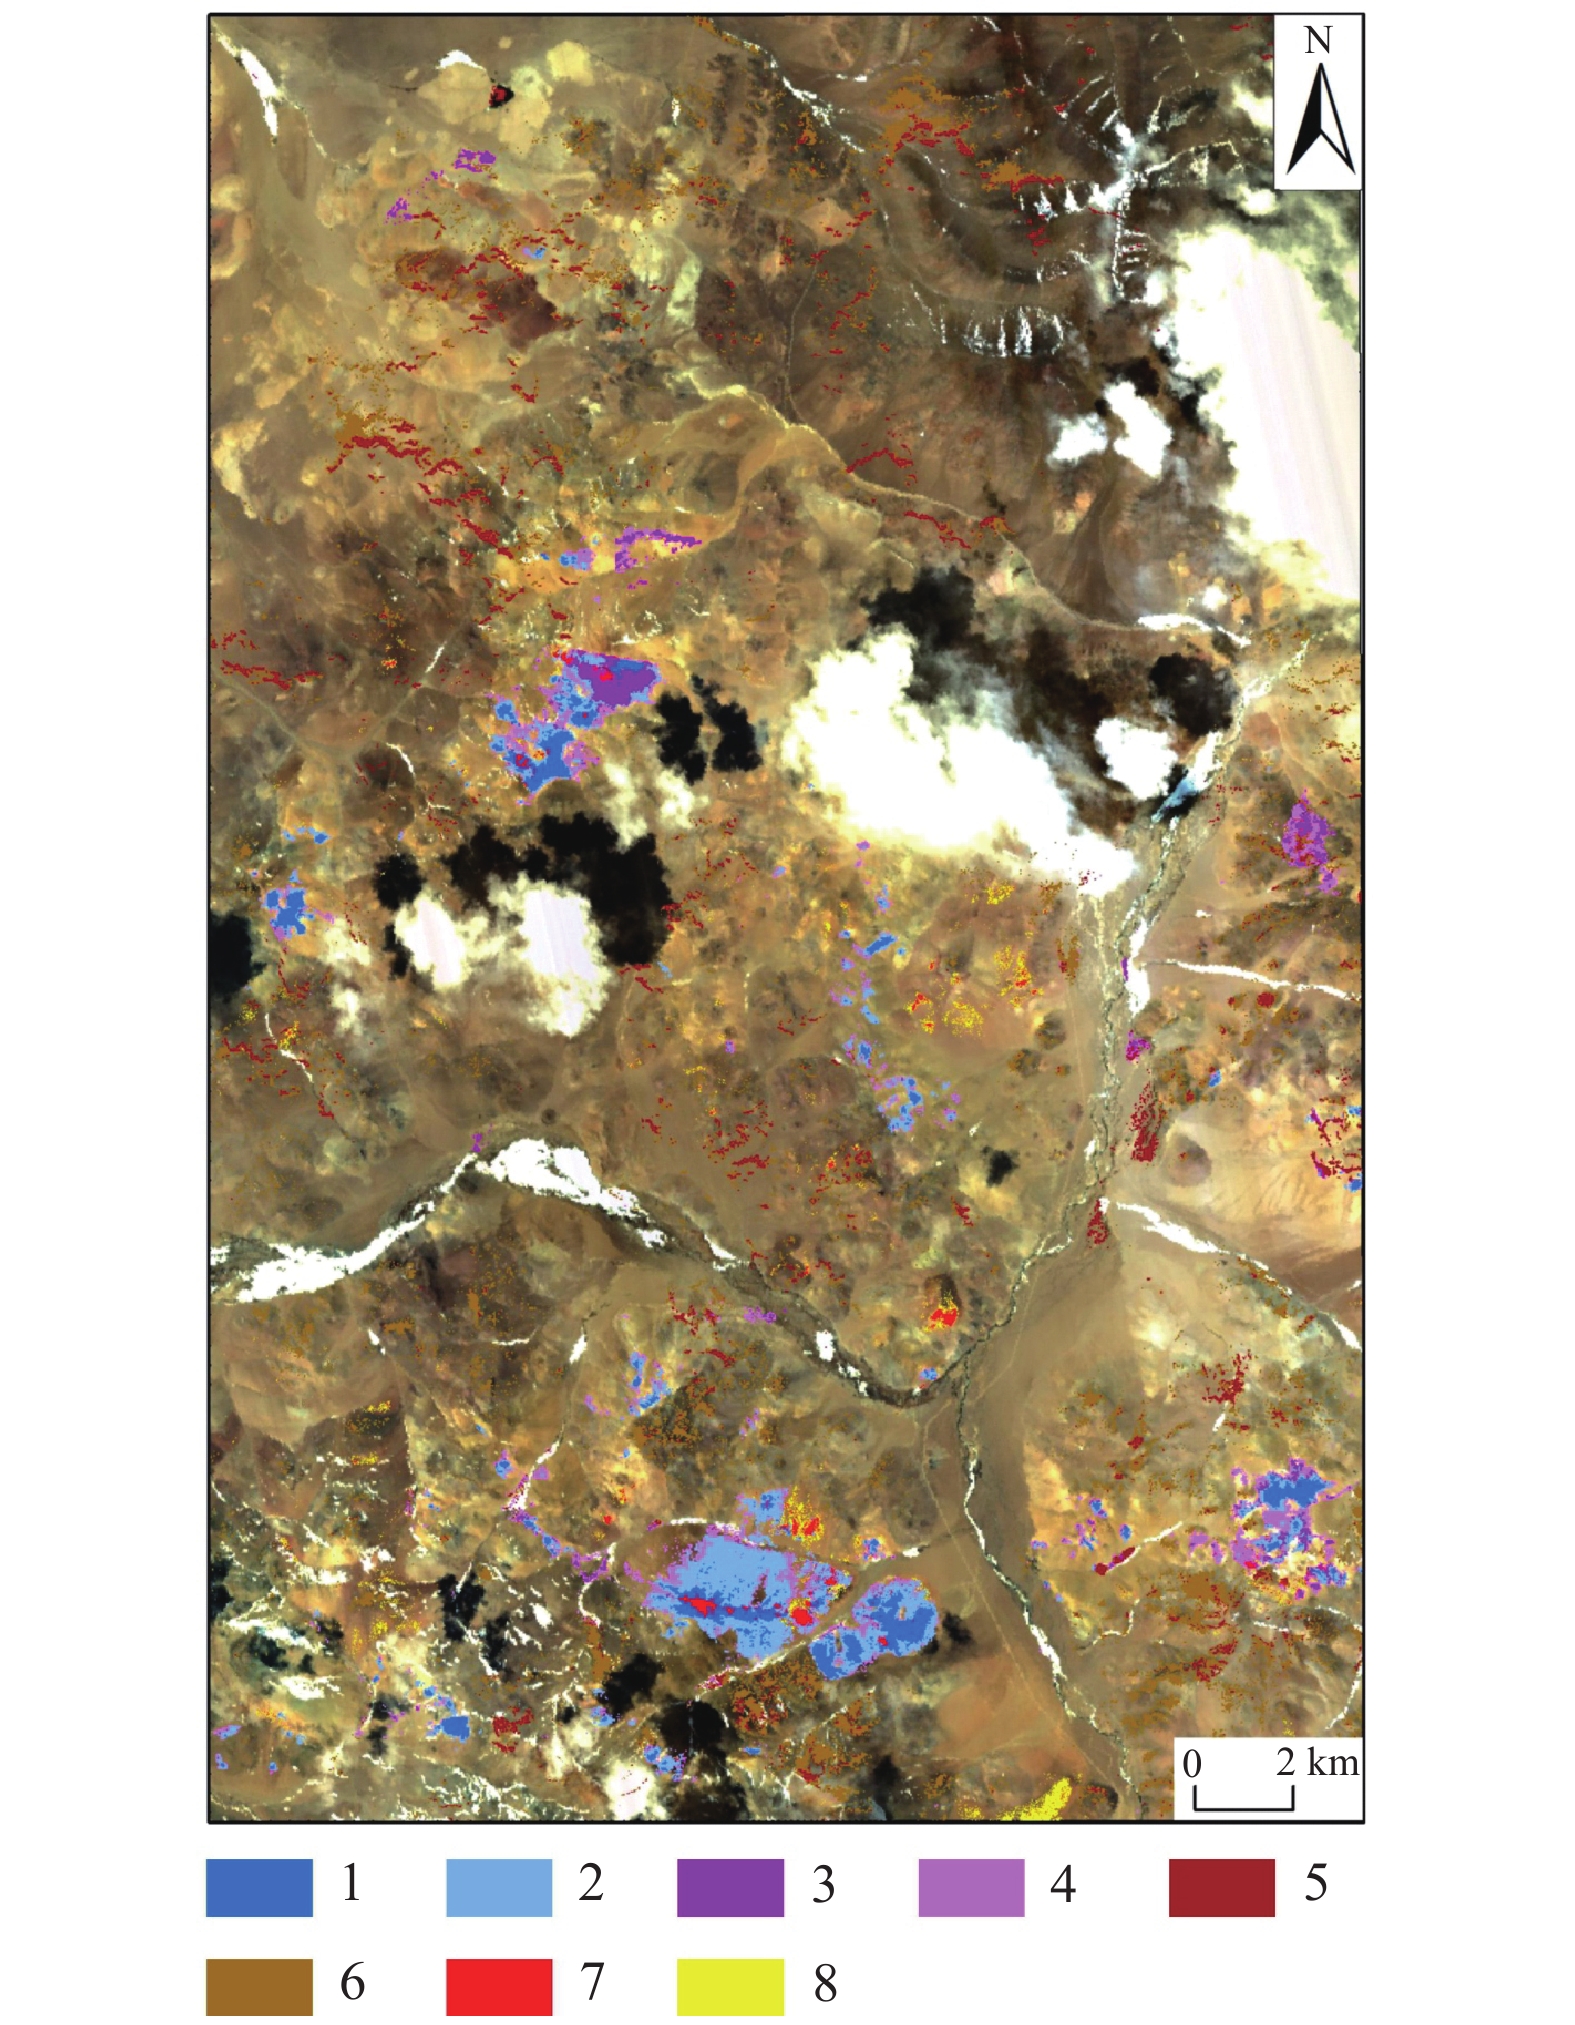
同理,分析羟基、碳酸盐类蚀变矿物重采样波谱曲线可知,该类矿物在Band6处具有高反射率,而在Band7即波长2200 nm处表现为强吸收特征,因此借助Band6/Band7来扩大亮度反差(图4b),对应此类异常应分布在图中高亮度区域,最终通过Crosta方法进行阈值设定与异常等级划分(图5),即以标准偏差为阈值,并以k倍的标准差设置阈值(一般来说,对于羟基类矿物k取2、2.5、3来划分级别,铁染类矿物中k取1.5、2.5)。
4.2 ASTER蚀变异常信息提取
通过重采样波谱曲线(图6)可知,铁染类蚀变矿物在ASTER数据中Band4表现为强反射,Band3对应呈吸收特征,因此构建Band4/Band3比值指数来对研究区的铁染异常信息进行增强。
对于地开石、白云母、明矾石等含铝羟基的蚀变矿物,由波谱曲线变化规律可知,该类矿物对应在Band4、Band7呈反射状态,在Band5和Band6的反射率较低,因此构建指数模型(Band4+Band7)/(Band5+Band6)来对铝羟基类蚀变矿物异常区域进行增强显示。
对于镁羟基类蚀变矿物而言,综合分析代表性矿物重采样后的波谱曲线特征,应当采用Band1、Band3、Band4、Band8四个特征波段进行主成分分析对镁羟基异常进行提取,构建特征向量矩阵(表2),结合其波谱曲线特征可知,PC4中Band3、Band8表现为同号,且贡献值较大,与Band4符号相反,符合对应蚀变矿物的波谱变化规律,故选取PC4作为提取Mg−OH蚀变信息的主分量。
表 2 ASTER数据Band1、3、4、8主成分得分Table 2. Changes in principal components of band 1, 3, 4 and 8 based on ASTER data主成分 Band1 Band3 Band4 Band8 PC1 −0.463516 −0.860375 −0.173869 −0.121149 PC2 −0.025923 0.252097 −0.774868 −0.579098 PC3 0.885530 −0.442635 −0.125650 −0.064204 PC4 −0.017808 0.016595 −0.594610 0.803646 结合碳酸盐的蚀变矿物波谱曲线特征可知,该类矿物在Band7、Band8及Band9表现出代表性的波谱变化特征,因此对Band7、Band8、Band9进行主成分分析(表3)。分析得出的主分量特征值可知,PC3在Band8处贡献值为负,且与Band7、Band9符号相反,符合碳酸盐类矿物波谱变化规律,因此选取PC3作为提取碳酸盐矿物的特征分量。
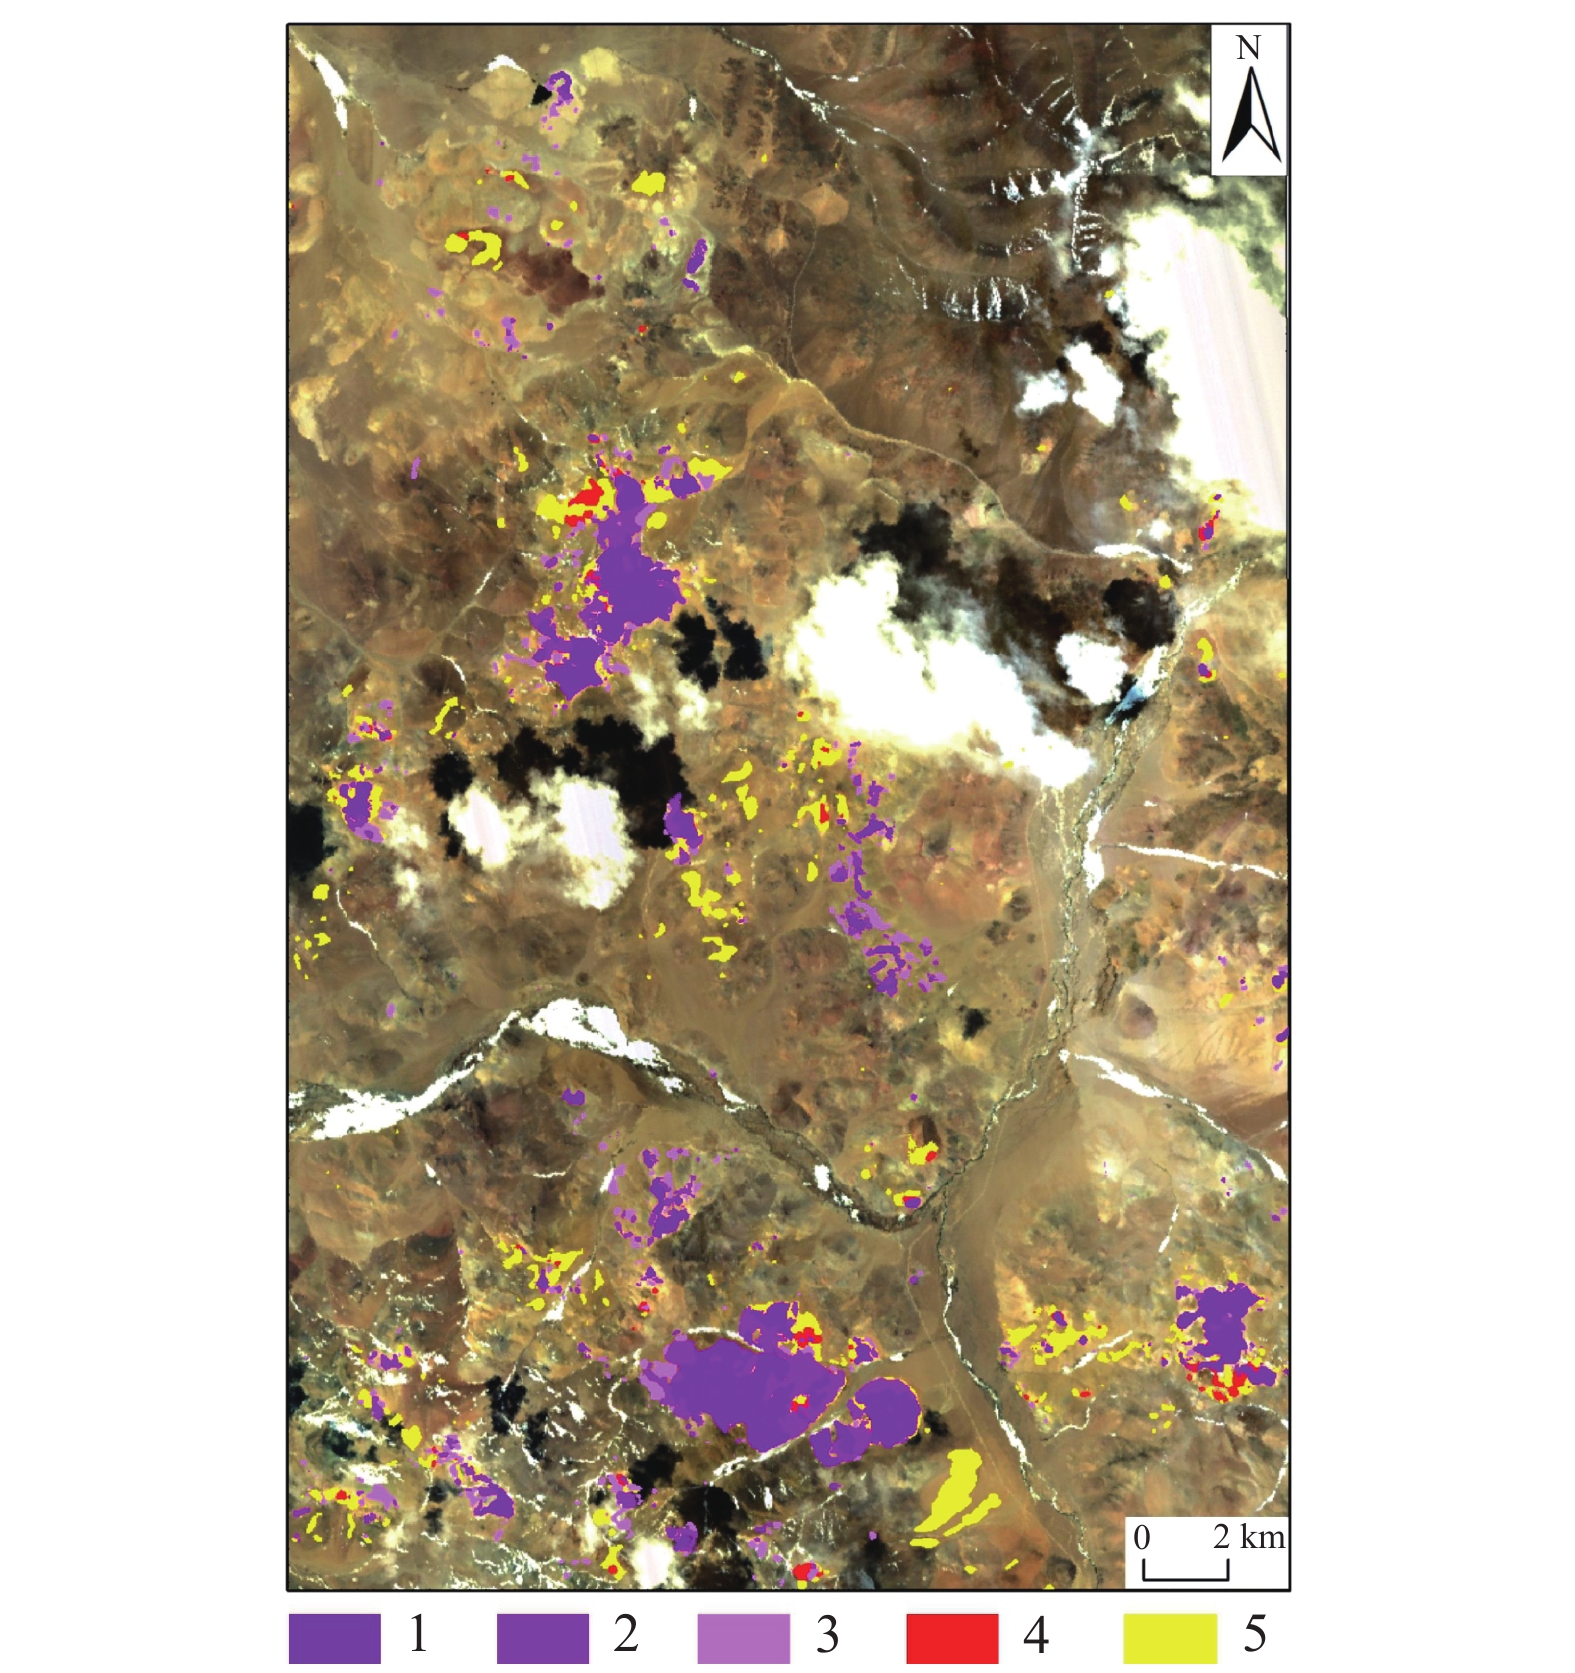
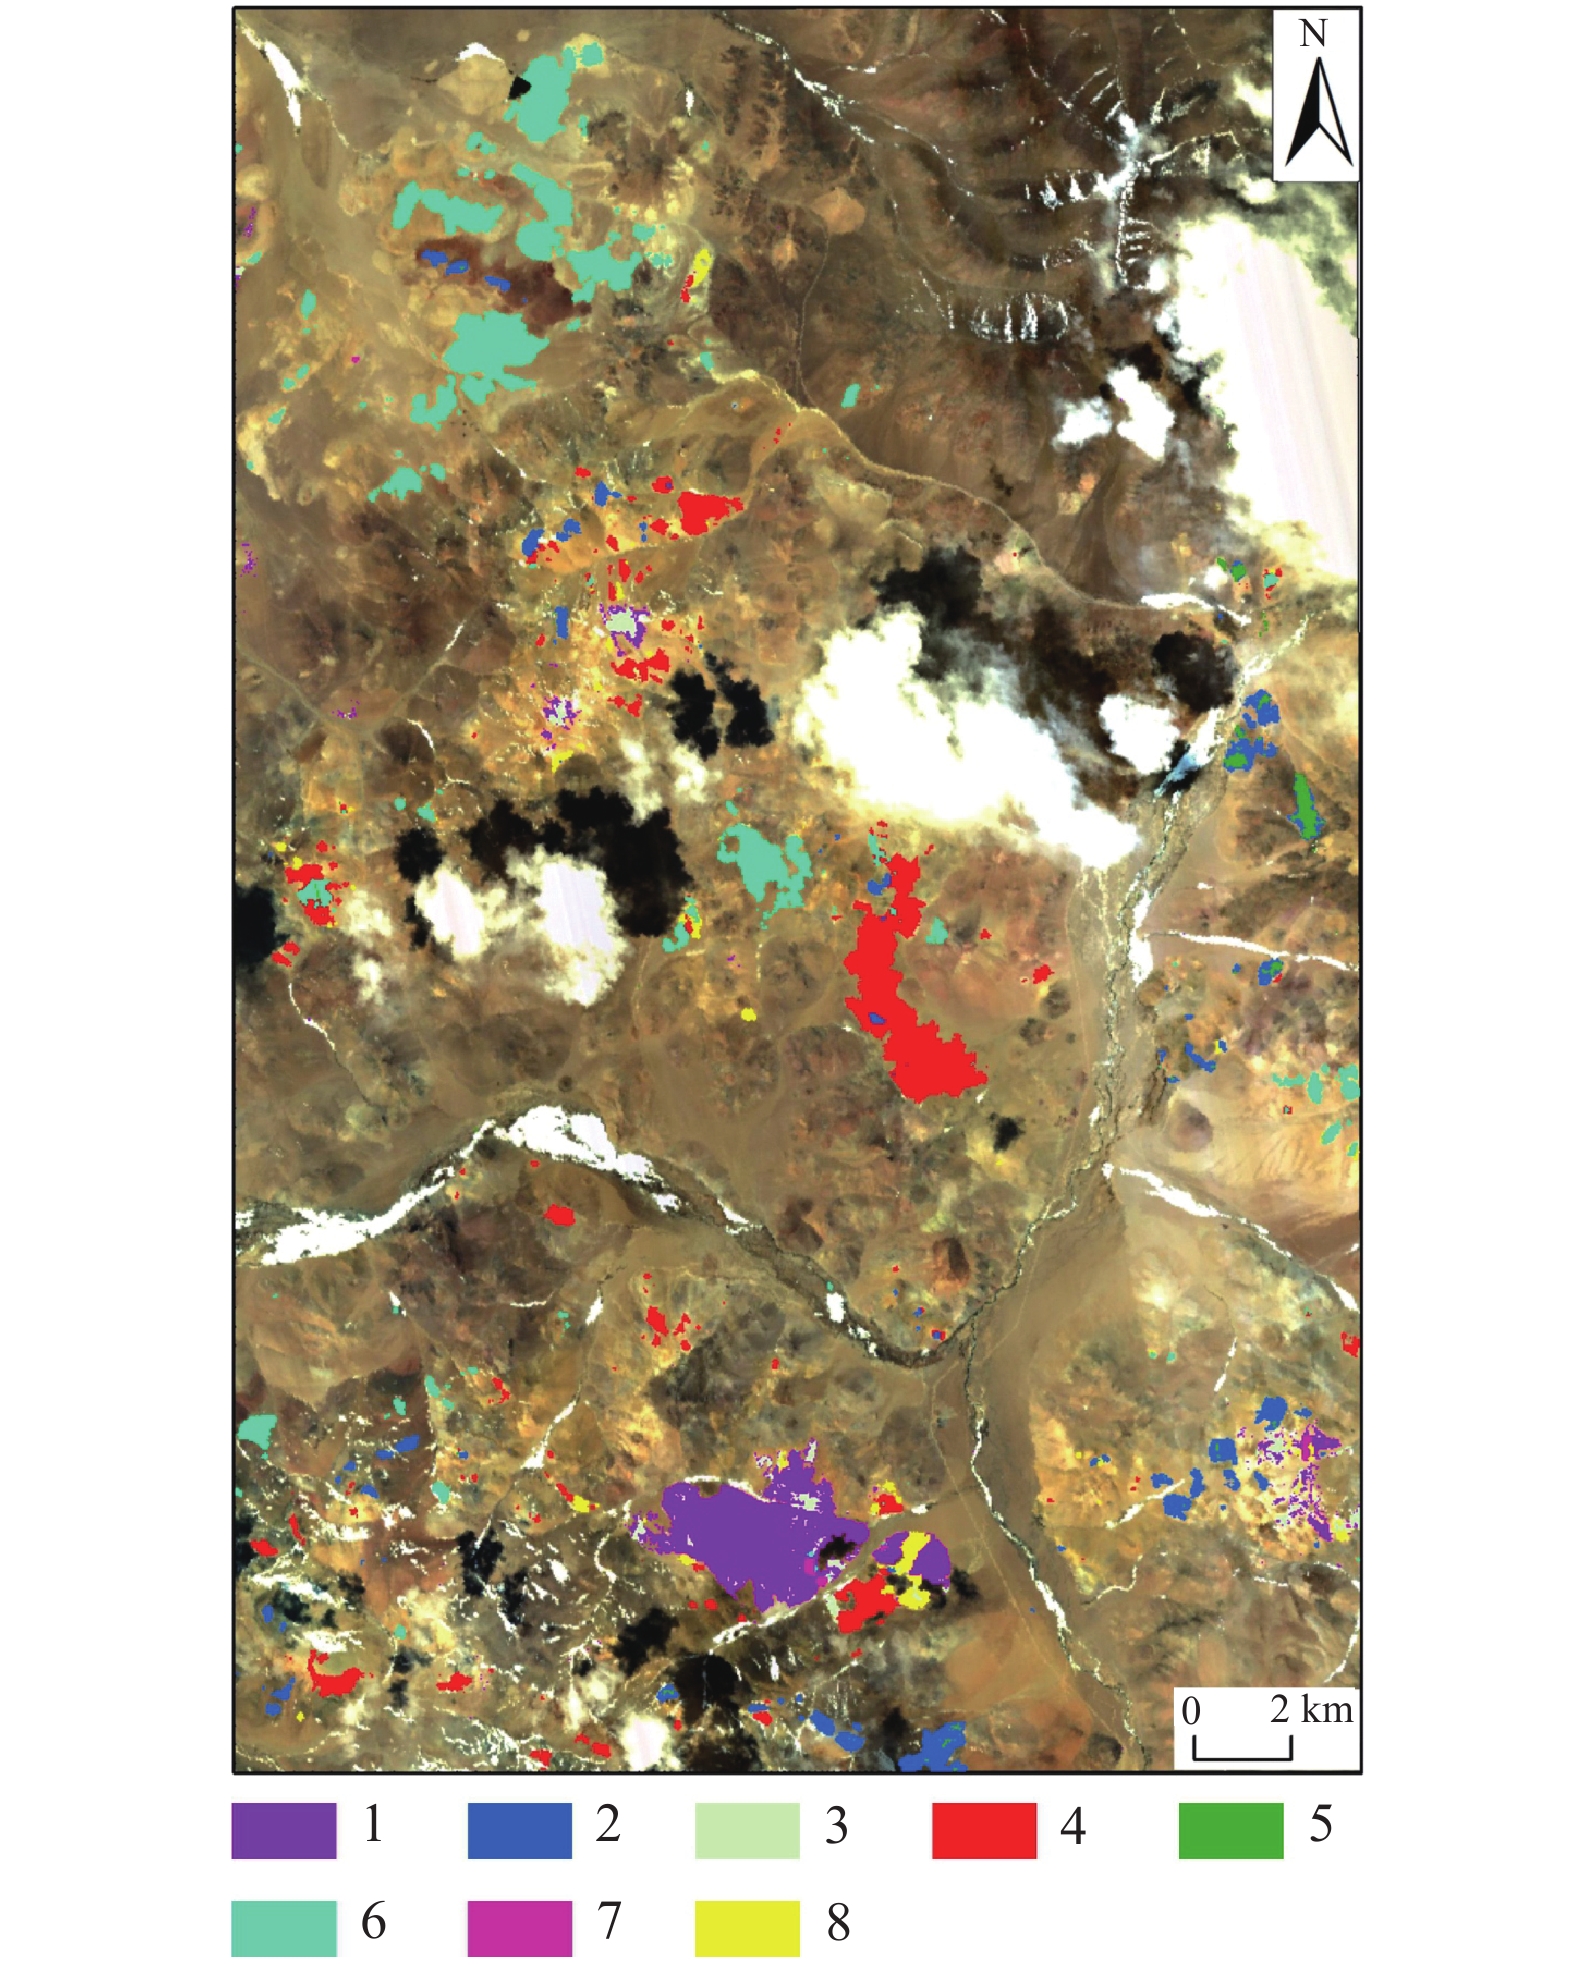
表 3 ASTER数据Band7、8、9主成分得分Table 3. Changes in principal components of band 7, 8 and 9 based on ASTER data主成分 Band7 Band8 Band9 PC1 −0.628682 −0.557667 −0.542002 PC2 −0.759775 0.291838 0.581010 PC3 0.165833 −0.777070 0.607175 采用ENVI的统计功能对主分量进行统计,求得均值与标准差后,同理采用Crosta方法进行阈值设置与异常分级,并对不同种类的蚀变分别赋予不同颜色加以区分,随后叠加至影像上(图7)。
![]() 图 7 ASTER蚀变信息提取结果图1—铝羟基一级;2—铝羟基二级;3—镁羟基一级;4—镁羟基二级;5—碳酸盐一级;6—碳酸盐二级;7—铁染一级;8—铁染二级Figure 7. Results of alteration information extracted from ASTER1–Aluminum hydroxyl I; 2–Aluminum hydroxyl II; 3–Magnesium hydroxyl I; 4–Magnesium hydroxyl II; 5–Carbonate I; 6–Carbonate II; 7–Iron−stained I; 8–Iron−stained II
图 7 ASTER蚀变信息提取结果图1—铝羟基一级;2—铝羟基二级;3—镁羟基一级;4—镁羟基二级;5—碳酸盐一级;6—碳酸盐二级;7—铁染一级;8—铁染二级Figure 7. Results of alteration information extracted from ASTER1–Aluminum hydroxyl I; 2–Aluminum hydroxyl II; 3–Magnesium hydroxyl I; 4–Magnesium hydroxyl II; 5–Carbonate I; 6–Carbonate II; 7–Iron−stained I; 8–Iron−stained II4.3 GF−5矿物精细化识别
4.3.1 GF−5降维与滤波
GF−5数据波段通道较多,短波红外谱段使用广泛且有效,因此,在波段处理时,仅对部分有诊断性吸收特征的波段进行处理与信息提取,可以有效减少数据量并降低计算机的工作负担,主要借助波段的进一步筛选来达到降维的效果。结合蚀变矿物的波谱曲线特征,此处仅选取Band269~Band324作为特征波段进行蚀变异常提取,对应波长范围1999~2463 nm。
结合GF−5波谱间隔较小的特征,其对应像元波谱曲线存在的大量锯齿状噪音与诊断吸收谱段易混淆,干扰矿物波谱的匹配,难以进行矿物波谱的精确识别,此处采用Savitzky−Golay技术进行波谱平滑。即基于最小二乘法拟合滤波法,在对波谱曲线进行移动平滑的同时滤除噪声,并尽可能保持原有信号的形状。平滑的效果会随选取窗口宽度的不同而有所差异,从而适应不同的场景。通过实践经验可知,当滤波核左右侧点的个数为3、平滑多项式次数为4时,滤波处理效果较好,能够较好地保留波谱的特征。
4.3.2 端元选取与波谱库建立
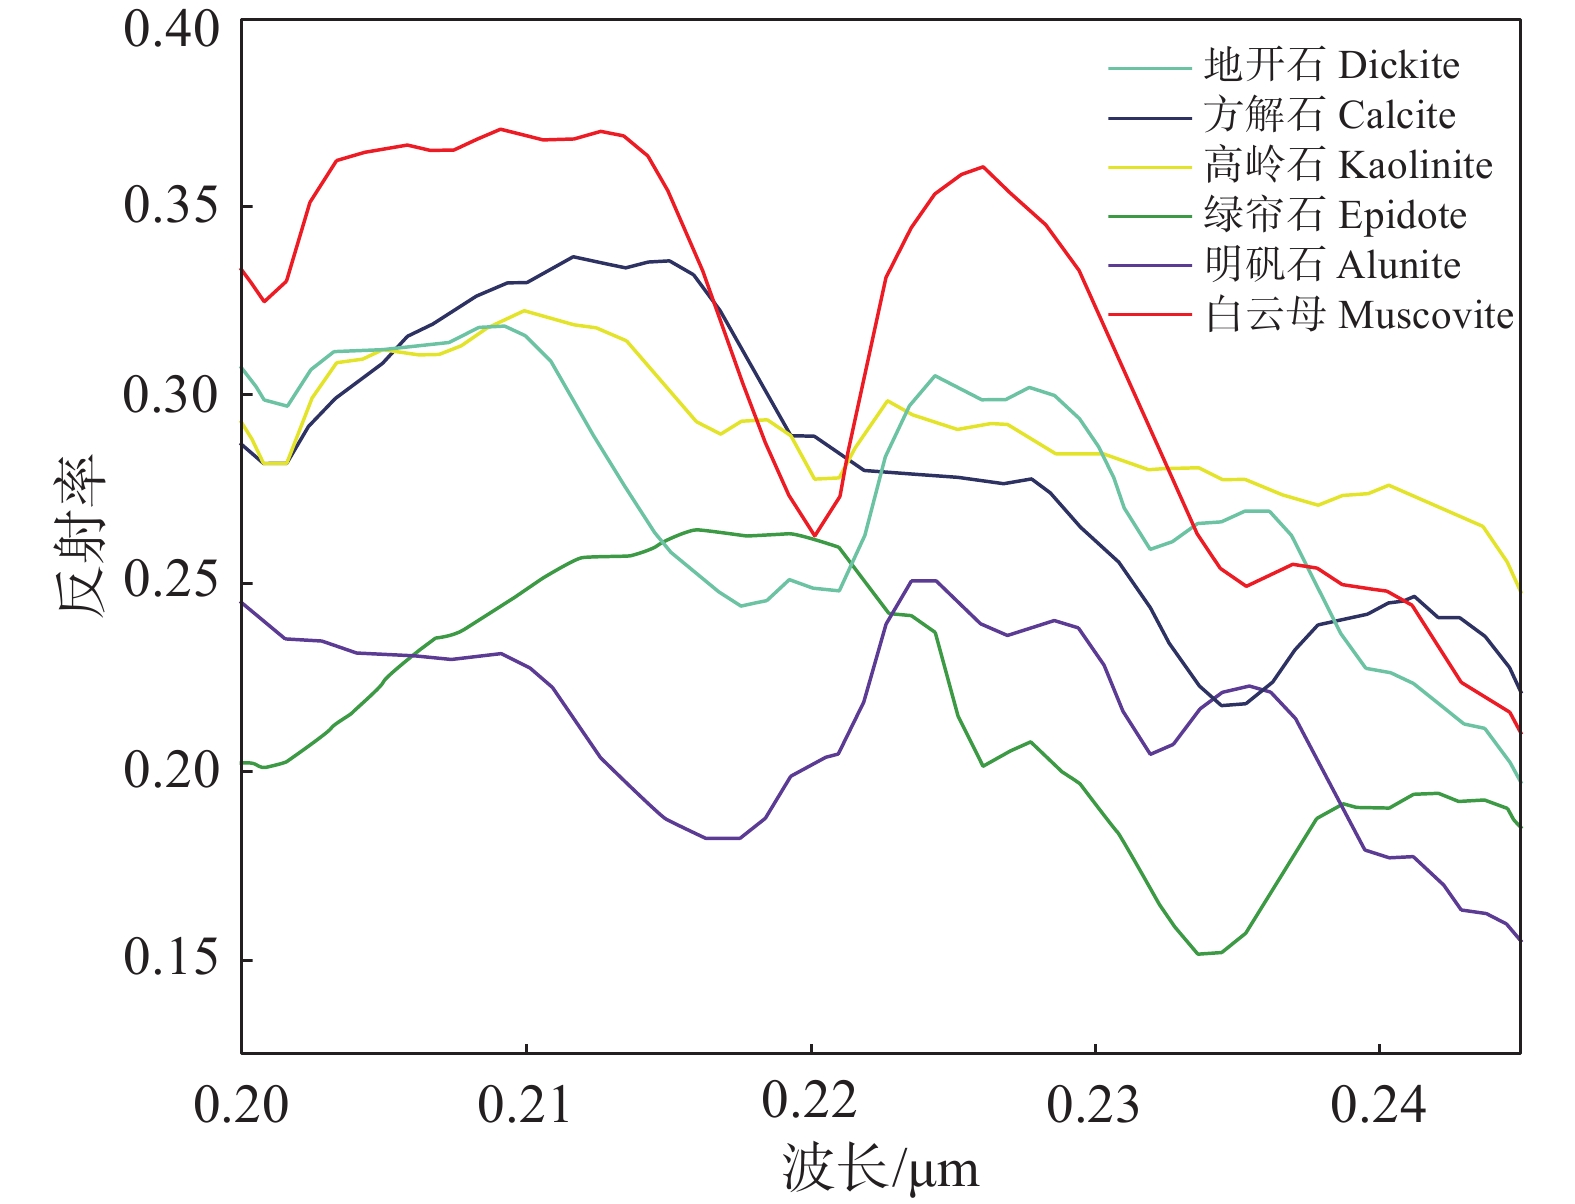
受蚀变分带特征及成像过程中各种因素的影响,同一矿物在不同地质环境中的组分会发生变化,可能形成不完全相同的波谱曲线,因此USGS标准波谱库在一定意义上不具备普适性。研究中首先通过噪声分离变换分离出有用信号,基于纯净像元指数提取纯净像元并投影至n维可视化空间中进行分析,得出候选端元光谱曲线(孙雨等,2022b)作为参考影像光谱,建立研究区的参考影像端元波谱库(图8)。
4.3.3 矿物蚀变填图
遥感影像成像过程受传感器空间分辨率的影响,会出现大量混合像元(房森和焦淑红,2019;刘帅和邢光龙,2020)。混合像元的形成因素通常包含以下几点:①目标地物的空间分布情况、几何结构及其成分信息;②传感器自身的混合效应;③成像过程中受大气散射作用等干扰而形成的混合效应。其中,后两者为非线性效应,可以通过辐射校正来解决。前者属于线性效应,也是本文要解决的内容。混合像元分解通过计算端元组分丰度可以排除异质地类干扰(苏伟等,2015),但对于一些亚类矿物的反演具有一定的局限性。然而一些亚类的蚀变矿物如短波白云母对于成矿具有特殊的指示意义(连敦梅等,2020;田成华等,2022),本文借助构建决策树的方法来实现对云母族亚类矿物的识别。
(1)混合像元分解
此处在建立经验端元波谱库的基础上采用混合调谐匹配滤波(MTMF)的方法对区域内影像进行混合像元分解。主要思路为:将经验波谱库内的矿物波谱看作一个矢量,通过研究区域影像中每个像元的波谱曲线特征与经验波谱库内该种矿物的波谱曲线的对应程度来设置与滤波处理相应的检测器,对目标影像进行滤波处理,并且尽可能地抑制其他端元的波谱响应,使监测目标与非探测异常间的反差达到最优,另外,选取适当的阈值并进行阈值分割,以达到最优匹配。与此同时,通过混合像元分解,可以使得目标检测像元的各端元含量均为正且之和为1,从而降低了矿物的检出限,达到一个相比于其他方法较为良好的矿物蚀变探测效果。
(2)决策树分类
决策树模型通过已知的样本数据构建一棵树,除了叶子节点,其他每个节点都是一个数据集特征的划分点,将待分类数据对应的特征和节点的划分特征进行比较,从而达到一个分类的目的(陈超等,2016)。按照云母类蚀变矿物中Al、K、Na等元素富集量的不同可以将云母类矿物分为三类:钠云母、普通白云母和多硅白云母,其对应吸收特征分别位于2190 nm、2200 nm、2210~2225 nm附近(van Ruitenbeek et al.,2006;代晶晶和王润生,2013;叶发旺等,2018),对应到GF−5数据的Band292、Band293及Band294,本文主要借助这一波段吸收位置特征来推断出不同波段对应反射率的高低关系,从而构造基于这些波段不同反射率的决策树对云母类的矿物实现进一步分类,最终分类结果如图9所示。
5. 靶区圈定与野外验证
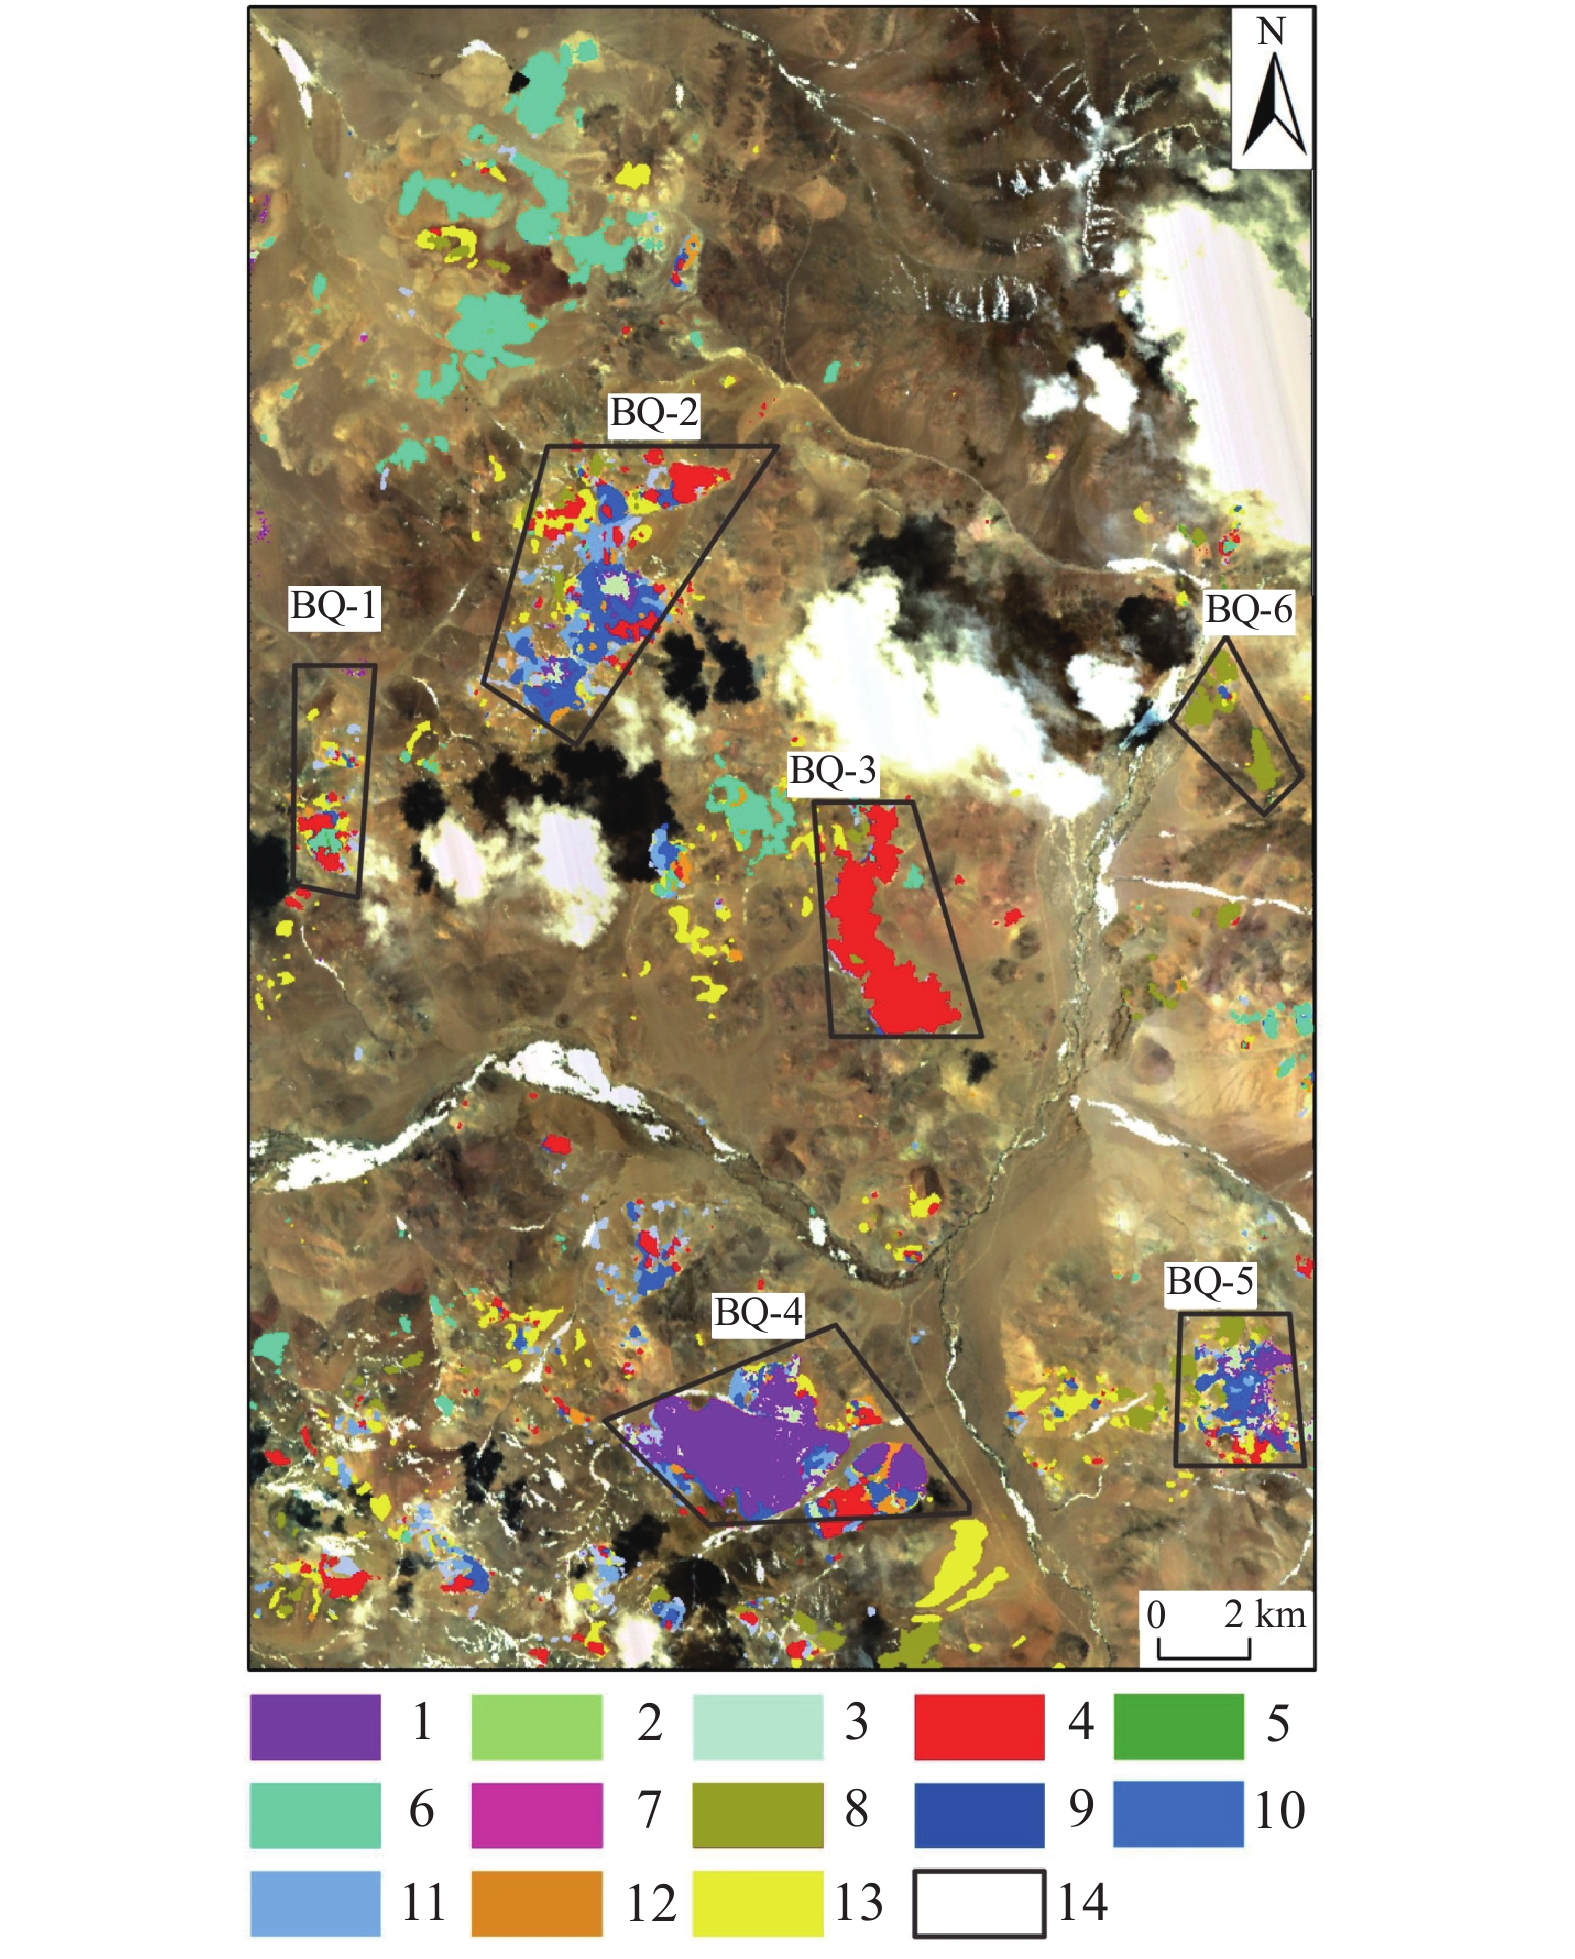
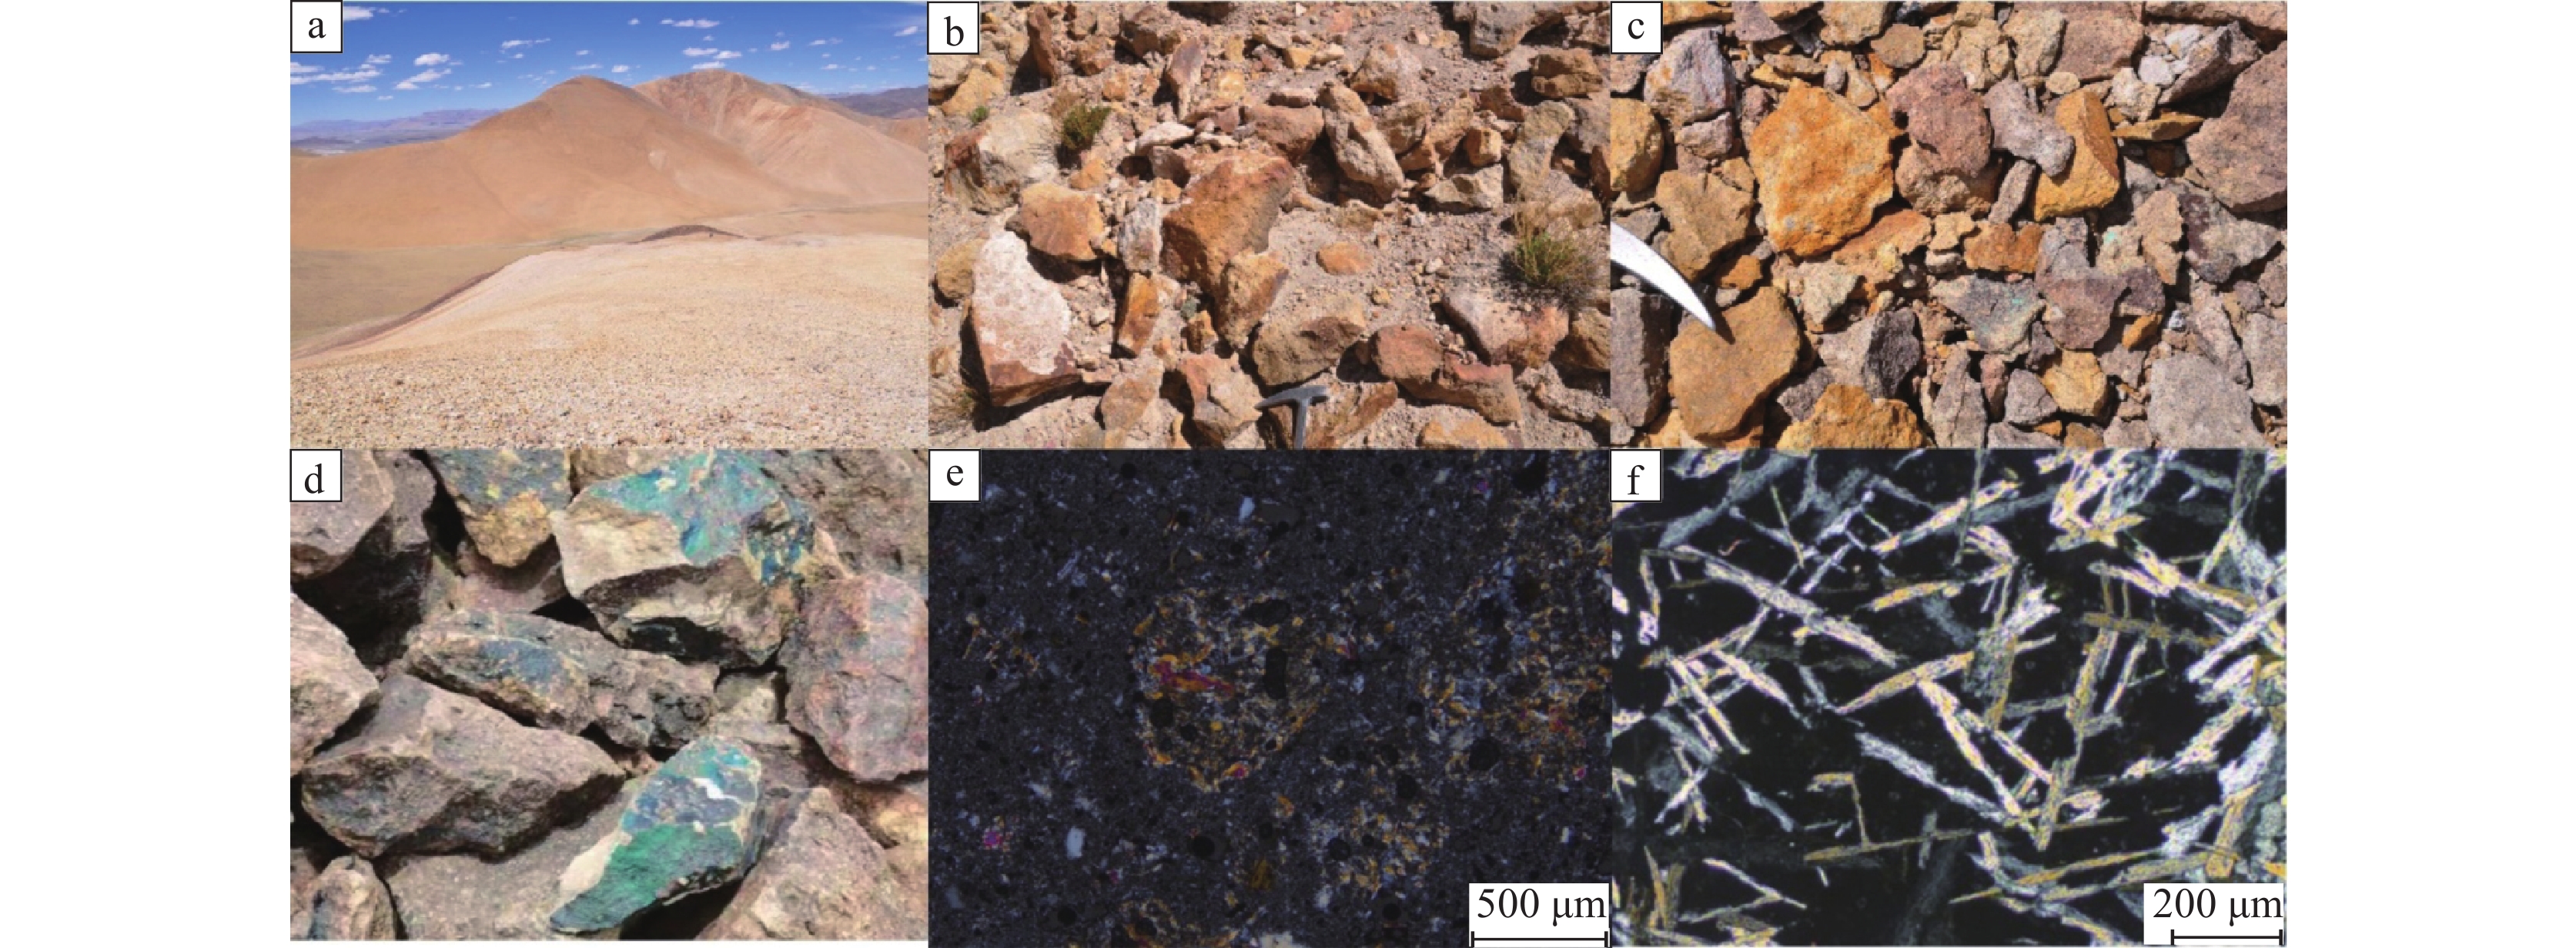
综合多光谱及高光谱蚀变矿物信息提取叠加分析结果,结合地质资料,本文圈定了6处找矿远景区,对应蚀变信息叠加及远景区圈定结果如图10所示。对所圈定的异常区BQ−2、BQ−4开展野外验证,发现野外均发育大规模褪色带与高级泥化蚀变,硅化现象严重,且地表褐铁矿化发育,与文中提取的铁染蚀变异常区域较为吻合。高级泥化区域与图中团斑状异常区域套合性较好,局部发育孔雀石化、金矿化。区域内明矾石多为中酸性火山喷出岩经过低温热液作用生成,镜下呈针状、细叶状不等,多与石英、地开石、高岭石等矿物共生(图11)。结合典型浅成低温热液矿床的围岩蚀变特征,综合蚀变信息提取结果及野外现象可推测该区域内具备发育浅成低温热液系统的可能,具有金、铜等多金属找矿潜力。
![]() 图 10 研究区蚀变信息结果及异常区分布图1—明矾石;2—方解石;3—地开石;4—普通白云母;5—绿帘石;6—高岭石;7—钠云母;8—多硅白云母;9—羟基一级;10—羟基二级;11—羟基三级;12—铁染一级;13—铁染二级;14—异常区Figure 10. Results of alteration information and anomalous area distribution1−Alunite; 2−Calcite; 3−Dickite; 4−Muscovite; 5−Epidote; 6−Kaolinite; 7−Paragonite; 8−Phengite; 9−Hydroxyl I; 10−Hydroxyl II; 11−Hydroxyl III; 12−Iron−stained I; 13−Iron−stained II; 14−Anomalous areas
图 10 研究区蚀变信息结果及异常区分布图1—明矾石;2—方解石;3—地开石;4—普通白云母;5—绿帘石;6—高岭石;7—钠云母;8—多硅白云母;9—羟基一级;10—羟基二级;11—羟基三级;12—铁染一级;13—铁染二级;14—异常区Figure 10. Results of alteration information and anomalous area distribution1−Alunite; 2−Calcite; 3−Dickite; 4−Muscovite; 5−Epidote; 6−Kaolinite; 7−Paragonite; 8−Phengite; 9−Hydroxyl I; 10−Hydroxyl II; 11−Hydroxyl III; 12−Iron−stained I; 13−Iron−stained II; 14−Anomalous areas![]() 图 11 珠勒−芒拉地区野外照片及明矾石镜下特征a—野外大规模褪色带;b、c—野外铁染蚀变异常;d—野外孔雀石化;e、f—BQ−异常区明矾石镜下特征Figure 11. Field images and microscopic characteristics of alunite in Zhule−Mangla areaa−The large−scale fade zone in the field; b, c−The iron−stained anomaly in the field; d−Malachite found in the field; e, f−Microscopic characteristics of alunite in the anomalous area BQ−4
图 11 珠勒−芒拉地区野外照片及明矾石镜下特征a—野外大规模褪色带;b、c—野外铁染蚀变异常;d—野外孔雀石化;e、f—BQ−异常区明矾石镜下特征Figure 11. Field images and microscopic characteristics of alunite in Zhule−Mangla areaa−The large−scale fade zone in the field; b, c−The iron−stained anomaly in the field; d−Malachite found in the field; e, f−Microscopic characteristics of alunite in the anomalous area BQ−46. 结 论
(1)多光谱遥感数据提取出的蚀变异常可以在一定程度上反映区域蚀变分布特征,高光谱遥感数据可在此基础上达到矿物精细识别的效果。本文基于GF−5提取出了高岭石、钠云母、普通白云母、多硅白云母、明矾石、地开石、绿帘石、方解石8种典型蚀变矿物,多源数据综合使用以达到优势互补的效果。
(2)在高光谱数据处理过程中,采取空间域统计的方法去除影像条带,在一定程度上减少了波段信息的损失量。在蚀变信息提取过程中构建了多光谱数据源蚀变信息提取指数增强蚀变,采用决策树分类法辅助混合调谐匹配滤波技术对高光谱数据进行蚀变填图。但由于环境等各种因素导致的地面像元点的混合多解性,高光谱提取蚀变信息的精度有待提升,在今后的研究中仍需进一步完善。
(3)与常规的野外地质调查相比,遥感蚀变信息提取具有便捷、高效的优势。基于多源遥感技术辅助野外地质调查,可以在一定程度上节约人力、物力,减少野外地质工作负担。综合找矿异常区的圈定结果与浅成低温热液矿床蚀变的相关理论,进一步揭示了西藏革吉南的成矿潜力,为后续找矿工作提供了理论依据。
1 ➊河北省区域地质矿产调查研究所. 2005. 1︰25万亚热幅、普兰县幅(国内部分)区域地质调查报告[R]. -
图 7 ASTER蚀变信息提取结果图
1—铝羟基一级;2—铝羟基二级;3—镁羟基一级;4—镁羟基二级;5—碳酸盐一级;6—碳酸盐二级;7—铁染一级;8—铁染二级
Figure 7. Results of alteration information extracted from ASTER
1–Aluminum hydroxyl I; 2–Aluminum hydroxyl II; 3–Magnesium hydroxyl I; 4–Magnesium hydroxyl II; 5–Carbonate I; 6–Carbonate II; 7–Iron−stained I; 8–Iron−stained II
图 10 研究区蚀变信息结果及异常区分布图
1—明矾石;2—方解石;3—地开石;4—普通白云母;5—绿帘石;6—高岭石;7—钠云母;8—多硅白云母;9—羟基一级;10—羟基二级;11—羟基三级;12—铁染一级;13—铁染二级;14—异常区
Figure 10. Results of alteration information and anomalous area distribution
1−Alunite; 2−Calcite; 3−Dickite; 4−Muscovite; 5−Epidote; 6−Kaolinite; 7−Paragonite; 8−Phengite; 9−Hydroxyl I; 10−Hydroxyl II; 11−Hydroxyl III; 12−Iron−stained I; 13−Iron−stained II; 14−Anomalous areas
图 11 珠勒−芒拉地区野外照片及明矾石镜下特征
a—野外大规模褪色带;b、c—野外铁染蚀变异常;d—野外孔雀石化;e、f—BQ−异常区明矾石镜下特征
Figure 11. Field images and microscopic characteristics of alunite in Zhule−Mangla area
a−The large−scale fade zone in the field; b, c−The iron−stained anomaly in the field; d−Malachite found in the field; e, f−Microscopic characteristics of alunite in the anomalous area BQ−4
表 1 保留的波段及波长范围(共计290个波段)
Table 1 Bands remained and wavelength ranges (290 bands in total)
保留波段号(波段序号) 波长范围/nm 1~150(1~150) 390~1029 155~191(151~187) 1038~1342 202~245(188~231) 1435~1797 266~324(232~290) 1974~2463 表 2 ASTER数据Band1、3、4、8主成分得分
Table 2 Changes in principal components of band 1, 3, 4 and 8 based on ASTER data
主成分 Band1 Band3 Band4 Band8 PC1 −0.463516 −0.860375 −0.173869 −0.121149 PC2 −0.025923 0.252097 −0.774868 −0.579098 PC3 0.885530 −0.442635 −0.125650 −0.064204 PC4 −0.017808 0.016595 −0.594610 0.803646 表 3 ASTER数据Band7、8、9主成分得分
Table 3 Changes in principal components of band 7, 8 and 9 based on ASTER data
主成分 Band7 Band8 Band9 PC1 −0.628682 −0.557667 −0.542002 PC2 −0.759775 0.291838 0.581010 PC3 0.165833 −0.777070 0.607175 -
[1] Chen Chao, He Chunxiao, Shi Shanqiu, Zhou Shaoguang. 2016. Research on remote sensing images classification based on decision tree[J]. Geospatial Information, 14(8): 50−51, 60, 5 (in Chinese with English abstract).
[2] Chen Q, Zhao Z F, Zhou J Xi, Zhu R F, Xia J S, Sun T, Zhao X, Chao J Q. 2022. ASTER and GF−5 satellite data for mapping hydrothermal alteration minerals in the Longtoushan Pb−Zn deposit, SW China[J]. Remote Sensing, 14(5): 1253. doi: 10.3390/rs14051253
[3] Dai Jingjing, Wang Runsheng. 2013. Spectral characteristics of typical transparent mineral groups[J]. Geological Science and Technology Information, 32(2): 8−14 (in Chinese with English abstract).
[4] Fang Caili, Zhao Yaliang. 2012. Research on destriping algorithm for hyperspectral images[J]. Computer Engineering and Applications, 48(12): 158−162 (in Chinese with English abstract).
[5] Fang Sen, Jiao Shuhong. 2019. Multi−endmember hysperspectral image unmixing based on group optimization[J]. Applied Science and Technology, 46(6): 20−24, 52 (in Chinese with English abstract).
[6] Gao Ke, Song Yang, Liu Zhibo, Yang Huanhuan, Lin Bin, Li Faqiao. 2024. Constraints on metallogenic age from cryptoexplosive breccia in Naruo Cu(Au) deposit, Xizang[J]. Geology in China, 51(2): 385−398 (in Chinese with English abstract).
[7] Gao Yang, Xi Ge, Chen Chun Xia, Xiu Liancun, Zheng Zhizhong, Yan Peisheng, Dong Jinxin, Yan Baikun, Liu Jiahang, Zhao Yuhao, Yu Zhengkui. 2023. The application of a small airborne hyperspectral imaging spectrometer on remote sensing geology and lithology interpretation in alpine canyon regions[J]. Geology in China, 50(4): 1032−1043 (in Chinese with English abstract).
[8] Guha A, Saw A K, Mukherjee A, Verma C B, Kumar K V, Rao P V N, Diwakar P G. 2022. Eigen vector based analysis of Landsat OLI principal components and constrained energy minimization maps for discriminating iron enriched zones in banded iron formation (BIF) in Sidhi, Madhya Pradesh[J]. Geocarto International, 37(7): 1880−1898. doi: 10.1080/10106049.2020.1801861
[9] Huang W X, Zhang L M, Si X L, Xu H Y, Chen H Y, Li X, Zhao Y H. 2020. On−orbit performance evaluation of on−board calibration component of GF−5 visible and infrared multispectral image[J]. Acta Optica Sinica, 40(20): 2029001. doi: 10.3788/AOS202040.2029001
[10] Jain R, Sharma R U. 2019. Airborne hyperspectral data for mineral mapping in Southeastern Rajasthan, India[J]. International Journal of Applied Earth Observation and Geoinformation, 81: 137−145. doi: 10.1016/j.jag.2019.05.007
[11] Jiang Qi, Dai Jingjing, Wang Denghong, Tian Shufang. 2021. Application of optical remote sensing to identifying granite pegmatite lithium deposits[J]. Mineral Deposits, 40(4): 793−804 (in Chinese with English abstract).
[12] Kumar C, Chatterjee S, Oommen T, Guha A. 2020. Automated lithological mapping by integrating spectral enhancement techniques and machine learning algorithms using AVIRIS−NG hyperspectral data in Gold−bearing granite−greenstone rocks in Hutti, India[J]. International Journal of Applied Earth Observation and Geoinformation, 86: 102006. doi: 10.1016/j.jag.2019.102006
[13] Lian Dunmei, Guo Na, Hu Zhenghua, Long Tuojiang, Yuan Shan, MiMa Wangjiu. 2020. Relationship between spectral characteristics of sericite and mineral composition and mineralization of Zhuxi Copper−Tungsten deposit in Jiangxi[J]. China Tungsten Industry, 35(5): 20−34 (in Chinese with English abstract).
[14] Liu H Z, Wu K, Xu H G, Xu Y. 2021. Lithology classification using TASI thermal infrared hyperspectral data with convolutional neural networks[J]. Remote Sensing, 13(16): 3117. doi: 10.3390/rs13163117
[15] Liu Shuai, Xing Guanglong. 2020. Multi−dimensional convolutional network collaborative unmixing method for hyperspectral image mixed pixels[J]. Journal of Geodesy and Geoinformation Science, 49(12): 1600−1608 (in Chinese with English abstract).
[16] Liu Tingyue, Dai Jingjing, Zhao Yuanyi, Tian Shufang, Ye Chuanyong. 2021. Remote sensing inversion of lithium concentration in salt lake using LightGBM: A case study of northern Zabuye salt lake in Tibet[J]. Acta Geologica Sinica, 95(7): 2249−2256 (in Chinese with English abstract).
[17] Lü Xinbiao, Zhu Jiang, Cao Xiaofeng, Chen Chao, Wu Chunming, Hu Qincheng. 2012. Magmatismand its metallogenetic effects duringthe Paleozoic−Triassiccontinental crustal construction in the Liuyuan area, south Beishan, NW China[J]. Geological Scienceand Technology Information, 31(5): 119−127, 135 (in Chinese with English abstract).
[18] Ouyang Yuan, Liu Hong, Li Guangming, Ma Dongfang, Zhang Linkui, Huang Hanxiao, Zhang Jinghua, Zhang Tengjiao, Liu Xiao, Zhao Yinbin, Li Fu. 2023. Mineral search prediction based on Random Forest algorithm: A case study on porphyry−epithermal copper polymetallic deposits in the western Gangdise meatallogenic belt[J]. Geology in China, 50(2): 303−330 (in Chinese with English abstract).
[19] Pi Yuanzheng, Chu Dong, Guan Xiaobin, Shen Huanfeng. 2020. Strip noise removal in GF−5 images considering the difference in land and water[J]. Journal of Remote Sensing, 24(4): 360−367 (in Chinese with English abstract).
[20] Rui Zongyao, Lu Yan, Li Guangming, Wang Longsheng, Wang Yitian. 2003. Looking forward to the prospects of porphyry copper deposits in Tibet[J]. Geology in China, 30(3): 302−308 (in Chinese with English abstract).
[21] Su Wei, Jiang Fangfang, Zhu Dehai, Zhan Junge, Ma Hongyuan, Zhang Xiaodong. 2015. Extraction of maize planting area based on decision tree and mixed−pixel unmixing methods[J]. Transactions of the Chinese Society of Agricultural Machinery, 46(9): 289−295, 301 (in Chinese with English abstract).
[22] Sun L, Khan S D, Sarmiento S, Lakshmikantha M R, Zhou H W. 2017. Ground−based hyperspectral imaging and terrestrial laser scanning for fracture characterization in the Mississippian Boone formation[J]. International Journal of Applied Earth Observation and Geoinformation, 63: 222−233. doi: 10.1016/j.jag.2017.08.008
[23] Sun Yongbin, Wang Ruijun, Wei Benzan, Wang Bing, Dong Shuangfa, Li Cunjin, Li Mingsong. 2018. The application of hyperspectral remote sensing ground−air integrated prediction method to the copper gold deposit prospecting in Kalatag area, Xinjiang[J]. Geology in China, 45(1): 178−191 (in Chinese with English abstract).
[24] Sun Yu, Liu Jiajun, Zhao Yingjun, Zhai Degao, Liu Zhenjiang, Zhang Fangfang, Qin Kai, Tian Feng, Kang Xiangyang, Pei Chengkai, Liu Pengfei. 2022a. Extraction of alteration minerals based on the airborne hyperspectral CASI−SASI data and the application to the Xiaojinwozi area in Dunhuang city, Gansu province[J]. Geology and Prospecting, 58(3): 653−664 (in Chinese with English abstract).
[25] Sun Yu, Liu Jiajun, Zhao Yingjun, Zhai Degao, Liu Zhenjiang, Zhang Yafeng, Zhang Fangfang, Tian Feng, Qin Kai. 2022b. Alteration mineral mapping based on the GF−5 hyperspectral data and its geological application: An example of the Huaniushan area in Guazhou County of Gansu Province[J]. Geology in China, 49(2): 558−574 (in Chinese with English abstract).
[26] Sun Yunzhu, Jiang Guangwei, Li Yunduan, Yang Yong, Dai Haishan, He Jun, Ye Qinghao, Cao Qiong, Dong Changzhe, Zhao Shaohua, Wang Weihe. 2018. GF−5 satellite: Overview and application prospects[J]. Spacecraft Recovery and Remote Sensing, 39(3): 1−13 (in Chinese with English abstract).
[27] Tang J X, Yang H H, Song Y, Wang L Q, Liu Z B, Li B L, Lin B, Peng B, Wang G H, Zeng Q G, Wang Q, Chen W, Wang N, Li Z J, Li Y B, Li Y B, Li H F, Lei C Y. 2021. The copper polymetallic deposits and resource potential in the Tibet Plateau[J]. China Geology, 4(1): 1−16.
[28] Tian Chenhua, Yang Liqiang, He Wenyan, Zhang Shaoying, Liu Shentai, Wu Cai. 2022. Characteristics of short wave infrared spectroscopy of sericite group minerals and their implications for exploration in the Yulong porphyry copper deposit, Tibet[J]. Sedimentary Geology and Tethyan Geology, 42(1): 40−49 (in Chinese with English abstract).
[29] Tian Qinglin, Pan Wei, Li Yao, Zhang Chuan, Chen Xuejiao, Yu Changfa. 2019. Extraction of alteration information from hyperspectral core imaging based on wavelet packet transform and weight spectral angle mapper[J]. Remote Sensing for Land and Resources, 31(4): 41−46 (in Chinese with English abstract).
[30] van Ruitenbeek F J A, Debba P, van der Meer F D, Cudahy T, van der Meijde M, Hale M. 2006. Mapping white micas and their absorption wavelengths using hyperspectral band ratios[J]. Remote Sensing of Environment, 102(3−4): 211−222. doi: 10.1016/j.rse.2006.02.012
[31] Wang Chongchang, Xue Rongrong, Zhao Shihu, Liu Shuhan, Wang Xia, Li Hongzhou, Liu Ziqin. 2021. Quality evaluation and analysis of GF−5 hyperspectral image data[J]. Geography and Geo−information Science, 37(1): 33−38, 125 (in Chinese with English abstract).
[32] Wang Xi, Cheng Sanyou, Lin Haixing, Chen Jing, Xiao Liang. 2022. Research on alteration information extraction in Saishiteng area of Qinghai based on Aster and Landsat8 data[J]. Geological Review, 68(1): 262−280 (in Chinese with English abstract).
[33] Wei Shaogang, Song Yang, Tang Juxing, Gao Ke, Feng Jun, Li Yanbo, Hou Lin. 2016. Geochronology, geochemistry and petrogenesis of quartz diorite porphyrite from the Sena copper (gold) deposit, Tibet[J]. Geology in China, 43(6): 1894−1912 (in Chinese with English abstract).
[34] Wei Xiangpo, Yu Xuchu, Fu Qiongying, Liu Bing, Xue Zhixiang. 2016. Spectral matching classification approach and experiment combined with spectral angle cosine and spectral correlation coefficient[J]. Geography and Geo−Information Science, 32(3): 29−33, 2 (in Chinese with English abstract).
[35] Ye Fawang, Meng Shu, Zhang Chuan, Xu Qingjun, Liu Hongcheng, Wu Ding. 2018. Minerageny study of high−Al, medium−Al−and low−Al sericites identified by airborne hyperspectral remote sensing technology[J]. Acta Geologica Sinica, 92(2): 395−412 (in Chinese with English abstract).
[36] 陈超, 赫春晓, 石善球, 周绍光. 2016. 一种基于决策树方法的遥感影像分类研究[J]. 地理空间信息, 14(8): 50−51,60,5. doi: 10.3969/j.issn.1672-4623.2016.08.017 [37] 代晶晶, 王润生. 2013. 常见透明矿物类波谱特征研究综述[J]. 地质科技情报, 32(2): 8−14. [38] 房彩丽, 赵雅靓. 2012. 高光谱图像条带噪声去除算法研究[J]. 计算机工程与应用, 48(12): 158−16. doi: 10.3778/j.issn.1002-8331.2012.12.032 [39] 房森, 焦淑红. 2019. 分组寻优的多端元高光谱图像解混方法. 应用科技, 46(6): 20−24, 52. [40] 高轲, 宋扬, 刘治博, 杨欢欢, 林彬, 李发桥. 2024. 西藏拿若铜(金)矿床隐爆角砾岩对成矿时代的约束[J]. 中国地质, 51(2): 385−398. [41] 高扬, 奚歌, 陈春霞, 修连存, 郑志忠, 颜培胜, 董金鑫, 闫柏琨, 柳稼航, 赵宇浩, 俞正奎. 2023. 小型机载高光谱成像仪在高山峡谷地区遥感地质岩性解译应用[J]. 中国地质, 50(4): 1032−1043. [42] 姜琪, 代晶晶, 王登红, 田淑芳. 2021. 光学遥感在识别花岗伟晶岩型锂矿床中的应用[J]. 矿床地质, 40(4): 793−804. [43] 连敦梅, 郭娜, 胡正华, 龙沱江, 袁珊, 米玛旺久. 2020. 江西朱溪铜钨矿床绢云母光谱特征与矿物成分、矿化的关系研究[J]. 中国钨业, 35(5): 20−34. [44] 刘帅, 邢光龙. 2020. 高光谱图像混合像元多维卷积网络协同分解法[J]. 测绘学报, 49(12): 1600−1608. [45] 刘婷玥, 代晶晶, 赵元艺, 田淑芳, 叶传永. 2021. 基于LightGBM的盐湖锂浓度遥感反演研究—以西藏扎布耶盐湖北湖为例[J]. 地质学报, 95(7): 2249−2256. [46] 吕新彪, 朱江, 曹晓峰, 陈超, 吴春明, 胡庆成. 2012. 北山南部柳园地区古生代−早中生代大陆地壳增生过程中的岩浆活动与成矿效应[J]. 地质科技情报, 31(5): 119−127, 135. [47] 欧阳渊, 刘洪, 李光明, 马东方, 张林奎, 黄瀚霄, 张景华, 张腾蛟, 柳潇, 赵银兵, 李富. 2023. 基于随机森林算法的找矿预测—以冈底斯成矿带西段斑岩−浅成低温热液型铜多金属矿为例[J]. 中国地质, 50(2): 303−330. [48] 皮原征, 储栋, 管小彬, 沈焕锋. 2020. 顾及水陆差异的高分五号影像条带去除[J]. 遥感学报, 24(4): 360−367. [49] 芮宗瑶, 陆彦, 李光明, 王龙生, 王义天. 2003. 西藏斑岩铜矿的前景展望[J]. 中国地质, 30(3): 302−308. [50] 苏伟, 姜方方, 朱德海, 展郡鸽, 马鸿元, 张晓东. 2015. 基于决策树和混合像元分解的玉米种植面积提取方法[J]. 农业机械学报, 46(9): 289−295, 301. [51] 孙永彬, 王瑞军, 魏本赞, 汪冰, 董双发, 李存金, 李名松. 2018. 高光谱遥感地空综合预测方法在新疆卡拉塔格地区铜金矿床找矿中的应用[J]. 中国地质, 45(1): 178−191. doi: 10.12029/gc20180115 [52] 孙雨, 刘家军, 赵英俊, 翟德高, 柳振江, 张方方, 秦凯, 田丰, 康向阳, 裴承凯, 刘鹏飞. 2022a. 航空高光谱CASI−SASI数据蚀变矿物信息提取与应用—以甘肃省敦煌市小金窝子地区为例[J]. 地质与勘探, 58(3): 653−664. [53] 孙雨, 刘家军, 赵英俊, 翟德高, 柳振江, 张亚峰, 张方方, 田丰, 秦凯. 2022b. 基于GF−5高光谱数据的蚀变矿物填图及地质应用—以甘肃省瓜州县花牛山地区为例. 中国地质, 49(2): 558−574. [54] 孙允珠, 蒋光伟, 李云端, 杨勇, 代海山, 何军, 叶擎昊, 曹琼, 董长哲, 赵少华, 王维和. 2018. “高分五号”卫星概况及应用前景展望[J]. 航天返回与遥感, 39(3): 1−13. [55] 田成华, 杨立强, 和文言, 张少颖, 刘申态, 吴才. 2022. 西藏玉龙斑岩铜矿床绢云母族蚀变矿物短波红外光谱特征及对勘查的指示意义[J]. 沉积与特提斯地质, 42(1): 40−49. [56] 田青林, 潘蔚, 李瑶, 张川, 陈雪娇, 余长发. 2019. 基于小波包变换和权重光谱角制图的岩心高光谱蚀变信息提取[J]. 国土资源遥感, 31(4): 41−46. [57] 王崇倡, 薛荣荣, 赵世湖, 刘书含, 王霞, 李鸿洲, 刘梓钦. 2021. GF−5卫星高光谱影像数据质量评价与分析[J]. 地理与地理信息科学, 37(1): 33−38, 125. doi: 10.3969/j.issn.1672-0504.2021.01.006 [58] 王曦, 程三友, 林海星, 陈静, 肖良. 2022. 基于Aster和Landsat8数据在青海赛什腾地区蚀变信息提取研究[J]. 地质论评, 68(1): 262−280. [59] 韦少港, 宋扬, 唐菊兴, 高轲, 冯军, 李彦波, 侯淋. 2016. 西藏色那铜(金)矿床石英闪长玢岩年代学、地球化学与岩石成因[J]. 中国地质, 43(6): 1894−1912. [60] 魏祥坡, 余旭初, 付琼莹, 刘冰, 薛志祥. 2016. 光谱角余弦与相关系数测度组合的光谱匹配分类方法与实验[J]. 地理与地理信息科学, 32(3): 29−33, 2. doi: 10.3969/j.issn.1672-0504.2016.03.006 [61] 叶发旺, 孟树, 张川, 徐清俊, 刘洪成, 武鼎. 2018. 航空高光谱识别的高、中、低铝绢云母矿物成因学研究[J]. 地质学报, 92(2): 395−412. doi: 10.3969/j.issn.0001-5717.2018.02.013 -
期刊类型引用(4)
1. 栾卓然,马国玺,李谦谦,吕凤军,许立风,安跃辉,袁兆宪,王丰翔,汪海城. 太行山北段赤瓦屋铜钼矿及外围地-物-化-遥综合信息找矿靶区预测. 中国地质. 2024(04): 1139-1160 .  本站查看
本站查看
2. 周子勇. 利用多源遥感影像识别准西地区达拉布特蛇绿岩带北部岩性异常带. 遥感技术与应用. 2024(04): 961-970 .  百度学术
百度学术
3. 王楠,刘治博,唐菊兴,宋扬,李宝龙,马旭东,闫徐坤,李志军,代晶晶,孙清飞,张梦虎,吕晓强,肖扬. 冈底斯成矿带西段首次发现中新世高硫化浅成低温热液型铜(金、银)矿床. 矿床地质. 2024(06): 1461-1466 .  百度学术
百度学术
4. 王平平,孔令锋,武保珠,姚虎,尹艺霖. 基于WorldView-3数据的蚀变矿物信息提取——以新疆坡北地区为例. 地质与资源. 2024(06): 770-776 .  百度学术
百度学术
其他类型引用(2)


 下载:
下载:
