
Thermochronology of the monzonitic granite related to the Hutouya Cu-Pb-Zn polymetallic deposit in Qiman Tage, Qinghai Province
-
摘要:
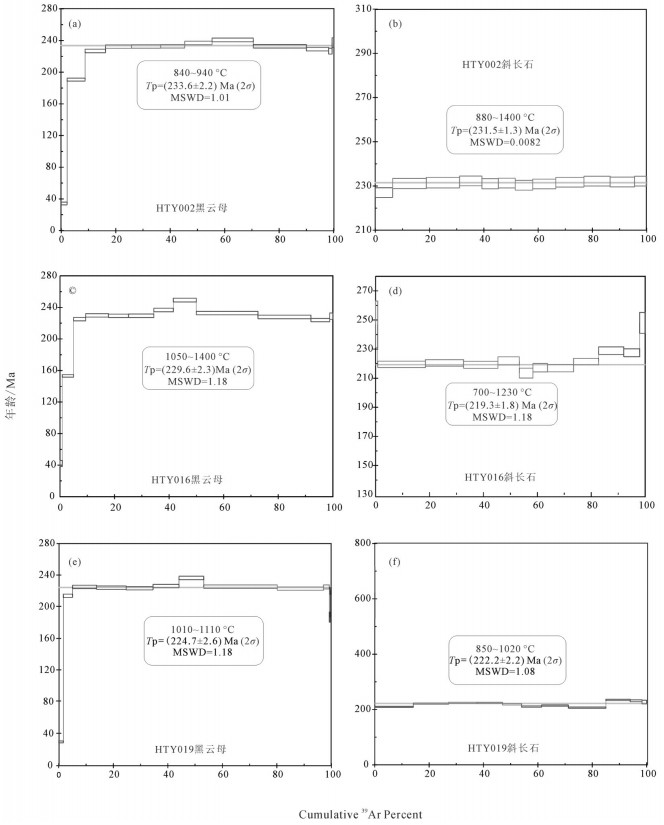
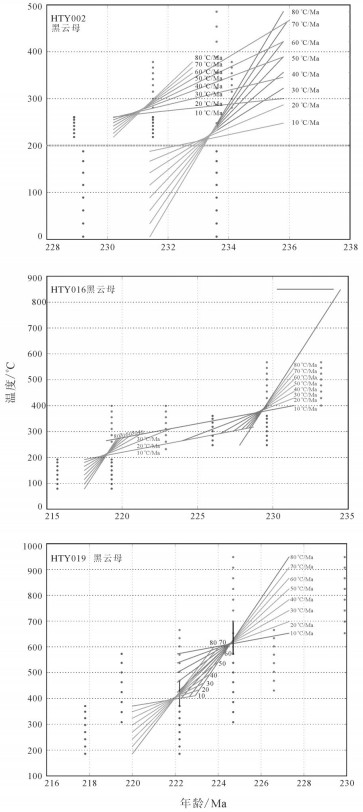
虎头崖铜铅锌多金属矿区是青海祁漫塔格地区较为典型的兼具内接触带矽卡岩亚型和外接触带矽卡岩亚型矿化的矿区,其岩浆侵入活动强烈,不同时代含碳酸盐岩的地层出露多,铁铜锡钼铅锌等金属成矿元素组合复杂,找矿潜力巨大。本次研究依据岩体热年代学理论,即岩体总能量与其规模成正比,规模愈大的岩体其热能量愈高,热效应愈大,冷速率相应愈低。冷速率通过同一岩体不同矿物的封闭温度计算得出。选取虎头崖矿区黑云母和斜长石两种矿物进行Ar-Ar年龄测定,样品HTY002黑云母和斜长石40Ar-39Ar坪年龄分别为(233.6±2.2)Ma和(231.5±1.3)Ma,样品HTY016黑云母和斜长石40Ar-39Ar坪年龄分别为(229.6±2.3)Ma和(219.3±1.8)Ma,样品HTY019黑云母和斜长石40Ar-39Ar坪年龄分别为(224.7±2.6)Ma和(222.2±2.2)Ma,计算得到二长花岗岩冷速率分别为57.14℃/Ma、11.65℃/Ma、48.00℃/Ma。当侵入岩体的成分相近时,其侵位时的单位热能可能差别很小,而岩体的总能量与其规模是成正比的,所以不同规模岩体的总能量是有差别的,规模愈大的岩体其热能量也愈高,与围岩达到平衡所需的时间愈长,热效应愈大,冷速率相应愈低。针对不同样品和不同矿物计算虎头崖矿区二长花岗岩体冷速率比较接近,其冷速率相对较快(介于11~57℃/Ma),可知其热效应较大,具有一定的成矿潜力。
Abstract:The Hutouya mining area in Qiman Tage of Qinghai Province owns the characteristics of inner-and exo-contact belt skarn subtype mineralization. The magmatic intrusive activities are strong in this area. The carbonatite formation of different ages is exposed extensively. The combination of metal metallogenic elements is complex. The potential for the ore prospecting is great. This study is based on the thermochronology theory for rock bodies. The total energy of rock bodies is proportional to its scale. The thermal energy is larger as the scale of rock bodies is larger, the thermal effect is larger as the thermal energy is larger, and the cooling rate is larger as the thermal effect is larger. The cooling rate is calculated via the closure temperature of different minerals. The authors studied Ar-Ar ages of biotite and plagioclase from the Hutouya mining area. The 40Ar-39Ar plateau ages of biotite and plagioclase from the HTY002 monzonitic granite sample related to mineralization are 2(33.6 ±2.2) Ma and (231.5 ±1.3) Ma, respectively. The 40Ar-39Ar plateau ages from the HTY016 sample are (229.6±2.3) Ma and (219.3±1.8) Ma, respectively. The 40Ar-39Ar plateau ages of the HTY019 sample are (224.7±2.6) Ma and (222.2±2.2) Ma, respectively. The calculated cooling rates are 57.14℃/Ma, 11.65℃/Ma, and 48.00℃/Ma. Where the compositions of the intrusive rocks are similar, the differences of the unit thermal energies of their emplacement are very small. Because the total energy of rock bodies is proportional to its scale, the total energies of rock bodies of different scales are different. The thermal energy of large rock bodies is large, the time of balance with the surrounding rock is long, the thermal effect is large, and the cooling rate is low. The cooling rates of different minerals from the Hutouya mining area are similar. The values of the cooling rates are high, varying from 11 to 57℃/Ma, so the thermal effect is large. It is thus concluded that the potential for the ore prospecting is great in the Hutouya mining area.
-
1. 引言
石泉–旬阳金矿带整装勘查区7个图幅区1∶50 000水系沉积物测量始于2013年(图1),其中饶峰幅、迎丰街幅和安康幅1∶50 000水系沉积物测量由中国地质调查局发展研究中心2016—2018年组织实施;铁佛寺幅、汉阴幅、大河口幅和赵家湾幅1∶50 000水系沉积物测量由中国地质调查局西安地质调查中心2013—2015年组织实施,承担单位均为陕西地矿第一地质队有限公司。
陕西石泉–旬阳金矿带整装勘查区位于秦岭造山带中部的南秦岭构造带,在漫长地质历史演化中,该区地层经历了多期变形,构造样式以褶皱、滑脱和韧性剪切带最为典型。地层区划隶属于华南地层大区中的牛山地层小区(韩芳林等,2013)(图2)。因盖层与基底间拆离滑脱,以出露滨海环境下形成的震旦纪—早古生代黑色浅变质强变形细碎屑岩系建造最为典型(张复新等,2009;唐永忠等,2012)。区内出露地层有古元古代杨坪岩组、耀岭河岩组中基性火山岩,古生代沉积—浅变质岩,中晚志留世—早泥盆世沉积地层发育不全(刘国惠和张寿广,1993)。
石泉–旬阳金矿带整装勘查区1∶50 000水系沉积物测量从2013年7月份编写项目设计书开始,各项工作均按相关技术要求执行。项目总体按三个阶段进行,第一阶段组织地球化学勘查技术人员进行1∶50 000水系沉积物测量采样工作;第二阶段检查、核对、整理和处理数据,圈定地球化学异常;第三阶段编制地球化学系列图件,建立完善石泉–旬阳金矿带整装勘查区的区域地球化学数据库,筛选并进行异常查证工作。
陕西石泉–旬阳金矿带整装勘查区水系沉积物测量原始数据集元数据简表见表1。
表 1 数据库(集)元数据简表条目 描述 数据库(集)名称 陕西石泉–旬阳金矿带整装勘查区饶峰幅等7个图幅区1∶50 000水系沉积物测量原始数据集 数据库(集)作者 谈 乐,陕西地矿第一地质队有限公司
张永强,陕西地矿第一地质队有限公司
刘小朋,陕西地矿第一地质队有限公司
李小明,陕西地矿第一地质队有限公司
王才进,陕西地矿第一地质队有限公司数据时间范围 2013—2018年 地理区域 陕西省石泉县–旬阳县地区 数据格式 *.xlsx 数据量 2.01MB 数据服务系统网址 http://dcc.cgs.gov.cn 基金项目 中国地质调查局地质调查项目(121201004000150017-53、121201004000160901-54、121201004000172201-45、12120113048100) 语种 中文 数据库(集)组成 数据集为Excel表格,包括7个独立的工作表(sheet),分别为“饶峰幅采样点位及元素分析结果表”、“铁佛寺幅采样点位及元素分析结果表”、“汉阴幅采样点位及元素分析结果表”、“大河口幅采样点位及元素分析结果表”、“赵家湾幅采样点位及元素分析结果表”、“迎丰街幅采样点位及元素分析结果表”、 “安康幅采样点位及元素分析结果表” 2. 野外工作方法
2.1 方法选择
勘查区属湿润−半湿润中低山丘陵自然景观区(樊会民和李方周,2013),湿润、多雨、强剥蚀、深切割,以物理风化为主,沟系冲、洪积物具粗岩屑性质(刘劲松等,2016),适宜开展水系沉积物测量。根据《地球化学普查规范(1∶50 000)》(DZ/T 0011−2015),结合勘查区地球化学景观特点,确定本次地球化学普查采样介质为水系沉积物,采样密度4~8点/km2,样品粒级选择−20目~+60目。
2.2 样品采集
2.2.1 采样部位
勘查区1∶50 000水系沉积物测量采样部位均选择在河沟底部或河岸与水面接触处(张源等,2018)。在间歇性水流地区或主干河道中,主要在河床底部采样;在水流湍急的河道中选择在水流变缓处、水流停滞处、转石背后、水流由窄变宽处,以及河道转弯内侧有较多细粒物质聚集处采样。
2.2.2 采样物质
采样介质以代表原生地质找矿信息的基岩物质成分为原则,采样物质为水系沉积物中的淤泥、粉砂或细砂。
2.2.3 采样方法
勘查区水系沉积物所采集的样品为粗−细粒级混合的粒级段,有效地避开了腐植层取样,样品采集过程中,加强了对蚀变−矿化强烈或重点找矿地段的加密采样工作。采用的具体技术方法如下:
①采样前,先用采样勺拨去地表浮土或腐植层,再进行取样。
②每次装袋前,首先检查布样袋,看是否有开线或破洞。含水样品装袋时先用塑料袋分装后再装入布样带中,防止袋内水分相互淋滤造成湿样互相污染。
③为了提高样品的代表性,样品采集均在采样点位上下游20~30 m范围内3~5处多点采集,组合成一件样品。
④样品采集避开了矿山开发、村镇、水坝、淤地造田、交通要道和路口造成的污染物及岸边崩塌堆积物地段。
2.2.4 野外定点
陕西石泉–旬阳金矿带整装勘查区涉及1∶50 000图幅共7幅(表2),图幅坐标系采用1980西安坐标系,中央经线为111°,图幅涉及地理数据均在陕西地理信息测绘局购买。
表 2 陕西石泉−旬阳金矿带整装勘查区涉及的7幅1∶50 000地形图图幅名称 图幅号 饶峰幅 I49E17001 迎丰街幅 I49E18002 铁佛寺幅 I49E18003 汉阴幅 I49E19003 大河口幅 I49E19004 赵家湾幅 I49E19005 安康幅 I49E02005 用1∶50 000标准地形图作为水系沉积物测量野外工作手图,采用手持IGS-100掌上机(李超岭等,2002)结合地形图进行野外定点。定点实际距离误差均小于30 m,即在手图上均小于1 mm。
2.3 采样点密度
本次共采集水系沉积物样品13 169件。根据勘查区地形地貌特点、景观条件、地质特征,本次1∶50 000水系沉积物测量分别采用了不同的采样布局和采样密度:加密区(即指1∶200 000化探异常明显、矿化信息相对较多、基岩面积大、第四系分布面积较少的地区,除正常布点外,成矿有利地段适当加密)采样密度为5.18~5.46点/km2;一般工作区(即指第四系分布面积相对较多,基岩出露面积小或零星,1∶200 000化探异常弱的地区)采样密度为:4.1~4.3点/km2;放稀区(即山间盆地)采样密度为3.13~3.52点/km2。该采样密度组合可有效地控制工作区内绝大多数汇水面积,经济实用,可有效地达到地球化学普查的目的。
2.4 样品加工
样品加工基本流程为:自然干燥→揉碎→过筛→混匀→称量缩分→填写标签→装袋→填写送样单→装箱(陈玉明和陈秀法,2018)。
样品干燥方式采取日晒风干。干燥过程中及时揉搓样品,防止结块,并用木槌适当敲打。
② 样品干燥后过−20目~+60目尼龙筛,对筛下样品用对角线折叠法混匀,缩分后装入纸样袋中,其重量均≥310 g。
③按样品缩分法将加工好的样品缩分成两份各≥150 g,一份装牛皮纸袋送检,另一份装塑料瓶封装当副样留存。
3. 样品分析测试方法
样品分析测试工作先后由具备岩矿测试甲级资质的自然资源部西安矿产资源监督检测中心和陕西地矿局汉中地质大队有限公司实验室承担,严格执行《地球化学普查(比例尺1∶50 000)规范样品分析技术的补充规定》。
3.1 实验室样品加工与制备
实验室配备有专职样品管理人员,负责样品的验收和保管,并严格按照规范要求办理样品交接手续。
以50件样品为一个分析批次进行编码和样品加工,每一个分析批次中随机插入4个国家一级标准物质,然后进入计算机,打印出分析号与送样号的对照表,以供样品管理人员在管理样品、填写汇总表等准备工作中使用,样品随后由样品管理人员下达至碎矿间进行无污染碎样。
化探样品在加工前均在60℃以下充分烘干。在大批量样品加工前,先对岩屑样分别进行玛瑙球数量、球磨时间的最佳条件试验,使其细磨后样品粒度满足1∶50 000区域地球化学调查的要求为原则。要求细磨加工后样品粒度达到−0.074 mm(−200目)占90%以上。
样品管理人员对每批样品的加工粒度是否达到规定要求进行检查;检查合格后,按规定插入指定的监控样及国家一级标样,同时依照密码编号分出内检样,随后交由质量管理人员下达分析任务。
3.2 分析项目及分析方法
根据项目任务书、合同书及总体设计要求,2013—2015年度 1∶50 000水系沉积物测量分析项目为:Au、Ag、Cu、Pb、Zn、As、Sb、Hg、V、Mo、Ti、W共12种元素。2016—2018年度1∶50 000水系沉积物测量分析项目为Au、Ag、Cu、Pb、Zn、As、Sb、Hg、Bi、Sn、W、Mo、Cd、Co、Cr、Ni共计16种元素。
采用光栅光谱仪(OES)、原子荧光仪(AFS)、等离子质谱仪法(ICP-MS)、发射光谱法(GF-AAS)等仪器进行分析测试,所有元素报出率均为100%。勘查区18种元素分析测试方法配套方案见表3。
表 3 勘查区18种元素分析方法、检出限及报出率统计表分析方法 元素含量 1∶50 000地球化学测量规定检出限 所用方法检出限 报出率(%) GF-AAS w(Au)/10−9 0.3~1 0.23 100 F-AAS w(Cu)/10−6 2 1.00 100 w(Zn)/10−6 20 5.00 100 HG-AFS w(As)/10−6 0.5~1 0.20 100 w(Sb)/10−6 0.3 0.05 100 CV-AFS w(Hg)/10−9 10~50 2.00 100 w(Bi)/10−6 0.3 0.1 100 ICP-OES w(Ti)/10−6 100 9.3 100 w(V)/10−6 20 5 100 OES w(Ag)/10−6 0.050 0.019 100 w(Sn)/10−6 2 0.5 100 ICP-MS w(Pb)/10−6 5~10 0.91 100 w(W)/10−6 1 0.048 100 w(Mo)/10−6 1 0.056 100 w(Ni)/10−6 1 0.21 100 w(Co)/10−6 1 0.10 100 w(Cr)/10−6 10 1.00 100 w(Cd)/10−6 0.2 0.02 100 4. 数据样本描述
石泉–旬阳金矿带整装勘查区饶峰幅等7个图幅1∶50 000水系沉积物测量原始数据集为Excel表格型数据,包括7个独立的工作表(sheet),分别为“饶峰幅水系沉积物测量采样点位及元素分析结果表”、“迎丰街幅水系沉积物测量采样点位及元素分析结果表”、“铁佛寺幅水系沉积物测量采样点位及元素分析结果表”、“汉阴幅水系沉积物测量采样点位及元素分析结果表”、“大河口幅水系沉积物测量采样点位及元素分析结果表”、“赵家湾幅水系沉积物测量采样点位及元素分析结果表”、“安康幅水系沉积物测量采样点位及元素分析结果表”(宋相龙等,2017)。每个工作表(sheet)包含如下内容:样品编号、高斯坐标、图幅号、地层、分析结果(铁佛寺幅、大河口幅、汉阴幅、赵家湾幅分析元素为Au、Hg、Ag、Cu、Pb、Zn、Mo、As、Sb、Ti、V、W;迎丰街幅、饶峰幅、安康幅分析元素为Au、Ag、Cu、Pb、Zn、As、Sb、Hg、Bi、Sn、W、Mo、Cd、Co、Cr、Ni)、备注。数据结构见表4。
表 4 陕西石泉−旬阳金矿带整装勘查区水系沉积物测量数据结构表序号 数据项名称 量纲 数据类型 字段长度 实例 1 样品编号 − 字符型 20 57C2 2 图幅号 − 字符型 20 I49E018002 3 地层 − 字符型 20 O3-S1b 4 高斯横坐标 − 字符型 20 255460 5 高斯纵坐标 − 字符型 20 3672075 6 经度 − 字符型 20 108°22′45″ 7 纬度 − 字浮型 20 33°08′48″ 8 Au 10−9 浮点型 20 1.03 9 Ag 10−6 浮点型 20 42 10 Cu 10−6 浮点型 20 35.9 11 Pb 10−6 浮点型 20 35.9 12 Zn 10−6 浮点型 20 83.7 13 As 10−6 浮点型 20 3.88 14 Sb 10−6 浮点型 20 2.13 15 Hg 10−9 浮点型 20 49 16 Bi 10−6 浮点型 20 0.85 17 Sn 10−6 浮点型 20 3 18 W 10−6 浮点型 20 2.14 19 Mo 10−6 浮点型 20 0.93 20 Cd 10−6 浮点型 20 0.1 21 Co 10−6 浮点型 20 22.3 22 Cr 10−6 浮点型 20 94.6 23 Ni 10−6 浮点型 20 41.9 24 Ti 10−6 浮点型 20 − 25 V 10−6 浮点型 20 − 5. 数据质量和评估
5.1 原始数据质量
铁佛寺幅、汉阴幅、大河口幅和赵家湾幅地球化学测量样品测试过程中以50件样品为一个分析批次进行编码和样品加工,每一个分析批次中随机插入4个国家一级标准物质,分别为GBW07302a、GBW07304a、GBW07309、GBW07318,对分析过程的精密度进行监控。另外随机分段加入12件国家一级标准物(每500件样品插入一次),共插入15次,对分析过程的准确度进行监控,并对样品中部分高值和低值进行了抽查分析,抽查样品数量比例为2.6%。
饶峰幅、迎丰街幅和安康幅地球化学测量样品测试过程中以50件样品为一个分析批进行编码和样品加工,共分为243批。每一个分析批次中随机插入购买于中国地质科学院地球物理地球化学勘查研究所的4个国家一级标准物质对分析过程的准确度进行监控。其中Au、Ag、Hg、Pb、Sn、As、Sb和Bi共8种元素插入GSD-10、GSD-14、GSD-18、GSD-20控制分析过程精密度;Cr、Co、Ni、Cu、Zn、Mo、Cd和W共8种元素插入GSD-8a、GSD-9、GSD-10、GSD-14控制分析过程精密度,并对样品中部分高值和低值进行了抽查分析,抽查样品数量比例为4.1%。
本次检测工作中,分析元素内检(重复样)合格率均在95.00%以上;元素报出率均达到100%;元素异常复查合格率均为97.5%以上;所选用分析方法的检出限均满足DZ/T0130.4−2006中1∶50 000化探样品标准要求。方法的精密度:对所选一级标准物质检测的△lgC平均值在(−0.099~0.099)以内。方法准确度:对所选一级标准物质检测的△lgC平均值在(−0.099~0.099)以内。所选分析方法的检出限、精密度和准确度均满足《地球化学普查(比例尺1∶50 000)规范样品分析技术的补充规定》的质量要求。
上述质量参数数据表明,本次检测的分析质量完全符合《地球化学普查(比例尺1∶50 000)规范样品分析技术的补充规定》及DZ0130.4−2006的质量要求。
5.2 成果数据库建设质量
陕西石泉–旬阳金矿带整装勘查区饶峰幅等7个图幅区1∶50 000水系沉积物测量成果数据库建设(万常选等,2009)均按照化探数据模型采用DGSS软件平台实现(庞健峰等,2017),样品中各分析元素属性结构均参照中国地质调查局固体矿产勘查数据库内容与结构(左群超等,2018;李超岭等,2013)填写,数据结构内容完整齐全。所形成的7幅1∶50 000水系沉积物测量数据库已由中国地质调查局西安地质调查中心及中国地质调查局发展研究中心专家评审验收,评分93分,评为“优秀级”,已完成相关数据库汇交。
6. 结论
本次数据集工作区范围是由中国地质调查局西安地质调查中心与中国地质调查局发展研究中心组织实施的陕西石泉–旬阳金矿带整装勘查区内饶峰幅等7幅图3 010 km2 1∶50 000水系沉积物测量工作,是陕西石泉–旬阳金矿带整装勘查区内首次系统性的采用统一采样方法、分析测试方法、统一分析元素,也是本整装勘查区内首次规范化建立地球化学数据库,获得了珍贵的第一手地球化学测量资料。
本数据集成果指导在整装勘查区内圈定金找矿靶区10处,金成矿远景区12处❶,其中在圈定的陕西省汉阴县双河口一带金找矿靶区内新发现坝王沟金矿点,通过后期省地勘基金投入,金(333+334)资源量30吨;在圈定的陕西省安康市汉滨区将军山一带金找矿靶区内新发现早阳金矿点,通过后期省地勘基金投入,金(333+334)资源量20吨。另外运用本数据集成果新发现4处金矿点,分别为陕西省宁陕县堰沟金矿点、陕西省安康市汉滨区柳坑金矿点、陕西省石泉县石桥金矿点、陕西省石泉县栈房金矿点,均有一定的找矿潜力。另外,本数据集成果指导我省找到2~4处新的大型金矿产资源开发基地。
注释:
❶张永强, 孙健, 谈乐. 2018. 陕西石泉−旬阳金矿带整装勘查区矿产调查与找矿预测2016—2018年子项目总成果报告[R]. 安康:陕西地矿第一地质队有限公司, 1−260.
1. Introduction
The measurement of 1∶50 000 stream sediments across 7 map sheets of the integrated survey area of the Shiquan-Xunyang gold zone began in 2013 (Fig. 1), of which those in the Raofeng, Yingfengjie and Ankang map sheets were organized by the Development and Research Center of China Geological Survey in 2016—2018; those in the Tiefosi, Hanyin, Dahekou and Zhaojiawan map sheets were organized by the Xi’an Center of China Geological Survey in 2013—2015, and both were conducted by the Team No.1, Shaanxi Bureau of Geology and Mineral Resources Co. Ltd..
![]() 图 1 Range for measurement of the 1∶50 000 stream sediments of the 7 Map Sheets in the Integrated Survey Area of the Shiquan-Xunyang Gold Ore Zone, Shaanxi.
图 1 Range for measurement of the 1∶50 000 stream sediments of the 7 Map Sheets in the Integrated Survey Area of the Shiquan-Xunyang Gold Ore Zone, Shaanxi.The integrated survey area of the Shiquan-Xunyang gold ore zone, Shaanxi, located at the South Qinling tectonic zone in the midst of the Qinling orogeny, has experienced multi-stage deformations in its long history of geological evolution, where the typical tectonic patterns are folding, detachment and ductile shearing zones. In terms of stratigraphic regionalization, it belongs to the Niushan stratigraphic sub-region of the South China stratigraphic super-region (Han FL et al., 2013) (Fig. 2). Due to decoupling detachment between the overlying strata and basement, the outcrop in the area is characterized by the formation of Sinian−early-Paleozoic, black, low-metamorphic, strongly-deformed fine clastic rock series, which were formed in the coastal sea environment (Zhang FX et al., 2009; Tang YZ et al., 2012). The outcropped strata within the area include the Paleoproterozoic Yangpingyan Formation, the basic volcanic rock of the Yaolinghe Formation and Paleozoic sedimentary−low-metamorphic rocks, where mid- and late-Silurian−early-Devonian sedimentary strata are poorly developed (Liu GH and Zhang SG, 1993).
![]() 图 2 Schematic diagram of the stratigraphic regionalization of the Integrated Survey Area of the Shiquan-Xunyang Gold Ore Zone, Shaanxi
图 2 Schematic diagram of the stratigraphic regionalization of the Integrated Survey Area of the Shiquan-Xunyang Gold Ore Zone, ShaanxiThe measurement of the 1∶50 000 stream sediments in the integrated survey area of the Shiquan-Xunyang gold ore zone began with preparation of the project design in July 2013, all works being done in accordance with the relevant technical specifications. The project was completed in three stages: Stage 1, organization of the geochemical staff to take samples for the measurement of the 1∶50 000 stream sediments; Stage 2, checking, verifying, collating and processing data, and delineation of geochemical anomalies; Stage 3, plotting a series of geochemical maps, establishing and improving the regional geochemical database for the integrated survey area of the Shiquan-Xunyang gold ore zone, and screening and verifying anomalies.
Metadata for the measured original dataset of the stream sediments in the 7 map sheets of the integrated survey area of the Shiquan-Xunyang gold ore zone, Shaanxi, are shown in Table 1.
表 1 Metadata Table of Database (Dataset)Items Description Database (dataset) name The 1∶50 000 Original Measurement Dataset on Stream Sediments for 7 Map Sheets including the Raofeng Map in the Integrated Survey Area of the Shiquan-Xunyang Gold Ore Zone, Shaanxi Database (dataset) authors Tan Le, Team No.1, Shaanxi Bureau of Geology and Mineral Resources Co. Ltd.
Zhang Yongqiang, Team No.1, Shaanxi Bureau of Geology and Mineral Resources Co. Ltd.
Liu Xiaopeng, Team No.1, Shaanxi Bureau of Geology and Mineral Resources Co. Ltd.
Li Xiaoming, Team No.1, Shaanxi Bureau of Geology and Mineral Resources Co. Ltd.
Wang Caijin, Team No.1, Shaanxi Bureau of Geology and Mineral Resources Co. Ltd.Data acquision time 2013—2018 Geographic area Shiquan-Xunyang, Shaanxi Data format *.xlsx Data size 2.01MB Data service system URL http://dcc.cgs.gov.cn Fund project China Geological Survey Project (121201004000150017-53, 121201004000160901-54, 121201004000172201-45, 12120113048100). Language Chinese Database(dataset) composition The dataset consists of 7 separate Excel sheets: Raofeng Sampling Points and Element Analytical Result Sheet, Tiefosi Sampling Points and Element Analytical Result Sheet, Hanyin Sampling Points and Element Analytical Result Sheet, Dahekou Sampling Points and Element Analytical Result Sheet, Zhaojiawan Sampling Points and Element Analytical Result Sheet, Yingfengjie Sampling Points and Element Analytical Result Sheet and Ankang Sampling Points and Element Analytical Result Sheet. 2. Field Work Methods
2.1 Selection Method
The survey area is a humid−semihumid mid-and-low hilly natural landscape area (Fan HM and Li FZ, 2013), humid, rainy, strongly denuded, deeply cut, mainly physically-weathered, where channel-system alluvium and diluvium have the properties of coarse debris, suitable for the measurement of the stream sediments (Liu JS et al., 2016). In accordance with the Specifications of the Geochemical Reconnaissance Survey (1∶50 000)(DZ/T 0011−2015), considering the geochemical landscape features of the survey area, it was decided to use stream sediment as the medium to be sampled for this geochemical reconnaissance survey, at a sampling density of 4~8 points/km2, and –20 meshes ~ +60 meshes are selected for the sample’s grain size.
2.2 Sampling
2.2.1 Sample Location
In the survey area, samples for measurement of 1∶50 000 stream sediments are all taken from the river bottom or the contact between the riverbank and the water surface (Zhang Y et al., 2018). In intermittent or trunk river channels, samples are mainly taken from the bottom of the riverbed; in rivers with rapid flow, samples are taken at places where water flows slowly or stops, or behind a boulder, or where water flow widens, or at the inner side of the turn of the river channel, where much more fine-grained materials concentrate.
2.2.2 Sampling Materials
Following the principle that sampled media shall represent material components of bedrocks containing original geological prospecting information, sampling materials are sludge, silt or fine sand in stream sediments.
2.2.3 Sampling Methods
Samples taken from the stream sediments in the survey area are graded sections, mixing coarse−fine-grain sizes, care being taken to avoid sampling from the humus layer. During sampling, an emphasis was placed on taking more samples at places where alteration−mineralization is strong, or which are priorities for prospecting. Samples are taken using the specific technique below:
① Prior to sampling, the topsoil or humus layer is removed with a sampling spoon.
② The cloth bag used for housing samples is checked to ensure that it does not have split seams or broken holes before placing samples within it. Before putting moist samples in the bag, they were placed in a plastic bag and then in the cloth bag, to prevent samples from becoming wet and contaminated, due to mutual leaching.
③ To make samples more representative, samples were taken at multiple points of 3~5 places 20~30 m within upstream and downstream of the sampling points and then combined into one sample.
④ Sampling avoids locations where there are pollutants and accumulated collapses at the bank due to mine development, villages and towns, dams, field-making from silty land, traffic route or road junctions.
2.2.4 Point Fixation in the Field
The integrated survey area of the Shiquan-Xunyang gold ore zone, Shaanxi, involves seven 1∶50 000 map sheets (Table 2) in which the 1980 Xi’an coordinate system is used and the central meridian is 111°, and geological data involved in the map sheets were purchased from the Shaanxi Geographic Information Survey Bureau.
表 2 Topographic map of seven 1∶50 000 Map Sheets involved in the Integrated Survey Area of the Shiquan-Xunyang Gold Ore Zone, ShaanxiMap sheet name Map sheet number Raofeng I49E17001 Yingfengjie I49E18002 Tiefosi I49E18003 Hanyin I49E19003 Dahekou I49E19004 Zhaojiawan I49E19005 Ankang I49E02005 The 1∶50 000 standard topographic map is used as a base map for field measurement of the stream sediments to determine the sampling points in the field with a hand-held IGS-100 device (Li CL et al., 2002). Errors in point localization were less than 30 m from their actual locations, i.e. less than 1 mm on the base map.
2.3 Density of Sampling Points
During the project there were 13 169 samples in total taken from stream sediments. Based on topographic and landform characteristics, landscape conditions and geological features, for the measurement of these 1∶50 000 stream sediments, different sampling layouts and densities were used: at the densest area (i.e. referring to areas where at 1∶200 000 a geochemical anomaly is obvious, there was more information on mineralization, larger in the bedrock area and distributed with less Quaternary strata, and in addition to normal point arrangements, sampling in sections favoring metallogenesis are undertaken to the standard density), the sampling density was 5.18~5.46 points/km2; at the ordinal work area (i.e. referring to areas where there are more Quaternary strata, smaller or sporadic outcropped bedrocks, and the 1∶200 000 geochemical anomaly is weak), the sampling density was 4.1~4.3 points/km2; at the scattered area (i.e. intermountain basin), the sampling density was 3.13~3.52 points/km2. The combination of these sampling densities allows the effective control of the vast majority of water catchment within the area, which is cost-effective and enables the effective meeting of the goal of the geochemical reconnaissance survey.
2.4 Sample Processing
The basic procedure to process samples: natural drying → trituration →sieving →mixing evenly → weighing and splitting samples →fillling in the label → placing samples into bags → completing the sample delivery order → placing sampled bags into boxes (Chen YM and Chen XF, 2018).
Sample drying method: dried under sunlight and air. During drying, rub and knead samples regularly to prevent caking, and use a mallet to strike them properly,
② Dried samples were sieved with a −20~+60 mesh nylon sieve, samples under the sieve are mixed evenly through diagonal folding, split and then put into paper bags, their weight being ≥ 310 g.
③ Samples processed by sample splitting were divided into two parts, each part ≥ 150 g, one put into a kraft paper bag and sent for testing, and the other placed into plastic bottles, which were then sealed and kept as duplicate samples.
3. Sample Analysis and Testing
Samples were analyzed and tested by the Xi’an Center for Mineral Resource Supervision and Testing under the Ministry of Natural Resources and a laboratory of the Hanzhong Geological-Battalion Co., Ltd. under the Shaanxi Bureau of Geology and Mineral Resource, both of which possess Qualification A for rock and mineral testing, in strict accordance with the Additional Rules for Regulating Sample Analysis Technologies of Geochemical Reconnaissance Surveys (Scale: 1∶50 000).
3.1 Processing and Preparation of Lab Samples
Labs are provided with full-time staff to manage samples, receive, inspect and care for samples, as well as handle sample handover procedures strictly in accordance with requirements in the specifications.
The samples were coded and processed as an analytical batch of 50, each analytical batch also containing 4 randomly inserted level-1 national standard substances, the data sent to a computer to print out a comparison table showing the respective numbers of samples analyzed and those delivered, which was then used by sample management staff in tasks such as managing samples and filling in the summary tables, and samples were subsequently sent by the sample management staff to the ore-crushing room where they were crushed without contamination.
Geochemical samples must be fully dried at a temperature below 60℃ prior to processing. Before massive sample processing, debris samples should be tested for the best conditions for agate ball numbers and ball-milling time so that the particle size of the finely-ground samples meets the requirement for the 1∶50 000 regional geochemical survey, that finely-ground samples with particle size reaching –0.074 mm (–200 mesh) accounted for at least 90% of the sample.
The sample management staff checked whether each processed batch of samples met the requirement for particle size; inserted designated control samples and Level-1 national standard samples into acceptable batches as required, whilst separating inner inspection samples based on their codes and numbers, and then delivering them to quality management staff to assign analysis tasks.
3.2 Items Analyzed and Analytical Methods
According to the Project Task, Contract and General Design Specification, in 2013—2015, the items to be analyzed during the measurement of the 1∶50 000 stream sediments were the 12 elements: Au, Ag, Cu, Pb, Zn, As, Sb, Hg, V, Mo, Ti and W. In 2016—2018, the items to be analyzed for measurement of the 1∶50 000 stream sediments totalled 16 elements: Au, Ag, Cu, Pb, Zn, As, Sb, Hg, Bi, Sn, W, Mo, Cd, Co, Cr and Ni.
Instruments such as Optical Emission Spectrometer (OES), Atomic Fluorescence Spectrometer (AFS), Inductive Coupling Plasma-Mass Spectrometer (ICP-MS) and Graphite Furnace-Atomic Absorption Spectrometer (GF-AAS) were used in analysis and testing, and all elements reported percentages were 100%. Schemes for testing and analysis of the 18 elements in the survey area are shown in Table 3.
表 3 Analytical methods, detection limits and report percentages of the 18 elements in the survey areaAnalytical method Element content Specified detection limit for the 1∶50 000 geochemical measurement Detection limit of the method used Report percentage (%) GF-AAS w(Au)/10−9 0.3~1 0.23 100 F-AAS w(Cu)/10−6 2 1.00 100 w(Zn)/10−6 20 5.00 100 HG-AFS w(As)/10−6 0.5~1 0.20 100 w(Sb)/10−6 0.3 0.05 100 CV-AFS w(Hg)/10−9 10~50 2.00 100 w(Bi)/10−6 0.3 0.1 100 ICP-OES w(Ti)/10−6 100 9.3 100 w(V)/10−6 20 5 100 OES w(Ag)/10−6 0.050 0.019 100 w(Sn)/10−6 2 0.5 100 ICP-MS w(Pb)/10−6 5~10 0.91 100 w(W)/10−6 1 0.048 100 w(Mo)/10−6 1 0.056 100 w(Ni)/10−6 1 0.21 100 w(Co)/10−6 1 0.10 100 w(Cr)/10−6 10 1.00 100 w(Cd)/10−6 0.2 0.02 100 4. Description of Data Samples
The measured original dataset on the 1∶50 000 stream sediments in the 7 map sheets of the integrated survey area of the Shiquan-Xunyang gold ore zone contains data in Excel form, including 7 separate sheets: Raofeng Sampling Points and Element Analytical Result Sheet, Tiefosi Sampling Points and Element Analytical Result Sheet, Hanyin Sampling Points and Element Analytical Result Sheet, Dahekou Sampling Points and Element Analytical Result Sheet, Zhaojiawan Sampling Points and Element Analytical Result Sheet, Yingfengjie Sampling Points and Element Analytical Result Sheet, and Ankang Sampling Points and Element Analytical Result Sheet (Song XL et al., 2017). Each sheet contains the following: sample No., Gaussian coordinates, map sheet No., stratigraphy, analyzed result (elements analyzed in Tiefosi, Dahekou, Hanyin and Zhaojiawan map sheets are Au, Hg, Ag, Cu, Pb, Zn, Mo, As, Sb, Ti, V and W; elements analyzed in Yingfengjie, Raofeng and Ankang map sheets are Au, Ag, Cu, Pb, Zn, As, Sb, Hg, Bi, Sn, W, Mo, Cd, Co, Cr and Ni) and remarks. Dataset structure could be seen in Table 4.
表 4 Dataset structure of the measured original data of the stream sediments in the integrated survey area of the Shiquan-Xunyang gold ore zone, ShaanxiNo. Name of data item Dimension Data category Field length Real example 1 Sample No. Character type 20 57C2 2 Map sheet No. Character type 20 I49E018002 3 Stratigraphy Character type 20 O3−S1b 4 Gauss horizontal coordinate Character type 20 255460 5 Gauss vertical coordinate Character type 20 3672075 6 Longitude Character type 20 108°22′45″ 7 Latitude Character type 20 33°08′48″ 8 Au 10−9 Floating-point type 20 1.03 9 Ag 10−6 Floating-point type 20 42 10 Cu 10−6 Floating-point type 20 35.9 11 Pb 10−6 Floating-point type 20 35.9 12 Zn 10−6 Floating-point type 20 83.7 13 As 10−6 Floating-point type 20 3.88 14 Sb 10−6 Floating-point type 20 2.13 15 Hg 10−9 Floating-point type 20 49 16 Bi 10−6 Floating-point type 20 0.85 17 Sn 10−6 Floating-point type 20 3 18 W 10−6 Floating-point type 20 2.14 19 Mo 10−6 Floating-point type 20 0.93 20 Cd 10−6 Floating-point type 20 0.1 21 Co 10−6 Floating-point type 20 22.3 22 Cr 10−6 Floating-point type 20 94.6 23 Ni 10−6 Floating-point type 20 41.9 24 Ti 10−6 Floating-point type 20 25 V 10−6 Floating-point type 20 5. Data Quality and Assessment
5.1 Quality of the Original Data
In the process of analyzing and testing geochemical samples in the Tiefosi, Hanyin, Dahekou and Zhaojiawan map sheets, every 50 samples were grouped to be coded and processed as one analytical batch, each analytical batch being randomly inserted with 4 Level-1 national standard substances which were GBW07302a, GBW07304a, GBW07309 and GBW07318, in order to monitor and control the precision of the analytical process. In addition, 12 Level-1 national standard substances are added randomly in sections (once for every 500 samples) for 15 times in total, to monitor the accuracy of the analytical process, and some high and low values of samples were randomly inspected and analyzed, with 2.6% of samples receiving random inspection.
In the process of analyzing and testing geochemical samples in the Raofeng, Yingfengjie and Ankang map sheets, every 50 samples were grouped to be coded and processed as one analytical batch, 243 batches in total. Each analytical batch is randomly inserted with 4 Level-1 national standard substances purchased from the CAGS Geophysical & Geochemical Exploration Institute, in order to monitor and control the accuracy of the analytical process. Of these, to analyze the 8 elements Au, Ag, Hg, Pb, Sn, As, Sb and Bi, GSD-10, GSD-14, GSD-18 and GSD-20 were inserted to control the precision of the analytical process; to analyze the other 8 elements Cr, Co, Ni, Cu, Zn, Mo, Cd and W, GSD-8a, GSD-9, GSD-10 and GSD-14 were inserted to control the precision of the analytical process, and some high and low values of samples were randomly inspected and analyzed, with 1.4 % of samples receiving random inspection.
During this detection, the qualifying rate of element inner examination (duplicate sample) was more than 95.00%; all elements’ report percentages were 100%; the qualifying rate of element anomaly re-examination was at least 97.5%; the detection limits of analytical methods used all met the standard requirement on 1∶50 000 geochemical samples in DZ/T0130.4−2006. Precision of methods: the mean ΔlgC detected with Level-1 national standard substance was within –0.099~+0.099. Accuracy of methods: the mean ΔlgC detected with Level-1 national standard substance was within –0.099~+0.099. The detection limit, precision and accuracy of the analytical methods selected met the quality-related requirements in the Additional Rules for Regulating Sample Analysis Technologies of Geochemical Reconnaissance Surveys (Scale 1∶50 000).
Above-mentioned figures concerning quality-related parameters indicate that this examination fully complied with the quality-related requirements in the Additional Rules for Regulating Sample Analysis Technologies of Geochemical Reconnaissance Surveys (Scale 1∶50 000) and DZ0130.4−2006.
5.2 Quality in Establishing the Resulting Database
The measured results database of the 1∶50 000 stream sediments in the 7 map sheets including Raofeng on the integrated survey area of the Shiquan-Xunyang gold ore zone, Shaanxi (Wan CX et al., 2009), was set up in accordance with the geochemical data model by using the software platform DGSS (Pang JF et al., 2017), properties and structures of all the elements analysed were completed by referring to the content and structure of the CGS’s solid mineral survey database (Zuo QC et al., 2018; Li CL et al., 2013), to ensure that the data structure and content were complete and sound. The generated measurement databases of 1∶50 000 stream sediments in the 7 map sheets have been reviewed and accepted by the experts from the Xi'an Center of China Geological Survey and the Development and Research Center of China Geological Survey, scoring 93, awarded “Excellence”, and have thus been handed over.
6. Conclusions
The scope of the work area involved in this database was the measurement of the 1∶50 000 stream sediments in the 7 map sheets including Raofeng in the integrated survey area of the Shiquan-Xunyang gold ore zone, Shaanxi, organized and implemented by the Xi'an Center and the Development and Research Center of China Geological Survey, covering 3 010 km2. It is the first time that unified sampling, analytical and testing methods have been used to analyze elements in a systematic way in the integrated survey area of the Shiquan-Xunyang gold ore zone, Shaanxi. It is also the first time that a geochemical databases have been established in a standardized way in the integrated survey area, so as to obtain valuable first-hand geochemical measurement information.
With the results from the database, 10 Au prospecting target areas and 12 Au prospective areas were delineated in the integrated survey area❶, and at the newly-discovered Bawanggou Au deposit from the Au-delineated prospecting target area at and around Shuanghekou, Hanyin County, Shaanxi, with a subsequent provincial fund for geological exploration, it was found that the Au resource (333+334) was 30 tons; in the Au-prospecting target area at and around Jiangjunshan, Ankang city, Shaanxi, the Zaoyang Au deposit was recently found, and a subsequent provincial fund created for geological exploration, the Au (333+334) resource is 20 tons. In addition, 4 new gold ore occurrences were discovered in Shaanxi by using the results from this database, and they are located in Yangou, Ningshan County; Liukeng, Hanbin District, Ankang City; Shiqiao and Zhanfang, Shiquan County, all of which have a certain prospecting potential. Furthermore, the results from the database have guided Shaanxi to find 2–4 new large-scale Au resource development bases.
Notes:
❶ Zhang Yongqiang, Sun Jian, Tan Le. 2018. Comprehensive result report of sub-projects from 2016 to 2018 on mineral investigation and prospecting prediction in the integrated survey area of the Shiquan-Xunyang gold ore zone, Shaanxi[R]. Ankang: Team No.1, Shaanxi Bureau of Geology and Mineral Resources Co.Ltd., Ankang, Shaanxi, 1−260 (in Chinese).
致谢: 感谢青海省第三地质矿产勘查院提供了大量的资料和技术支持,李东生、张爱奎教授级高级工程师和何书跃高级工程师在野外工作中所给予的大力支持与帮助以及中国地质科学院地质研究所Ar-Ar同位素实验室陈文研究员、张彦副研究员、刘新宇女士完成样品的测试工作并提出了宝贵的建议。 -
![]()
图 1 东昆仑祁漫塔格及邻区构造单元图(据丰成友等,2010)
Figure 1. Tectonic unit map in Qiman Tage of eastern Kunlun and adjacent areas (after Feng Chengyou et al., 2010)
![]()
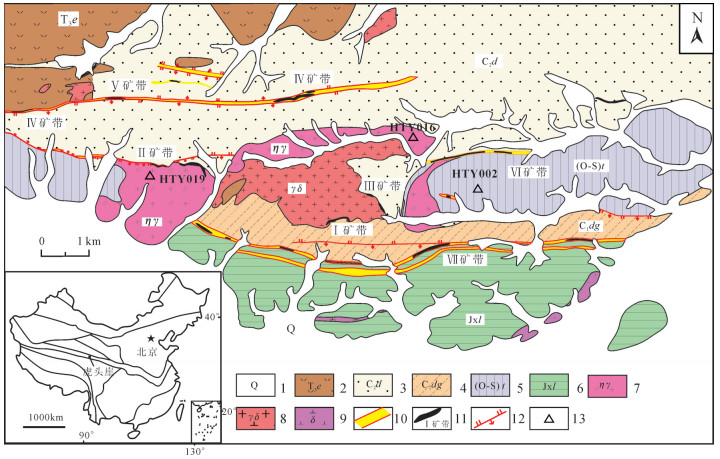
图 2 青海祁漫塔格虎头崖铜铅锌多金属矿区地质略图及采样位置(据丰成友等,2011)
1—第四系;2—上三叠统鄂拉山组;3—上石炭统缔敖苏组;4—下石炭统大干沟组;5—奥陶—志留纪滩间山群;6—蓟县系狼牙山组;7—二长花岗岩;8—花岗闪长岩;9—闪长岩;10—矽卡岩化带;11—矿带及编号;12—断裂;13—二长花岗岩样品位置
Figure 2. Geological sketch map of the Hutouya Cu-Pb-Zn polymetallic mining area in Qiman Tage, Qinghai Province, and sampling positions (after Feng Chengyou et al., 2011)
1- Quaternary; 2- Upper Triassic Elashan Formation; 3- Upper Carboniferous Diaosu Formation; 4- Lower Carboniferous Dagangou Formation; 5- Ordovician-Silurian Tanjianshan Formation; 6-Layashan Formation; 7-Monzogranite; 8- Granodiorite; 9- Diorite; 10- Skarn belt; 11- Ore belt and its serial number; 12- Fault; 13- Sampling positions of monzogranite
![]()
图 3 虎头崖矿区二长花岗岩中黑云母、斜长石40Ar-39Ar年龄谱
Figure 3. 40Ar-39Ar age spectra of biotite and plagioclase from monzogranites in the Hutouya mining area
![]()
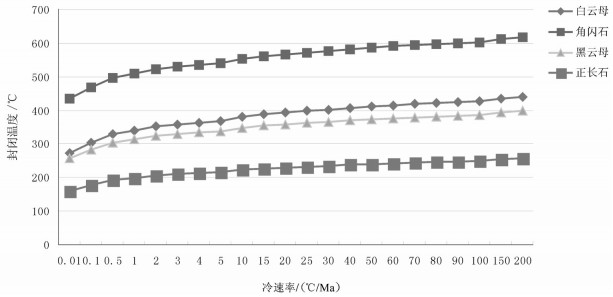
图 4 白云母、角闪石、黑云母、正长石冷速率与封闭温度关系图
Figure 4. The relationship between cooling rate and closure temperature for muscovite, hornblende, biotite, and orthoclase
![]()
图 5 虎头崖矿区含水矿物的释Ar机制图
Figure 5. Releasing Ar mechanism diagram of the hydrous minerals of the Hutouya mining area
![]()
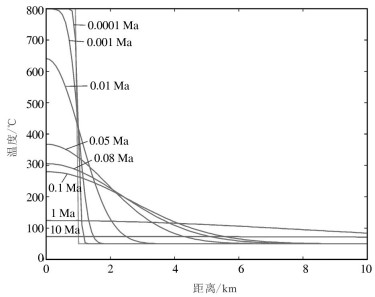
图 6 直径2 km岩株热效应演化图
Figure 6. Thermal effect evolution diagram of the diameter 2 km stock
表 1 虎头崖矿区花岗岩类岩石中黑云母和斜长石40Ar-39Ar阶段加热分析数据
Table 1 Results of 40Ar-39Ar incremental heating analytical isotope data of biotite and plagioclase from monzogranites and phlogopite in minerals of the Hutouya mining area

 下载: 导出CSV
表 2 典型含钾矿物冷速率与封闭温度对应关系
Table 2 The relationship between cooling rate and closure temperature of the typical potassium minerals
 下载: 导出CSV
表 3 虎头崖矿区Ar-Ar冷速率计算参数
Table 3 The Ar-Ar cooling rate calculating parameter of the Hutouya mining area
 下载: 导出CSV
表 4 虎头崖矿区主要成矿岩体二长花岗岩的冷速率
Table 4 Condensing rate of monzogranites in the Hutouya mining area
 下载: 导出CSV
-
Cassata W S, Renne P R. 2013. Systematic variations of argon diffusion in feldspars and implications for thermochronometry[J]. Geochimca et Cosmochimca Acta, 112:251-287. doi: 10.1016/j.gca.2013.02.030
Cermak V, Rybach L. 1982. Thermal conductivity and specific heat of minerals and rocks[C]//Angenheister G (ed. ). Landolt-Bornstein Numerical Data and Functional Relationships in Science and Technology, New Series, Group V. Springer-Verlag, Berlin, 89-134.
Chen Wen, Zhang Yan, Zhang Yueqiao, Jin Guishan, Wang Qingli. 2006. Late Cenozoic episodic uplifting in southeastern part of the Tibetan plateau-evidence from Ar-Ar thermochronology[J]. Acta Petrologica Sinica, 22(4):867-872 (in Chinese with English abstract). http://en.cnki.com.cn/Article_en/CJFDTOTAL-YSXB200604010.htm
Dodson M H. 1973. Closure temperature in cooling geochronological and petrological systems[J]. Contributions to Mineralogy and Petrology, 40:259-274. doi: 10.1007/BF00373790
Dowty E. 1980. Crystal-chemical factors affecting the mobility of ions in minerals[J]. America Mineral., 65:174-182. http://cn.bing.com/academic/profile?id=5a69a75695f29577b007fbc5a81f186c&encoded=0&v=paper_preview&mkt=zh-cn
Feng Chengyou, Li Dongsheng, Wu Zhengshou, Li Junhong, Zhang Zhanyu, Zhang Aikui, Shu Xiaofeng, Su Shunsheng. 2010. Major types' time-space distribution and metallogeneses of polymetallic deposits in the Qimantage metallogenic belt' eastern Kunlun area[J]. Northwestern Geology, 43(4):10-17 (in Chinese with English abstract). http://cn.bing.com/academic/profile?id=8d6f4893029a0759779fc0b6617d0bfc&encoded=0&v=paper_preview&mkt=zh-cn
Feng Chengyou, Wang Xueping, Shu Xiaofeng, Zhang Aikui, Xiao Ye, Liu Jiannan, Ma Shengchao, Li Guochen, Li Daxin. 2011. Isotopic chronology of Hutouya skarn-type lead-zinc polymetallic ore district in the Qimantage area, Qinghai Province, and its' geological significance[J]. Journal of Jilin University (Earth Science Edition), 41(6):1806-1817 (in Chinese with English abstract).
Ferrow E M. 1987. Mössbauer and X-ray studies on the oxidation of annite and ferriannite[J].Physical Chemistry Mineral., 14:270-275. doi: 10.1007/BF00307993
Foland K A. 1994. Argon diffusion in feldspars[C]//Parsons I(ed. ). Feldspars and Their Reactions. Dordrecht, Kluwer, 415-447.
Furlong K P, Hanson R B, Bowers J B. 1991. Modeling thermal regimes[J]. Review of Mineral, 26:437-506. http://cn.bing.com/academic/profile?id=ab1ca0cb4e22b7f021da06f05583a8b5&encoded=0&v=paper_preview&mkt=zh-cn
Giletti B J. 1974. Diffusion Related to Geochronology[M]. Geochemical Transport and Kinetics, 1-362.
Grove M, Harrison T M. 1996.40Ar* diffusion in Fe-rich biotite[J]. American Mineralogist, 81:940-951. doi: 10.2138/am-1996-7-816
Guo Xianzheng, Jia Qunzi, Li Jinchao, Kong Huilei, Li Yazhi, Xu Rongke, Nanka Ewu. 2016. Geochemical characteristics and geochronology of porphyroid biobite monzogranite from the Reshui Mo polymetallic depoist, East Kunlun Mountains[J]. Geology in China, 43(4):1165-1177 (in Chinese with English abstract). http://en.cnki.com.cn/Article_en/CJFDTOTAL-DIZI201604005.htm
Hames W E, Bowring S A. 1994. An empirical evaluation of the argon diffusiongeometry in muscovite[J]. Earth and Planetary Science Letters, 124:161-167. doi: 10.1016/0012-821X(94)00079-4
Harrison T M. 1981. Diffusion of 40Ar in hornblende[J]. Contributions to Mineralogy and Petrology, 78:324-331. doi: 10.1007%2FBF00398927
Harrison T M, McDougall I. 1981. Excess 40Ar in metamorphic rocks from Broken Hill, New South Wales:implications for 40Ar/39Ar age spectra and the thermal history of the region[J]. Earth Planet. Sc.Lett., 55(1):123-149. doi: 10.1016/0012-821X(81)90092-3
Hewitt D A, Wones D R.1975. Physical properties of some synthetic Fe-Mg-Al trioctahedral biotites[J]. American Mineralogist, 60:854-862. doi: 10.1007/BF00372150
Hodges K V, Hames W E, Bowring S A. 1994. 40Ar/39Ar age gradients in micas from a high-temperature-low-pressure metamorphic terrain——Evidence for very slow cooling and implications for the interpretation of age spectra[J]. Geology, 22:55-58. doi: 10.1130/0091-7613(1994)022<0055:AAAGIM>2.3.CO;2
Hu Xinghua, Zhu Guchang, Liu Huan, Li Zhifeng, Zheng Wei, Xu Wenhai. 2011. Characteristics and mineralization of the Hutouya polymetallic deposit in the Qimantage metallogenic belt[J]. Geology and Exploration, 47(2):216-221 (in Chinese with English abstract). http://en.cnki.com.cn/Article_en/CJFDTOTAL-DZKT201102012.htm
Jäger, Emile, Niggli E, Wenk E. 1967. Rb-Sr Altersbestimmungen an Glimmern der Zentralalpen (Rb-Sr age determinations on micas from the Central Alps):Beitragezur Geologische Karteder Schweiz[J]. NF, 134:1-67.
Lee J K W, Onstott T C, Cashman K V. 1991. Incremental heating of hornblende in vacuo:implications for 40Ar/39Ar geochronology and the interpretation of thermal histories[J]. Geology, 19:872-876. doi: 10.1130/0091-7613(1991)019<0872:IHOHIV>2.3.CO;2
Lee J K W. 1993. The argon release mechanisms of hornblende in vacuo[J]. Chemical Geology, 106:133-170. doi: 10.1016/0009-2541(93)90170-N
Li Kan, Gao Yongbao, Qian Bing, He Shuyue, Liu Yongle, Zhang Zhaowei, Zhang Jiangwei, Wang Yalei. 2015. Geochronology, geochemical characteristics and Hf isotopic compositions of granite in the Hutouya deposit Qimantag, East Kunlun[J]. Geology in China, 42(3):630-645 (in Chinese with English abstract). http://en.cnki.com.cn/Article_en/CJFDTotal-DIZI201503017.htm
Li Wenyuan. Metallogenic geologica characteristics and newly discovered orebodies in Northwest China[J]. Geology in Chian, 42(3):365-380 (in Chinese with English abstract). doi: 10.1007/s11430-010-4054-4
Liu Chengdong, Mo Xuanxue, Lui Zhaohua, Yu Xuehui, Chen Hongwei, Li Shuwei, Zhao Xin. 2004. Crust-manlte magma mixing in East Kunlun:Evidence from zircon SHRIMP chronology[J]. Chinese Science Bulletin, 49(6):596-602 (in Chinese).
Liu Yunhua, Mo Xuanxue, Yu Xuehui, Zhang Xueting, Xu Guobin. 2006. Zircon SHRIMP U-Pb dating of the Jingren granite, Yemaquan region of the East Kunlun and its geological significance[J]. Acta Petrologica Sinica, 49(6):592-602 (in Chinese with English abstract). http://cn.bing.com/academic/profile?id=ff419a1cdf034724f0a7686964616840&encoded=0&v=paper_preview&mkt=zh-cn
Lo C H, James K W, Tullis C O. 2000. Argon release mechanisms of biotite in vacuo and the role of short-circuit diffusion and recoil[J]. Chemistry Geology, 165:135-166. doi: 10.1016/S0009-2541(99)00167-9
Lovera O M, Richter F M, Harrison T M. 1989. The 40Ar/39Ar geothermometry for slowly cooled samples having a distribution of diffusion domain sizes[J]. Journal of Geophysics Research, 94:17917-17935. doi: 10.1029/JB094iB12p17917
Lovera O M, Grove M, Harrison T M. 2002. Systematic analysis of Kfeldspar 40Ar/39Ar step heating results Ⅱ:relevance of laboratory argon diffusion properties to nature[J]. Geochimca et Cosmochimca Acta, 66:1237-1255. doi: 10.1016/S0016-7037(01)00846-8
Ludwig K R. 2001. User's manual for isoplot/ex, v2.49, a geochronologica toolkit for Microsoft Excel[J]. Geochronological Center Special Publication No. la:1-58.
Luo Zhaohua, Ke Shan, Cao Yongqing, Deng Jinfu, Chen Hongwei. 2002. Late Indosinian mantle-derived magmatism in the East Kunlun[J]. Geological Bulletin of China, 21(6):292-297 (in Chinese with English abstract). http://cn.bing.com/academic/profile?id=971e3154a846747a6478f1ea1531d615&encoded=0&v=paper_preview&mkt=zh-cn
Ma Fang, Mu Zhiguo. 2002. Ar mechanism of the enhydrite under the condition of the vacuo:New questions of the Ar-Ar thermochronology[J]. Earth Science Frontiers, 9(2):505-510 (in Chinese with English abstract).
McDougall I, Harrison T M. 1999. Geochronology and Thermochronology by the 40Ar/39Ar Method (second edition)[M]. Oxford, Oxford University Press, 269.
Norwood C B.1974. Radiogenic Argon Diffusion in the Biotite Micas MS Thesis[M].RI:Brown University, 58.
Ohta T, Takeda H, Takeuchi Y.1982. Mica polytypism:Similarities in the crystal structures of coexisting 2M and 2M1 oxybiotite[J]. American Mineral., 67:298-310. https://www.researchgate.net/publication/242081869_Mica_polytypism_similarities_in_the_crystal_structures_of_coexisting_7M_and_2M1_oxYbiotite
Peacock S M.1989. Numerical constraints on rates of metamorphism, fluid production, and fluid flux during regional metamorphism[J]. Geological Society of America Bull., 101:476-478. doi: 10.1130/0016-7606(1989)101<0476:NCOROM>2.3.CO;2
Philpotts A R. 1990. Principles of Igneous and Metamorphic Petrology[M]. Prentice Hall, Englewood Cliffs.
Robbins G A. 1972. Radiogenic Argon Diffusion in Muscovite under Hydrothermal Conditions[D]. Brown University.
Roy R, Beck A, Touloukian Y. 1981. Thermo-physical properties of rocks[C]//Touloukian Y, Judd W, Roy R (eds. ). Physical Properties of Rocks and Minerals. Mc Graw-Hill, New York, 409-502.
Sletten V M, Onstott T C. 1998. The effect of the instability of muscovite during in vacuo heating on 40Ar/39Ar step-heating spectra[J]. Geochim. Cosmochim. Acta, 62:123-142. doi: 10.1016/S0016-7037(97)00323-2
Spear F S. 1993. Metamorphic Phase Equilibria and PressureTemperature-Time Paths. Mineralogical Society of America, Washington D.C. http://www.docin.com/p-740093982.html
Steiger R H, Jager E. 1977. Subcommission on geochronology:Converntion on the use of decay constants in geo-and cosmochronology[J]. Earth and Planetary Science Letters, 36:359-362. doi: 10.1016/0012-821X(77)90060-7
Stuwe K. 2002. Introduction to the Geodynamics of the Lithosphere:Quantative Description of Geological Problems[M]. SpringerVerlag, Berlin.
Taylor S R, McLennan S M. 1985. The Continental Crust:Composition and Evolution[M]. Blackwell Scientific Publication, Oxford, 1-372.
Vedder W, Wilkins R. 1969. Dehydroxylation and rehydroxylation, oxidation and reduction of micas[J]. American Mineralogist, 54:482-509.
Wei Junying and Wang Guanyu. 1988. Isotopic Geochemistry[M]. Beijing:Geological Publishing House, 1-379 (in Chinese).
Xiao Qinghui, Qiu Ruizhao, Deng Jinfu, Li Tingdong, Mo Xuanxue, Hong Dawei, Lu Xinxiang, Wang Tao, Wu Fuyuan, Xie Caifu. 2005. Granitoids and continental crustal growth modes in China[J]. Geology in China, 32(3):343-352 (in Chinese with English abstract). http://cn.bing.com/academic/profile?id=934a16e9dddcc83eaed8c8e62182e970&encoded=0&v=paper_preview&mkt=zh-cn
Zhang Bangdong, Ling Hongfei, Wu Juncai. 2013. New thinking, method and calculated examples of high temperature thermochronology of granite plutons[J]. Geological Journal of Chian Universities, 19(3):385-402 (in Chinese with English abstract). http://en.cnki.com.cn/Article_en/CJFDTotal-GXDX201303001.htm
Zheng Zhen, Chen Yanjing, Deng Xiaohua, Yun Suwei, Cheng Hongjin. 2016. Muscovite 40Ar/39Ar dating of the Baiganhu W-Sn orefield, Qimantag, Eadt Kunlun Mountains, and its geological implications[J]. Geology in China, 43(4):1341-1352 (in Chinese with English abstract). http://en.cnki.com.cn/Article_en/CJFDTOTAL-DIZI201604020.htm
陈文, 张彦, 金贵善, 王清利. 2006.青藏高原东南缘晚新生代幕式抬升作用的Ar-Ar热年代学证据[J].岩石学报, 22(4):867-872. http://mall.cnki.net/magazine/Article/YSXB200604010.htm 丰成友, 李东生, 吴正寿, 李军红, 张占玉, 张爱奎, 舒晓峰, 苏顺生. 2010.东昆仑祁漫塔格成矿带矿床类型、时空分布及多金属成矿作用[J].西北地质, 43(4):10-17. http://mall.cnki.net/magazine/Article/XBDI201004004.htm 丰成友, 王雪萍, 舒晓峰, 张爱奎, 肖晔, 刘建楠, 马圣钞, 李国臣, 李大新. 2011.青海祁漫塔格虎头崖铅锌多金属矿区年代学研究及地质意义[J].吉林在学学报:地球科学版, 41(6):1806-1817. http://www.cnki.com.cn/Article/CJFDTOTAL-CCDZ201106014.htm 国显正, 贾群子, 李金超, 孔会磊, 栗亚芝, 许荣科, 南卡俄吾. 2016.东昆仑热水钼矿区似斑状黑云母二长花岗岩元素地球化学及年代学研究[J].中国地质, 43(4):1167-1177. http://geochina.cgs.gov.cn/ch/reader/view_abstract.aspx?file_no=20160404&flag=1 胡杏花, 朱谷昌, 刘欢, 李智峰, 郑纬, 徐文海.2011.祁漫塔格矿带虎头崖多金属矿矿床特征和成矿作用分析[J].地质与勘探, 47(2):216-221. https://www.wenkuxiazai.com/doc/797acf9e6f1aff00bed51ea8.html 李侃, 高永宝, 钱兵, 何书跃, 刘永乐, 张照伟, 张江伟, 王亚磊. 2015.东昆仑祁漫塔格虎头崖铅锌多金属矿区花岗岩年代学、地球化学及Hf同位素特征[J].中国地质, 42(3):630-645. http://geochina.cgs.gov.cn/ch/reader/view_abstract.aspx?file_no=20150317&flag=1 李文渊. 2015.中国西北部成矿地质特征及找矿新发现[J].中国地质, 42(3):365-380. http://geochina.cgs.gov.cn/ch/reader/view_abstract.aspx?file_no=20150301&flag=1 刘成东, 莫宣学, 罗照华, 喻学惠, 谌宏伟, 李述为, 赵欣. 2004.东昆仑壳-幔岩浆混合作用:来自锆石SHRIMP年代学的证据[J].科学通报, 49(6):596-602. http://www.cnki.com.cn/Article/CJFDTOTAL-KXTB200406018.htm 刘云华, 莫宣学, 喻学惠, 张雪亭, 许国斌. 2006.东昆仑野马地区景忍花岗岩锆石SHRIMP U-Pb定年及其地质意义[J].岩石学报, 22(10):2457-2463. http://www.oalib.com/paper/4355897 罗照华, 柯珊, 曹永清, 邓晋福, 谌宏伟. 2002.东昆仑印支晚期幔源岩浆活动[J].地质通报, 21(6):292-297. http://www.cnki.com.cn/Article/CJFDTOTAL-ZQYD200206002.htm 马芳, 穆治国. 2002.含水矿物在真空下的释Ar机制:Ar-Ar热年代学面临的新问题[J].地学前缘, 9(2):505-510. http://www.cnki.com.cn/Article/CJFDTotal-YSXB200612021.htm 魏菊英, 王关玉. 1988.同位素地球化学[M].北京:地质出版社, 1-379. 肖庆辉, 邱瑞照, 邓晋福, 李廷栋, 莫宣学, 洪大卫, 卢欣详, 王涛, 吴福元, 谢才富. 2005.中国花岗岩与大陆地壳生长方式初步研究[J].中国地质, 32(3):343-352. http://geochina.cgs.gov.cn/ch/reader/view_abstract.aspx?file_no=20050301&flag=1 章邦桐, 凌洪飞, 吴俊奇. 2013.花岗岩体高温热年代学研究的新思路、方法及计算实例[J].高校地质学报, 19(3):385-402. http://industry.wanfangdata.com.cn/dl/Detail/Periodical?id=Periodical_gxdzxb201303001 郑震, 陈衍景, 邓小华, 岳素伟, 陈红瑾. 2016.东昆仑祁漫塔格地区白干湖钨锡矿田白云母40Ar/39Ar定年及地质意义[J].中国地质, 43(4):1341-1352. http://geochina.cgs.gov.cn/ch/reader/view_abstract.aspx?file_no=20160419&flag=1 -
期刊类型引用(6)
1. 韩双宝,周殷竹,郑焰,周金龙,李长青,韩强强,李甫成. 银川平原地下水化学成因机制与组分来源解析. 环境科学. 2024(08): 4577-4588 .  百度学术
百度学术
2. 张卓,郭华明,韩双宝,牛笑童. 沉积物中砷的赋存特征及对地下水砷富集的控制:以内蒙古河套盆地为例. 中国地质. 2024(04): 1331-1341 . 本站查看
3. 吴光伟,李浩林,王庆兵,顾莎,郭梓烽,刘中业. 鲁西北平原地下水高氟与高碘成因分析. 岩矿测试. 2023(04): 793-808 . 百度学术
4. 张卓,柳富田,陈社明. 氢氧、锶钙和锂硼同位素在高氟地下水研究中的应用. 华北地质. 2023(03): 49-56 . 百度学术
5. 李红超,单强,马丙太,赵德刚. 基于逻辑回归分析的焦化行业地下水有机污染物分布特征及影响因素研究. 华北地质. 2023(04): 47-54 . 百度学术
6. 邢世平,郭华明,吴萍,胡学达,赵振,袁有靖. 化隆—循化盆地不同类型含水层组高氟地下水的分布及形成过程. 地学前缘. 2022(03): 115-128 . 百度学术
其他类型引用(2)


计量
- 文章访问数: 2634
- HTML全文浏览量: 503
- PDF下载量: 4532
- 被引次数: 8
