
All-Element Dataset of Combined Exploration of Urban Underground Spaces with Strong Interference
-
摘要:
地下空间利用已成为解决城市发展空间问题的主要途径,地下空间精准探测是地下空间资源开发利用的基础,但城市强干扰环境下地下空间探测的原理、方法组合、采集的要素及数据应用等目前尚为难题。本数据集依托中国地质调查局陕西省重要城镇地质灾害风险评估(2013—2016)、关中-天水经济区综合地质调查(2016—2018)、西安多要素城市地质调查(2018—2021)、延安革命老区综合地质调查(2018—2021) 4个项目,面向岩土体质量评价和城市地下空间资源评价与开发利用的需要,在常规物探、钻探和实验测试基础上,引入了随钻监测技术,开展了13个参数的测井,形成了地下空间组合探测方法,获取了岩土体质量和城市地下空间评价所需的全要素数据。本数据集分别来自陕西省秦巴山地山阳县城区、关中盆地西安市城区和黄土高原延安市城区,数据包含工程地质钻探、实验测试、多参数测井、随钻监测和地面物探5种数据类型,其中工程地质钻孔144个,实验测试样品672个,物探测井13类参数111个孔,随钻监测36个孔,地面物探4类方法5条剖面,共计968组数据,3 664个文件,格式包含jpg,xls,doc,mpj,dwg。该数据集可用于岩土体质量评价、城市三维地质全要素建模、地下空间资源评价、岩土体质量与物性参数耦合关系研究,以及城市地质科学研究。
Abstract:The utilization of underground space has become a major means of solving the problems plaguing cities, and the precise exploration of underground space is fundamental to its development and utilization. However, the theories, method combination, elements to be acquired and data application regarding the exploration of urban underground space with strong interference are yet to be determined in a united manner. The all-element dataset of combined exploration of urban underground space with strong interference (also referred to as the Dataset) relies on these four projects initiated by the China Geological Survey: Risk Assessment of Geologic Disasters in Important Towns in Shaanxi Province (2013—2016), Comprehensive Geological Survey in Guanzhong – Tianshui Economic Region (2016—2018), Multi-element Urban Geological Survey in Xi’an (2018—2021) and Comprehensive Geological Survey in Yan’an, a Former Base of the Communist Party of China (2018—2021). The aim of these projects were to meet the demand for quality assessment of rock and soil masses and also the assessment, development and utilization of urban underground space. During the development of the Dataset, monitoring-while-drilling (MWD) technology was introduced based on regular geophysical prospecting, drilling and testing. Furthermore, a total of 13 parameters was logged, a combined method of underground space exploration was established and the all-element data required for quality assessment of rock and soil masses and urban underground space were obtained. The data in the Dataset were obtained from the urban area of Shanyang County, in the Qinba Mountains of Shaanxi Province, the urban area of Xi’an City in the Guangzhong Basin and the urban area of Yan’an City in the Loess Plateau. It consists of five types of data, i.e., engineering geological drilling, testing, multi-parameter logging, MWD and ground geophysical prospecting. In detail, the data were acquired from 144 engineering geological boreholes, 672 testing samples, 111 boreholes for the logging of 13 parameters by geophysical prospecting, 36 MWD boreholes and 5 profiles of ground geophysical prospecting obtained via 4 methods. In total, the Dataset consists of 968 sets of data and 3 664 files in the formats of .jpg, .xls, .doc, .mpj and .dwg. It can be applied to the quality assessment of rock and soil masses, the establishment of 3D urban geological all-element models, the assessment of underground space resources, the research on the coupling relationship between the quality and physical properties of rock and soil masses and the scientific research of urban geology.
-
1. 引言
石泉–旬阳金矿带整装勘查区7个图幅区1∶50 000水系沉积物测量始于2013年(图1),其中饶峰幅、迎丰街幅和安康幅1∶50 000水系沉积物测量由中国地质调查局发展研究中心2016—2018年组织实施;铁佛寺幅、汉阴幅、大河口幅和赵家湾幅1∶50 000水系沉积物测量由中国地质调查局西安地质调查中心2013—2015年组织实施,承担单位均为陕西地矿第一地质队有限公司。
陕西石泉–旬阳金矿带整装勘查区位于秦岭造山带中部的南秦岭构造带,在漫长地质历史演化中,该区地层经历了多期变形,构造样式以褶皱、滑脱和韧性剪切带最为典型。地层区划隶属于华南地层大区中的牛山地层小区(韩芳林等,2013)(图2)。因盖层与基底间拆离滑脱,以出露滨海环境下形成的震旦纪—早古生代黑色浅变质强变形细碎屑岩系建造最为典型(张复新等,2009;唐永忠等,2012)。区内出露地层有古元古代杨坪岩组、耀岭河岩组中基性火山岩,古生代沉积—浅变质岩,中晚志留世—早泥盆世沉积地层发育不全(刘国惠和张寿广,1993)。
石泉–旬阳金矿带整装勘查区1∶50 000水系沉积物测量从2013年7月份编写项目设计书开始,各项工作均按相关技术要求执行。项目总体按三个阶段进行,第一阶段组织地球化学勘查技术人员进行1∶50 000水系沉积物测量采样工作;第二阶段检查、核对、整理和处理数据,圈定地球化学异常;第三阶段编制地球化学系列图件,建立完善石泉–旬阳金矿带整装勘查区的区域地球化学数据库,筛选并进行异常查证工作。
陕西石泉–旬阳金矿带整装勘查区水系沉积物测量原始数据集元数据简表见表1。
表 1 数据库(集)元数据简表条目 描述 数据库(集)名称 陕西石泉–旬阳金矿带整装勘查区饶峰幅等7个图幅区1∶50 000水系沉积物测量原始数据集 数据库(集)作者 谈 乐,陕西地矿第一地质队有限公司
张永强,陕西地矿第一地质队有限公司
刘小朋,陕西地矿第一地质队有限公司
李小明,陕西地矿第一地质队有限公司
王才进,陕西地矿第一地质队有限公司数据时间范围 2013—2018年 地理区域 陕西省石泉县–旬阳县地区 数据格式 *.xlsx 数据量 2.01MB 数据服务系统网址 http://dcc.cgs.gov.cn 基金项目 中国地质调查局地质调查项目(121201004000150017-53、121201004000160901-54、121201004000172201-45、12120113048100) 语种 中文 数据库(集)组成 数据集为Excel表格,包括7个独立的工作表(sheet),分别为“饶峰幅采样点位及元素分析结果表”、“铁佛寺幅采样点位及元素分析结果表”、“汉阴幅采样点位及元素分析结果表”、“大河口幅采样点位及元素分析结果表”、“赵家湾幅采样点位及元素分析结果表”、“迎丰街幅采样点位及元素分析结果表”、 “安康幅采样点位及元素分析结果表” 2. 野外工作方法
2.1 方法选择
勘查区属湿润−半湿润中低山丘陵自然景观区(樊会民和李方周,2013),湿润、多雨、强剥蚀、深切割,以物理风化为主,沟系冲、洪积物具粗岩屑性质(刘劲松等,2016),适宜开展水系沉积物测量。根据《地球化学普查规范(1∶50 000)》(DZ/T 0011−2015),结合勘查区地球化学景观特点,确定本次地球化学普查采样介质为水系沉积物,采样密度4~8点/km2,样品粒级选择−20目~+60目。
2.2 样品采集
2.2.1 采样部位
勘查区1∶50 000水系沉积物测量采样部位均选择在河沟底部或河岸与水面接触处(张源等,2018)。在间歇性水流地区或主干河道中,主要在河床底部采样;在水流湍急的河道中选择在水流变缓处、水流停滞处、转石背后、水流由窄变宽处,以及河道转弯内侧有较多细粒物质聚集处采样。
2.2.2 采样物质
采样介质以代表原生地质找矿信息的基岩物质成分为原则,采样物质为水系沉积物中的淤泥、粉砂或细砂。
2.2.3 采样方法
勘查区水系沉积物所采集的样品为粗−细粒级混合的粒级段,有效地避开了腐植层取样,样品采集过程中,加强了对蚀变−矿化强烈或重点找矿地段的加密采样工作。采用的具体技术方法如下:
①采样前,先用采样勺拨去地表浮土或腐植层,再进行取样。
②每次装袋前,首先检查布样袋,看是否有开线或破洞。含水样品装袋时先用塑料袋分装后再装入布样带中,防止袋内水分相互淋滤造成湿样互相污染。
③为了提高样品的代表性,样品采集均在采样点位上下游20~30 m范围内3~5处多点采集,组合成一件样品。
④样品采集避开了矿山开发、村镇、水坝、淤地造田、交通要道和路口造成的污染物及岸边崩塌堆积物地段。
2.2.4 野外定点
陕西石泉–旬阳金矿带整装勘查区涉及1∶50 000图幅共7幅(表2),图幅坐标系采用1980西安坐标系,中央经线为111°,图幅涉及地理数据均在陕西地理信息测绘局购买。
表 2 陕西石泉−旬阳金矿带整装勘查区涉及的7幅1∶50 000地形图图幅名称 图幅号 饶峰幅 I49E17001 迎丰街幅 I49E18002 铁佛寺幅 I49E18003 汉阴幅 I49E19003 大河口幅 I49E19004 赵家湾幅 I49E19005 安康幅 I49E02005 用1∶50 000标准地形图作为水系沉积物测量野外工作手图,采用手持IGS-100掌上机(李超岭等,2002)结合地形图进行野外定点。定点实际距离误差均小于30 m,即在手图上均小于1 mm。
2.3 采样点密度
本次共采集水系沉积物样品13 169件。根据勘查区地形地貌特点、景观条件、地质特征,本次1∶50 000水系沉积物测量分别采用了不同的采样布局和采样密度:加密区(即指1∶200 000化探异常明显、矿化信息相对较多、基岩面积大、第四系分布面积较少的地区,除正常布点外,成矿有利地段适当加密)采样密度为5.18~5.46点/km2;一般工作区(即指第四系分布面积相对较多,基岩出露面积小或零星,1∶200 000化探异常弱的地区)采样密度为:4.1~4.3点/km2;放稀区(即山间盆地)采样密度为3.13~3.52点/km2。该采样密度组合可有效地控制工作区内绝大多数汇水面积,经济实用,可有效地达到地球化学普查的目的。
2.4 样品加工
样品加工基本流程为:自然干燥→揉碎→过筛→混匀→称量缩分→填写标签→装袋→填写送样单→装箱(陈玉明和陈秀法,2018)。
样品干燥方式采取日晒风干。干燥过程中及时揉搓样品,防止结块,并用木槌适当敲打。
② 样品干燥后过−20目~+60目尼龙筛,对筛下样品用对角线折叠法混匀,缩分后装入纸样袋中,其重量均≥310 g。
③按样品缩分法将加工好的样品缩分成两份各≥150 g,一份装牛皮纸袋送检,另一份装塑料瓶封装当副样留存。
3. 样品分析测试方法
样品分析测试工作先后由具备岩矿测试甲级资质的自然资源部西安矿产资源监督检测中心和陕西地矿局汉中地质大队有限公司实验室承担,严格执行《地球化学普查(比例尺1∶50 000)规范样品分析技术的补充规定》。
3.1 实验室样品加工与制备
实验室配备有专职样品管理人员,负责样品的验收和保管,并严格按照规范要求办理样品交接手续。
以50件样品为一个分析批次进行编码和样品加工,每一个分析批次中随机插入4个国家一级标准物质,然后进入计算机,打印出分析号与送样号的对照表,以供样品管理人员在管理样品、填写汇总表等准备工作中使用,样品随后由样品管理人员下达至碎矿间进行无污染碎样。
化探样品在加工前均在60℃以下充分烘干。在大批量样品加工前,先对岩屑样分别进行玛瑙球数量、球磨时间的最佳条件试验,使其细磨后样品粒度满足1∶50 000区域地球化学调查的要求为原则。要求细磨加工后样品粒度达到−0.074 mm(−200目)占90%以上。
样品管理人员对每批样品的加工粒度是否达到规定要求进行检查;检查合格后,按规定插入指定的监控样及国家一级标样,同时依照密码编号分出内检样,随后交由质量管理人员下达分析任务。
3.2 分析项目及分析方法
根据项目任务书、合同书及总体设计要求,2013—2015年度 1∶50 000水系沉积物测量分析项目为:Au、Ag、Cu、Pb、Zn、As、Sb、Hg、V、Mo、Ti、W共12种元素。2016—2018年度1∶50 000水系沉积物测量分析项目为Au、Ag、Cu、Pb、Zn、As、Sb、Hg、Bi、Sn、W、Mo、Cd、Co、Cr、Ni共计16种元素。
采用光栅光谱仪(OES)、原子荧光仪(AFS)、等离子质谱仪法(ICP-MS)、发射光谱法(GF-AAS)等仪器进行分析测试,所有元素报出率均为100%。勘查区18种元素分析测试方法配套方案见表3。
表 3 勘查区18种元素分析方法、检出限及报出率统计表分析方法 元素含量 1∶50 000地球化学测量规定检出限 所用方法检出限 报出率(%) GF-AAS w(Au)/10−9 0.3~1 0.23 100 F-AAS w(Cu)/10−6 2 1.00 100 w(Zn)/10−6 20 5.00 100 HG-AFS w(As)/10−6 0.5~1 0.20 100 w(Sb)/10−6 0.3 0.05 100 CV-AFS w(Hg)/10−9 10~50 2.00 100 w(Bi)/10−6 0.3 0.1 100 ICP-OES w(Ti)/10−6 100 9.3 100 w(V)/10−6 20 5 100 OES w(Ag)/10−6 0.050 0.019 100 w(Sn)/10−6 2 0.5 100 ICP-MS w(Pb)/10−6 5~10 0.91 100 w(W)/10−6 1 0.048 100 w(Mo)/10−6 1 0.056 100 w(Ni)/10−6 1 0.21 100 w(Co)/10−6 1 0.10 100 w(Cr)/10−6 10 1.00 100 w(Cd)/10−6 0.2 0.02 100 4. 数据样本描述
石泉–旬阳金矿带整装勘查区饶峰幅等7个图幅1∶50 000水系沉积物测量原始数据集为Excel表格型数据,包括7个独立的工作表(sheet),分别为“饶峰幅水系沉积物测量采样点位及元素分析结果表”、“迎丰街幅水系沉积物测量采样点位及元素分析结果表”、“铁佛寺幅水系沉积物测量采样点位及元素分析结果表”、“汉阴幅水系沉积物测量采样点位及元素分析结果表”、“大河口幅水系沉积物测量采样点位及元素分析结果表”、“赵家湾幅水系沉积物测量采样点位及元素分析结果表”、“安康幅水系沉积物测量采样点位及元素分析结果表”(宋相龙等,2017)。每个工作表(sheet)包含如下内容:样品编号、高斯坐标、图幅号、地层、分析结果(铁佛寺幅、大河口幅、汉阴幅、赵家湾幅分析元素为Au、Hg、Ag、Cu、Pb、Zn、Mo、As、Sb、Ti、V、W;迎丰街幅、饶峰幅、安康幅分析元素为Au、Ag、Cu、Pb、Zn、As、Sb、Hg、Bi、Sn、W、Mo、Cd、Co、Cr、Ni)、备注。数据结构见表4。
表 4 陕西石泉−旬阳金矿带整装勘查区水系沉积物测量数据结构表序号 数据项名称 量纲 数据类型 字段长度 实例 1 样品编号 − 字符型 20 57C2 2 图幅号 − 字符型 20 I49E018002 3 地层 − 字符型 20 O3-S1b 4 高斯横坐标 − 字符型 20 255460 5 高斯纵坐标 − 字符型 20 3672075 6 经度 − 字符型 20 108°22′45″ 7 纬度 − 字浮型 20 33°08′48″ 8 Au 10−9 浮点型 20 1.03 9 Ag 10−6 浮点型 20 42 10 Cu 10−6 浮点型 20 35.9 11 Pb 10−6 浮点型 20 35.9 12 Zn 10−6 浮点型 20 83.7 13 As 10−6 浮点型 20 3.88 14 Sb 10−6 浮点型 20 2.13 15 Hg 10−9 浮点型 20 49 16 Bi 10−6 浮点型 20 0.85 17 Sn 10−6 浮点型 20 3 18 W 10−6 浮点型 20 2.14 19 Mo 10−6 浮点型 20 0.93 20 Cd 10−6 浮点型 20 0.1 21 Co 10−6 浮点型 20 22.3 22 Cr 10−6 浮点型 20 94.6 23 Ni 10−6 浮点型 20 41.9 24 Ti 10−6 浮点型 20 − 25 V 10−6 浮点型 20 − 5. 数据质量和评估
5.1 原始数据质量
铁佛寺幅、汉阴幅、大河口幅和赵家湾幅地球化学测量样品测试过程中以50件样品为一个分析批次进行编码和样品加工,每一个分析批次中随机插入4个国家一级标准物质,分别为GBW07302a、GBW07304a、GBW07309、GBW07318,对分析过程的精密度进行监控。另外随机分段加入12件国家一级标准物(每500件样品插入一次),共插入15次,对分析过程的准确度进行监控,并对样品中部分高值和低值进行了抽查分析,抽查样品数量比例为2.6%。
饶峰幅、迎丰街幅和安康幅地球化学测量样品测试过程中以50件样品为一个分析批进行编码和样品加工,共分为243批。每一个分析批次中随机插入购买于中国地质科学院地球物理地球化学勘查研究所的4个国家一级标准物质对分析过程的准确度进行监控。其中Au、Ag、Hg、Pb、Sn、As、Sb和Bi共8种元素插入GSD-10、GSD-14、GSD-18、GSD-20控制分析过程精密度;Cr、Co、Ni、Cu、Zn、Mo、Cd和W共8种元素插入GSD-8a、GSD-9、GSD-10、GSD-14控制分析过程精密度,并对样品中部分高值和低值进行了抽查分析,抽查样品数量比例为4.1%。
本次检测工作中,分析元素内检(重复样)合格率均在95.00%以上;元素报出率均达到100%;元素异常复查合格率均为97.5%以上;所选用分析方法的检出限均满足DZ/T0130.4−2006中1∶50 000化探样品标准要求。方法的精密度:对所选一级标准物质检测的△lgC平均值在(−0.099~0.099)以内。方法准确度:对所选一级标准物质检测的△lgC平均值在(−0.099~0.099)以内。所选分析方法的检出限、精密度和准确度均满足《地球化学普查(比例尺1∶50 000)规范样品分析技术的补充规定》的质量要求。
上述质量参数数据表明,本次检测的分析质量完全符合《地球化学普查(比例尺1∶50 000)规范样品分析技术的补充规定》及DZ0130.4−2006的质量要求。
5.2 成果数据库建设质量
陕西石泉–旬阳金矿带整装勘查区饶峰幅等7个图幅区1∶50 000水系沉积物测量成果数据库建设(万常选等,2009)均按照化探数据模型采用DGSS软件平台实现(庞健峰等,2017),样品中各分析元素属性结构均参照中国地质调查局固体矿产勘查数据库内容与结构(左群超等,2018;李超岭等,2013)填写,数据结构内容完整齐全。所形成的7幅1∶50 000水系沉积物测量数据库已由中国地质调查局西安地质调查中心及中国地质调查局发展研究中心专家评审验收,评分93分,评为“优秀级”,已完成相关数据库汇交。
6. 结论
本次数据集工作区范围是由中国地质调查局西安地质调查中心与中国地质调查局发展研究中心组织实施的陕西石泉–旬阳金矿带整装勘查区内饶峰幅等7幅图3 010 km2 1∶50 000水系沉积物测量工作,是陕西石泉–旬阳金矿带整装勘查区内首次系统性的采用统一采样方法、分析测试方法、统一分析元素,也是本整装勘查区内首次规范化建立地球化学数据库,获得了珍贵的第一手地球化学测量资料。
本数据集成果指导在整装勘查区内圈定金找矿靶区10处,金成矿远景区12处❶,其中在圈定的陕西省汉阴县双河口一带金找矿靶区内新发现坝王沟金矿点,通过后期省地勘基金投入,金(333+334)资源量30吨;在圈定的陕西省安康市汉滨区将军山一带金找矿靶区内新发现早阳金矿点,通过后期省地勘基金投入,金(333+334)资源量20吨。另外运用本数据集成果新发现4处金矿点,分别为陕西省宁陕县堰沟金矿点、陕西省安康市汉滨区柳坑金矿点、陕西省石泉县石桥金矿点、陕西省石泉县栈房金矿点,均有一定的找矿潜力。另外,本数据集成果指导我省找到2~4处新的大型金矿产资源开发基地。
注释:
❶张永强, 孙健, 谈乐. 2018. 陕西石泉−旬阳金矿带整装勘查区矿产调查与找矿预测2016—2018年子项目总成果报告[R]. 安康:陕西地矿第一地质队有限公司, 1−260.
1. Introduction
The measurement of 1∶50 000 stream sediments across 7 map sheets of the integrated survey area of the Shiquan-Xunyang gold zone began in 2013 (Fig. 1), of which those in the Raofeng, Yingfengjie and Ankang map sheets were organized by the Development and Research Center of China Geological Survey in 2016—2018; those in the Tiefosi, Hanyin, Dahekou and Zhaojiawan map sheets were organized by the Xi’an Center of China Geological Survey in 2013—2015, and both were conducted by the Team No.1, Shaanxi Bureau of Geology and Mineral Resources Co. Ltd..
![]() 图 1 Range for measurement of the 1∶50 000 stream sediments of the 7 Map Sheets in the Integrated Survey Area of the Shiquan-Xunyang Gold Ore Zone, Shaanxi.
图 1 Range for measurement of the 1∶50 000 stream sediments of the 7 Map Sheets in the Integrated Survey Area of the Shiquan-Xunyang Gold Ore Zone, Shaanxi.The integrated survey area of the Shiquan-Xunyang gold ore zone, Shaanxi, located at the South Qinling tectonic zone in the midst of the Qinling orogeny, has experienced multi-stage deformations in its long history of geological evolution, where the typical tectonic patterns are folding, detachment and ductile shearing zones. In terms of stratigraphic regionalization, it belongs to the Niushan stratigraphic sub-region of the South China stratigraphic super-region (Han FL et al., 2013) (Fig. 2). Due to decoupling detachment between the overlying strata and basement, the outcrop in the area is characterized by the formation of Sinian−early-Paleozoic, black, low-metamorphic, strongly-deformed fine clastic rock series, which were formed in the coastal sea environment (Zhang FX et al., 2009; Tang YZ et al., 2012). The outcropped strata within the area include the Paleoproterozoic Yangpingyan Formation, the basic volcanic rock of the Yaolinghe Formation and Paleozoic sedimentary−low-metamorphic rocks, where mid- and late-Silurian−early-Devonian sedimentary strata are poorly developed (Liu GH and Zhang SG, 1993).
![]() 图 2 Schematic diagram of the stratigraphic regionalization of the Integrated Survey Area of the Shiquan-Xunyang Gold Ore Zone, Shaanxi
图 2 Schematic diagram of the stratigraphic regionalization of the Integrated Survey Area of the Shiquan-Xunyang Gold Ore Zone, ShaanxiThe measurement of the 1∶50 000 stream sediments in the integrated survey area of the Shiquan-Xunyang gold ore zone began with preparation of the project design in July 2013, all works being done in accordance with the relevant technical specifications. The project was completed in three stages: Stage 1, organization of the geochemical staff to take samples for the measurement of the 1∶50 000 stream sediments; Stage 2, checking, verifying, collating and processing data, and delineation of geochemical anomalies; Stage 3, plotting a series of geochemical maps, establishing and improving the regional geochemical database for the integrated survey area of the Shiquan-Xunyang gold ore zone, and screening and verifying anomalies.
Metadata for the measured original dataset of the stream sediments in the 7 map sheets of the integrated survey area of the Shiquan-Xunyang gold ore zone, Shaanxi, are shown in Table 1.
表 1 Metadata Table of Database (Dataset)Items Description Database (dataset) name The 1∶50 000 Original Measurement Dataset on Stream Sediments for 7 Map Sheets including the Raofeng Map in the Integrated Survey Area of the Shiquan-Xunyang Gold Ore Zone, Shaanxi Database (dataset) authors Tan Le, Team No.1, Shaanxi Bureau of Geology and Mineral Resources Co. Ltd.
Zhang Yongqiang, Team No.1, Shaanxi Bureau of Geology and Mineral Resources Co. Ltd.
Liu Xiaopeng, Team No.1, Shaanxi Bureau of Geology and Mineral Resources Co. Ltd.
Li Xiaoming, Team No.1, Shaanxi Bureau of Geology and Mineral Resources Co. Ltd.
Wang Caijin, Team No.1, Shaanxi Bureau of Geology and Mineral Resources Co. Ltd.Data acquision time 2013—2018 Geographic area Shiquan-Xunyang, Shaanxi Data format *.xlsx Data size 2.01MB Data service system URL http://dcc.cgs.gov.cn Fund project China Geological Survey Project (121201004000150017-53, 121201004000160901-54, 121201004000172201-45, 12120113048100). Language Chinese Database(dataset) composition The dataset consists of 7 separate Excel sheets: Raofeng Sampling Points and Element Analytical Result Sheet, Tiefosi Sampling Points and Element Analytical Result Sheet, Hanyin Sampling Points and Element Analytical Result Sheet, Dahekou Sampling Points and Element Analytical Result Sheet, Zhaojiawan Sampling Points and Element Analytical Result Sheet, Yingfengjie Sampling Points and Element Analytical Result Sheet and Ankang Sampling Points and Element Analytical Result Sheet. 2. Field Work Methods
2.1 Selection Method
The survey area is a humid−semihumid mid-and-low hilly natural landscape area (Fan HM and Li FZ, 2013), humid, rainy, strongly denuded, deeply cut, mainly physically-weathered, where channel-system alluvium and diluvium have the properties of coarse debris, suitable for the measurement of the stream sediments (Liu JS et al., 2016). In accordance with the Specifications of the Geochemical Reconnaissance Survey (1∶50 000)(DZ/T 0011−2015), considering the geochemical landscape features of the survey area, it was decided to use stream sediment as the medium to be sampled for this geochemical reconnaissance survey, at a sampling density of 4~8 points/km2, and –20 meshes ~ +60 meshes are selected for the sample’s grain size.
2.2 Sampling
2.2.1 Sample Location
In the survey area, samples for measurement of 1∶50 000 stream sediments are all taken from the river bottom or the contact between the riverbank and the water surface (Zhang Y et al., 2018). In intermittent or trunk river channels, samples are mainly taken from the bottom of the riverbed; in rivers with rapid flow, samples are taken at places where water flows slowly or stops, or behind a boulder, or where water flow widens, or at the inner side of the turn of the river channel, where much more fine-grained materials concentrate.
2.2.2 Sampling Materials
Following the principle that sampled media shall represent material components of bedrocks containing original geological prospecting information, sampling materials are sludge, silt or fine sand in stream sediments.
2.2.3 Sampling Methods
Samples taken from the stream sediments in the survey area are graded sections, mixing coarse−fine-grain sizes, care being taken to avoid sampling from the humus layer. During sampling, an emphasis was placed on taking more samples at places where alteration−mineralization is strong, or which are priorities for prospecting. Samples are taken using the specific technique below:
① Prior to sampling, the topsoil or humus layer is removed with a sampling spoon.
② The cloth bag used for housing samples is checked to ensure that it does not have split seams or broken holes before placing samples within it. Before putting moist samples in the bag, they were placed in a plastic bag and then in the cloth bag, to prevent samples from becoming wet and contaminated, due to mutual leaching.
③ To make samples more representative, samples were taken at multiple points of 3~5 places 20~30 m within upstream and downstream of the sampling points and then combined into one sample.
④ Sampling avoids locations where there are pollutants and accumulated collapses at the bank due to mine development, villages and towns, dams, field-making from silty land, traffic route or road junctions.
2.2.4 Point Fixation in the Field
The integrated survey area of the Shiquan-Xunyang gold ore zone, Shaanxi, involves seven 1∶50 000 map sheets (Table 2) in which the 1980 Xi’an coordinate system is used and the central meridian is 111°, and geological data involved in the map sheets were purchased from the Shaanxi Geographic Information Survey Bureau.
表 2 Topographic map of seven 1∶50 000 Map Sheets involved in the Integrated Survey Area of the Shiquan-Xunyang Gold Ore Zone, ShaanxiMap sheet name Map sheet number Raofeng I49E17001 Yingfengjie I49E18002 Tiefosi I49E18003 Hanyin I49E19003 Dahekou I49E19004 Zhaojiawan I49E19005 Ankang I49E02005 The 1∶50 000 standard topographic map is used as a base map for field measurement of the stream sediments to determine the sampling points in the field with a hand-held IGS-100 device (Li CL et al., 2002). Errors in point localization were less than 30 m from their actual locations, i.e. less than 1 mm on the base map.
2.3 Density of Sampling Points
During the project there were 13 169 samples in total taken from stream sediments. Based on topographic and landform characteristics, landscape conditions and geological features, for the measurement of these 1∶50 000 stream sediments, different sampling layouts and densities were used: at the densest area (i.e. referring to areas where at 1∶200 000 a geochemical anomaly is obvious, there was more information on mineralization, larger in the bedrock area and distributed with less Quaternary strata, and in addition to normal point arrangements, sampling in sections favoring metallogenesis are undertaken to the standard density), the sampling density was 5.18~5.46 points/km2; at the ordinal work area (i.e. referring to areas where there are more Quaternary strata, smaller or sporadic outcropped bedrocks, and the 1∶200 000 geochemical anomaly is weak), the sampling density was 4.1~4.3 points/km2; at the scattered area (i.e. intermountain basin), the sampling density was 3.13~3.52 points/km2. The combination of these sampling densities allows the effective control of the vast majority of water catchment within the area, which is cost-effective and enables the effective meeting of the goal of the geochemical reconnaissance survey.
2.4 Sample Processing
The basic procedure to process samples: natural drying → trituration →sieving →mixing evenly → weighing and splitting samples →fillling in the label → placing samples into bags → completing the sample delivery order → placing sampled bags into boxes (Chen YM and Chen XF, 2018).
Sample drying method: dried under sunlight and air. During drying, rub and knead samples regularly to prevent caking, and use a mallet to strike them properly,
② Dried samples were sieved with a −20~+60 mesh nylon sieve, samples under the sieve are mixed evenly through diagonal folding, split and then put into paper bags, their weight being ≥ 310 g.
③ Samples processed by sample splitting were divided into two parts, each part ≥ 150 g, one put into a kraft paper bag and sent for testing, and the other placed into plastic bottles, which were then sealed and kept as duplicate samples.
3. Sample Analysis and Testing
Samples were analyzed and tested by the Xi’an Center for Mineral Resource Supervision and Testing under the Ministry of Natural Resources and a laboratory of the Hanzhong Geological-Battalion Co., Ltd. under the Shaanxi Bureau of Geology and Mineral Resource, both of which possess Qualification A for rock and mineral testing, in strict accordance with the Additional Rules for Regulating Sample Analysis Technologies of Geochemical Reconnaissance Surveys (Scale: 1∶50 000).
3.1 Processing and Preparation of Lab Samples
Labs are provided with full-time staff to manage samples, receive, inspect and care for samples, as well as handle sample handover procedures strictly in accordance with requirements in the specifications.
The samples were coded and processed as an analytical batch of 50, each analytical batch also containing 4 randomly inserted level-1 national standard substances, the data sent to a computer to print out a comparison table showing the respective numbers of samples analyzed and those delivered, which was then used by sample management staff in tasks such as managing samples and filling in the summary tables, and samples were subsequently sent by the sample management staff to the ore-crushing room where they were crushed without contamination.
Geochemical samples must be fully dried at a temperature below 60℃ prior to processing. Before massive sample processing, debris samples should be tested for the best conditions for agate ball numbers and ball-milling time so that the particle size of the finely-ground samples meets the requirement for the 1∶50 000 regional geochemical survey, that finely-ground samples with particle size reaching –0.074 mm (–200 mesh) accounted for at least 90% of the sample.
The sample management staff checked whether each processed batch of samples met the requirement for particle size; inserted designated control samples and Level-1 national standard samples into acceptable batches as required, whilst separating inner inspection samples based on their codes and numbers, and then delivering them to quality management staff to assign analysis tasks.
3.2 Items Analyzed and Analytical Methods
According to the Project Task, Contract and General Design Specification, in 2013—2015, the items to be analyzed during the measurement of the 1∶50 000 stream sediments were the 12 elements: Au, Ag, Cu, Pb, Zn, As, Sb, Hg, V, Mo, Ti and W. In 2016—2018, the items to be analyzed for measurement of the 1∶50 000 stream sediments totalled 16 elements: Au, Ag, Cu, Pb, Zn, As, Sb, Hg, Bi, Sn, W, Mo, Cd, Co, Cr and Ni.
Instruments such as Optical Emission Spectrometer (OES), Atomic Fluorescence Spectrometer (AFS), Inductive Coupling Plasma-Mass Spectrometer (ICP-MS) and Graphite Furnace-Atomic Absorption Spectrometer (GF-AAS) were used in analysis and testing, and all elements reported percentages were 100%. Schemes for testing and analysis of the 18 elements in the survey area are shown in Table 3.
表 3 Analytical methods, detection limits and report percentages of the 18 elements in the survey areaAnalytical method Element content Specified detection limit for the 1∶50 000 geochemical measurement Detection limit of the method used Report percentage (%) GF-AAS w(Au)/10−9 0.3~1 0.23 100 F-AAS w(Cu)/10−6 2 1.00 100 w(Zn)/10−6 20 5.00 100 HG-AFS w(As)/10−6 0.5~1 0.20 100 w(Sb)/10−6 0.3 0.05 100 CV-AFS w(Hg)/10−9 10~50 2.00 100 w(Bi)/10−6 0.3 0.1 100 ICP-OES w(Ti)/10−6 100 9.3 100 w(V)/10−6 20 5 100 OES w(Ag)/10−6 0.050 0.019 100 w(Sn)/10−6 2 0.5 100 ICP-MS w(Pb)/10−6 5~10 0.91 100 w(W)/10−6 1 0.048 100 w(Mo)/10−6 1 0.056 100 w(Ni)/10−6 1 0.21 100 w(Co)/10−6 1 0.10 100 w(Cr)/10−6 10 1.00 100 w(Cd)/10−6 0.2 0.02 100 4. Description of Data Samples
The measured original dataset on the 1∶50 000 stream sediments in the 7 map sheets of the integrated survey area of the Shiquan-Xunyang gold ore zone contains data in Excel form, including 7 separate sheets: Raofeng Sampling Points and Element Analytical Result Sheet, Tiefosi Sampling Points and Element Analytical Result Sheet, Hanyin Sampling Points and Element Analytical Result Sheet, Dahekou Sampling Points and Element Analytical Result Sheet, Zhaojiawan Sampling Points and Element Analytical Result Sheet, Yingfengjie Sampling Points and Element Analytical Result Sheet, and Ankang Sampling Points and Element Analytical Result Sheet (Song XL et al., 2017). Each sheet contains the following: sample No., Gaussian coordinates, map sheet No., stratigraphy, analyzed result (elements analyzed in Tiefosi, Dahekou, Hanyin and Zhaojiawan map sheets are Au, Hg, Ag, Cu, Pb, Zn, Mo, As, Sb, Ti, V and W; elements analyzed in Yingfengjie, Raofeng and Ankang map sheets are Au, Ag, Cu, Pb, Zn, As, Sb, Hg, Bi, Sn, W, Mo, Cd, Co, Cr and Ni) and remarks. Dataset structure could be seen in Table 4.
表 4 Dataset structure of the measured original data of the stream sediments in the integrated survey area of the Shiquan-Xunyang gold ore zone, ShaanxiNo. Name of data item Dimension Data category Field length Real example 1 Sample No. Character type 20 57C2 2 Map sheet No. Character type 20 I49E018002 3 Stratigraphy Character type 20 O3−S1b 4 Gauss horizontal coordinate Character type 20 255460 5 Gauss vertical coordinate Character type 20 3672075 6 Longitude Character type 20 108°22′45″ 7 Latitude Character type 20 33°08′48″ 8 Au 10−9 Floating-point type 20 1.03 9 Ag 10−6 Floating-point type 20 42 10 Cu 10−6 Floating-point type 20 35.9 11 Pb 10−6 Floating-point type 20 35.9 12 Zn 10−6 Floating-point type 20 83.7 13 As 10−6 Floating-point type 20 3.88 14 Sb 10−6 Floating-point type 20 2.13 15 Hg 10−9 Floating-point type 20 49 16 Bi 10−6 Floating-point type 20 0.85 17 Sn 10−6 Floating-point type 20 3 18 W 10−6 Floating-point type 20 2.14 19 Mo 10−6 Floating-point type 20 0.93 20 Cd 10−6 Floating-point type 20 0.1 21 Co 10−6 Floating-point type 20 22.3 22 Cr 10−6 Floating-point type 20 94.6 23 Ni 10−6 Floating-point type 20 41.9 24 Ti 10−6 Floating-point type 20 25 V 10−6 Floating-point type 20 5. Data Quality and Assessment
5.1 Quality of the Original Data
In the process of analyzing and testing geochemical samples in the Tiefosi, Hanyin, Dahekou and Zhaojiawan map sheets, every 50 samples were grouped to be coded and processed as one analytical batch, each analytical batch being randomly inserted with 4 Level-1 national standard substances which were GBW07302a, GBW07304a, GBW07309 and GBW07318, in order to monitor and control the precision of the analytical process. In addition, 12 Level-1 national standard substances are added randomly in sections (once for every 500 samples) for 15 times in total, to monitor the accuracy of the analytical process, and some high and low values of samples were randomly inspected and analyzed, with 2.6% of samples receiving random inspection.
In the process of analyzing and testing geochemical samples in the Raofeng, Yingfengjie and Ankang map sheets, every 50 samples were grouped to be coded and processed as one analytical batch, 243 batches in total. Each analytical batch is randomly inserted with 4 Level-1 national standard substances purchased from the CAGS Geophysical & Geochemical Exploration Institute, in order to monitor and control the accuracy of the analytical process. Of these, to analyze the 8 elements Au, Ag, Hg, Pb, Sn, As, Sb and Bi, GSD-10, GSD-14, GSD-18 and GSD-20 were inserted to control the precision of the analytical process; to analyze the other 8 elements Cr, Co, Ni, Cu, Zn, Mo, Cd and W, GSD-8a, GSD-9, GSD-10 and GSD-14 were inserted to control the precision of the analytical process, and some high and low values of samples were randomly inspected and analyzed, with 1.4 % of samples receiving random inspection.
During this detection, the qualifying rate of element inner examination (duplicate sample) was more than 95.00%; all elements’ report percentages were 100%; the qualifying rate of element anomaly re-examination was at least 97.5%; the detection limits of analytical methods used all met the standard requirement on 1∶50 000 geochemical samples in DZ/T0130.4−2006. Precision of methods: the mean ΔlgC detected with Level-1 national standard substance was within –0.099~+0.099. Accuracy of methods: the mean ΔlgC detected with Level-1 national standard substance was within –0.099~+0.099. The detection limit, precision and accuracy of the analytical methods selected met the quality-related requirements in the Additional Rules for Regulating Sample Analysis Technologies of Geochemical Reconnaissance Surveys (Scale 1∶50 000).
Above-mentioned figures concerning quality-related parameters indicate that this examination fully complied with the quality-related requirements in the Additional Rules for Regulating Sample Analysis Technologies of Geochemical Reconnaissance Surveys (Scale 1∶50 000) and DZ0130.4−2006.
5.2 Quality in Establishing the Resulting Database
The measured results database of the 1∶50 000 stream sediments in the 7 map sheets including Raofeng on the integrated survey area of the Shiquan-Xunyang gold ore zone, Shaanxi (Wan CX et al., 2009), was set up in accordance with the geochemical data model by using the software platform DGSS (Pang JF et al., 2017), properties and structures of all the elements analysed were completed by referring to the content and structure of the CGS’s solid mineral survey database (Zuo QC et al., 2018; Li CL et al., 2013), to ensure that the data structure and content were complete and sound. The generated measurement databases of 1∶50 000 stream sediments in the 7 map sheets have been reviewed and accepted by the experts from the Xi'an Center of China Geological Survey and the Development and Research Center of China Geological Survey, scoring 93, awarded “Excellence”, and have thus been handed over.
6. Conclusions
The scope of the work area involved in this database was the measurement of the 1∶50 000 stream sediments in the 7 map sheets including Raofeng in the integrated survey area of the Shiquan-Xunyang gold ore zone, Shaanxi, organized and implemented by the Xi'an Center and the Development and Research Center of China Geological Survey, covering 3 010 km2. It is the first time that unified sampling, analytical and testing methods have been used to analyze elements in a systematic way in the integrated survey area of the Shiquan-Xunyang gold ore zone, Shaanxi. It is also the first time that a geochemical databases have been established in a standardized way in the integrated survey area, so as to obtain valuable first-hand geochemical measurement information.
With the results from the database, 10 Au prospecting target areas and 12 Au prospective areas were delineated in the integrated survey area❶, and at the newly-discovered Bawanggou Au deposit from the Au-delineated prospecting target area at and around Shuanghekou, Hanyin County, Shaanxi, with a subsequent provincial fund for geological exploration, it was found that the Au resource (333+334) was 30 tons; in the Au-prospecting target area at and around Jiangjunshan, Ankang city, Shaanxi, the Zaoyang Au deposit was recently found, and a subsequent provincial fund created for geological exploration, the Au (333+334) resource is 20 tons. In addition, 4 new gold ore occurrences were discovered in Shaanxi by using the results from this database, and they are located in Yangou, Ningshan County; Liukeng, Hanbin District, Ankang City; Shiqiao and Zhanfang, Shiquan County, all of which have a certain prospecting potential. Furthermore, the results from the database have guided Shaanxi to find 2–4 new large-scale Au resource development bases.
Notes:
❶ Zhang Yongqiang, Sun Jian, Tan Le. 2018. Comprehensive result report of sub-projects from 2016 to 2018 on mineral investigation and prospecting prediction in the integrated survey area of the Shiquan-Xunyang gold ore zone, Shaanxi[R]. Ankang: Team No.1, Shaanxi Bureau of Geology and Mineral Resources Co.Ltd., Ankang, Shaanxi, 1−260 (in Chinese).
-
![]()
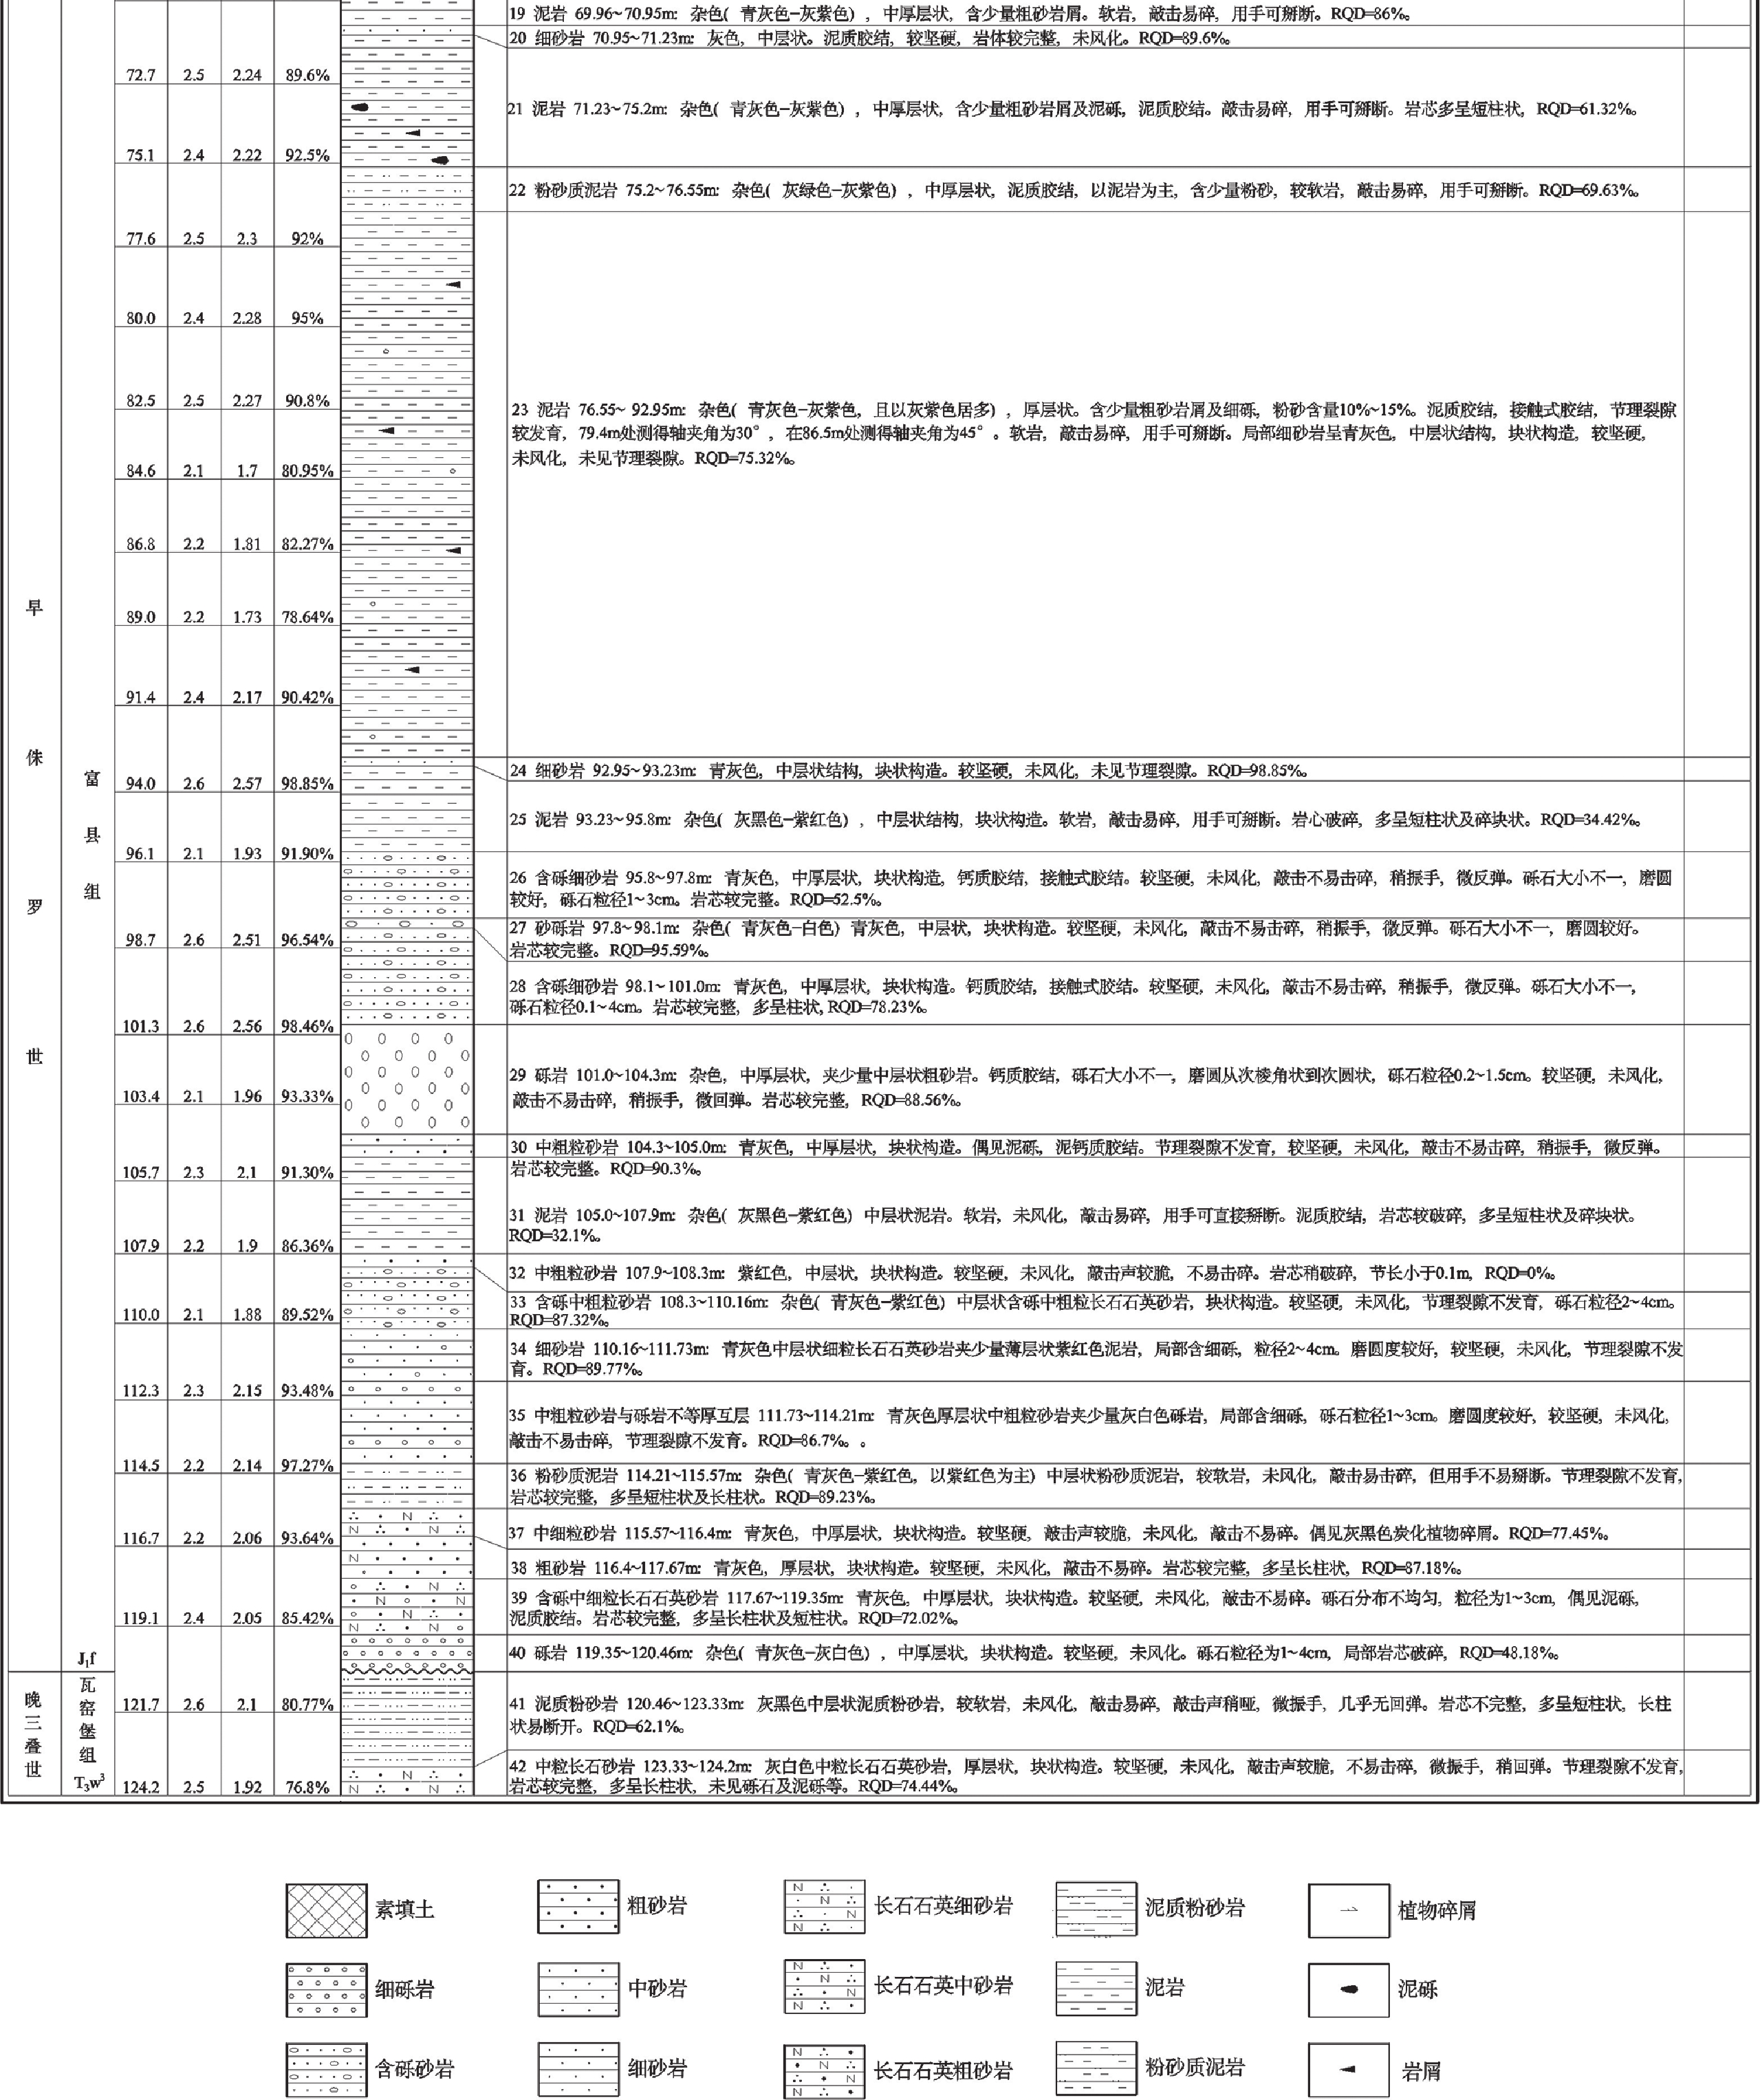
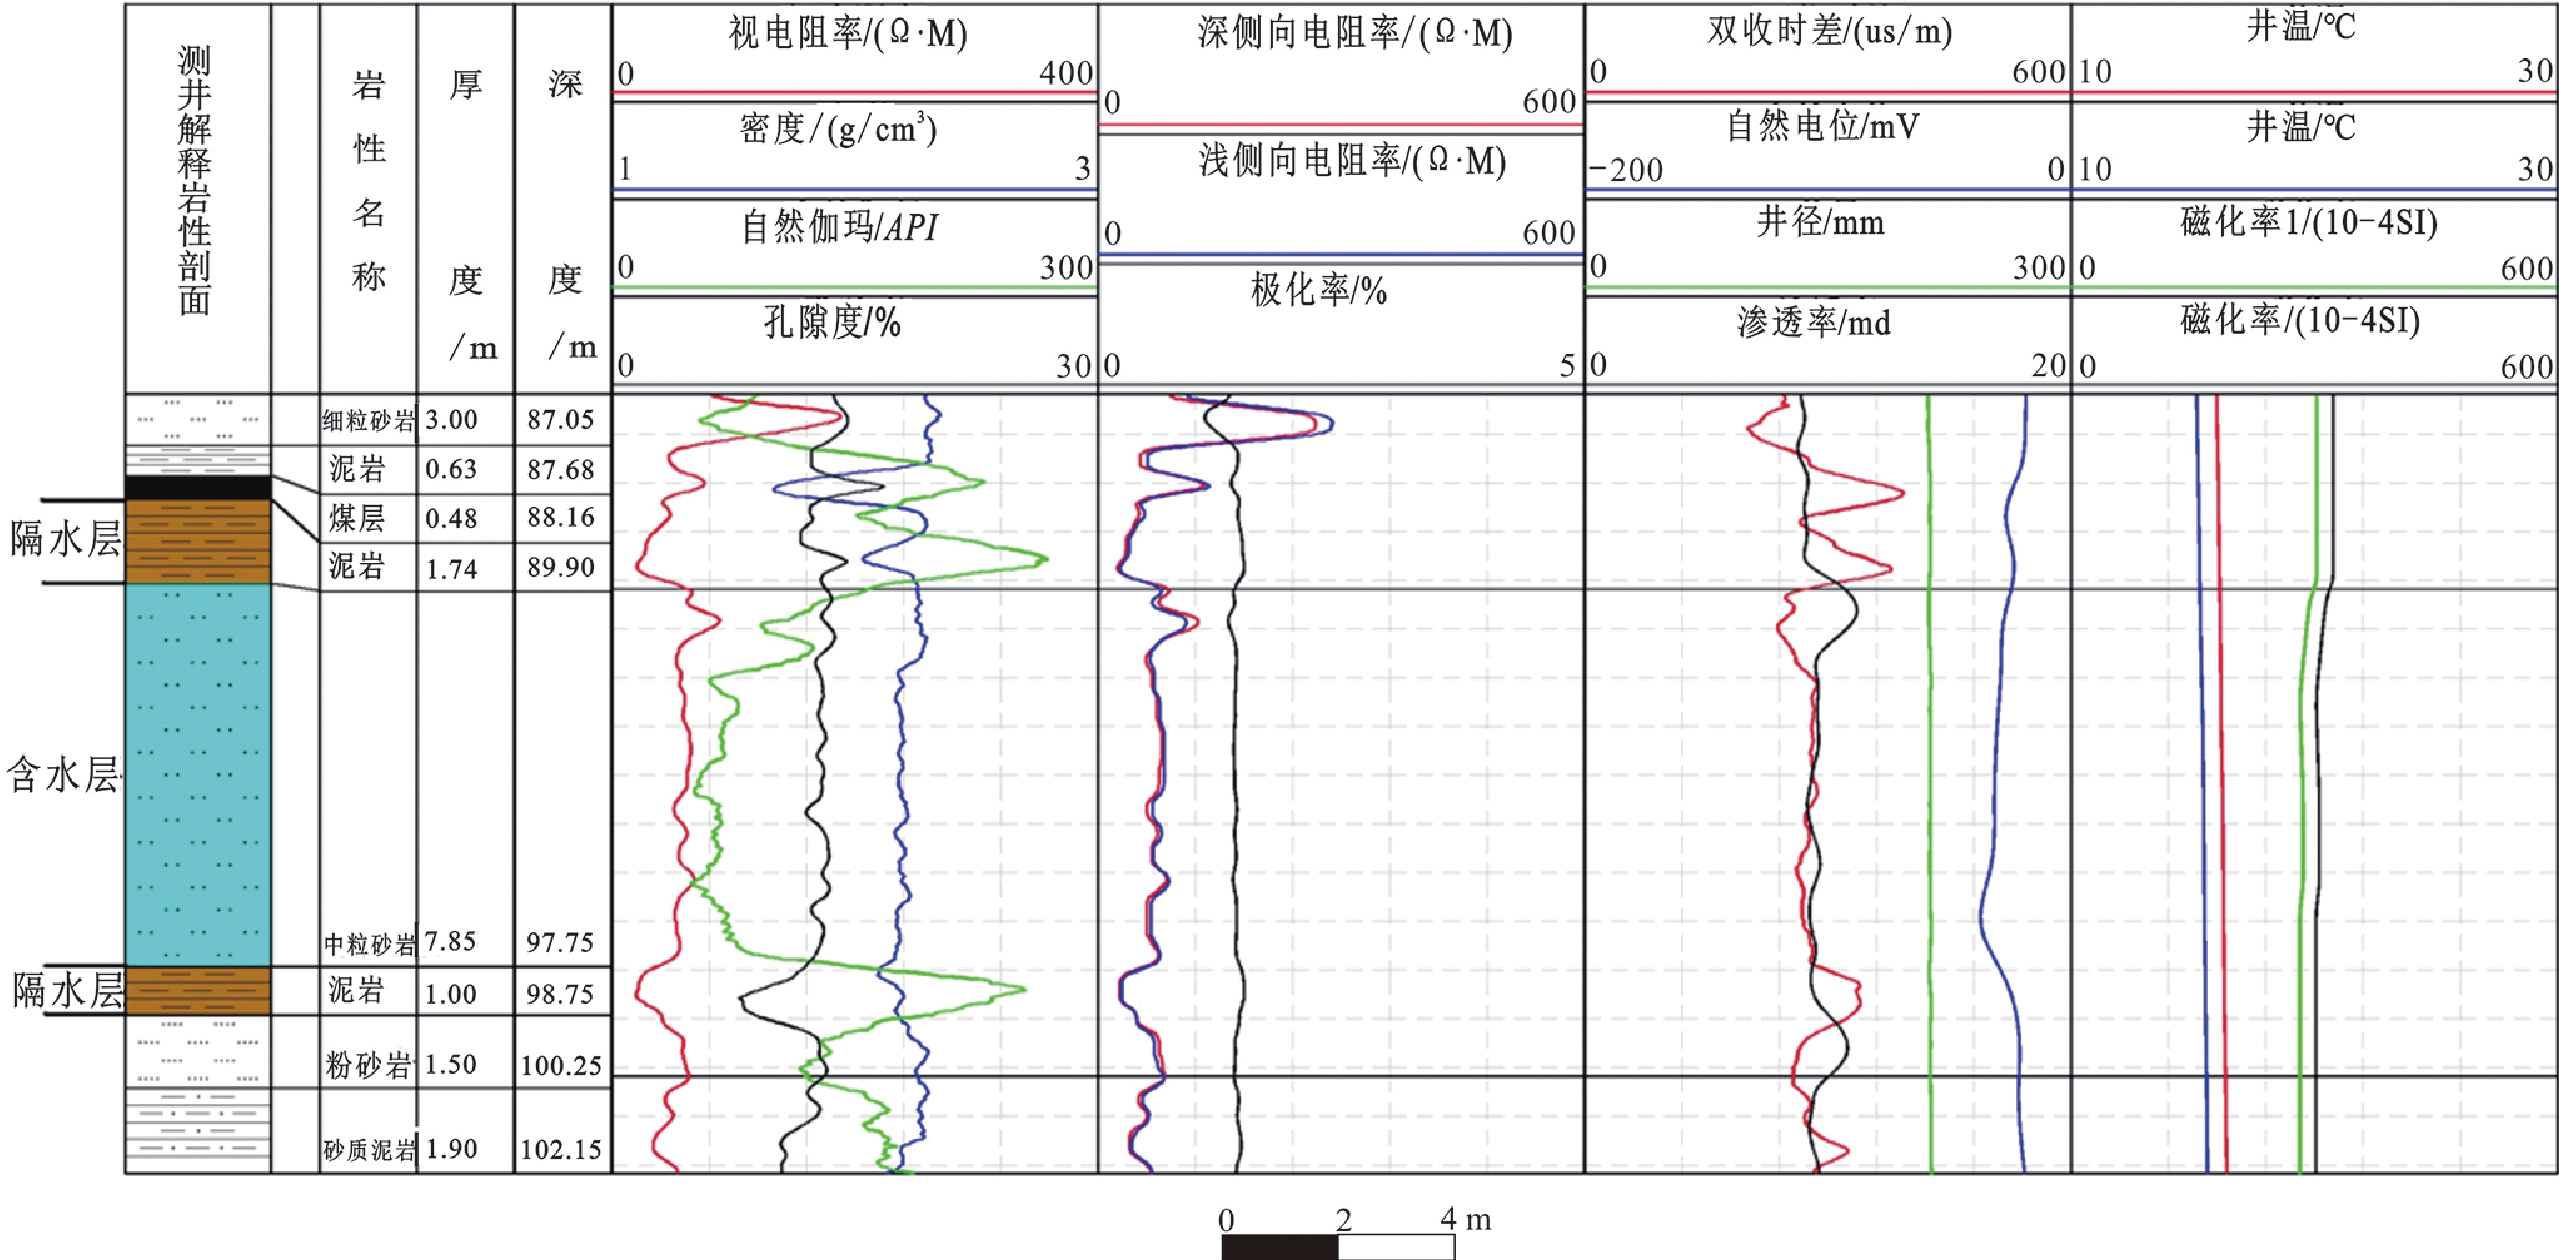
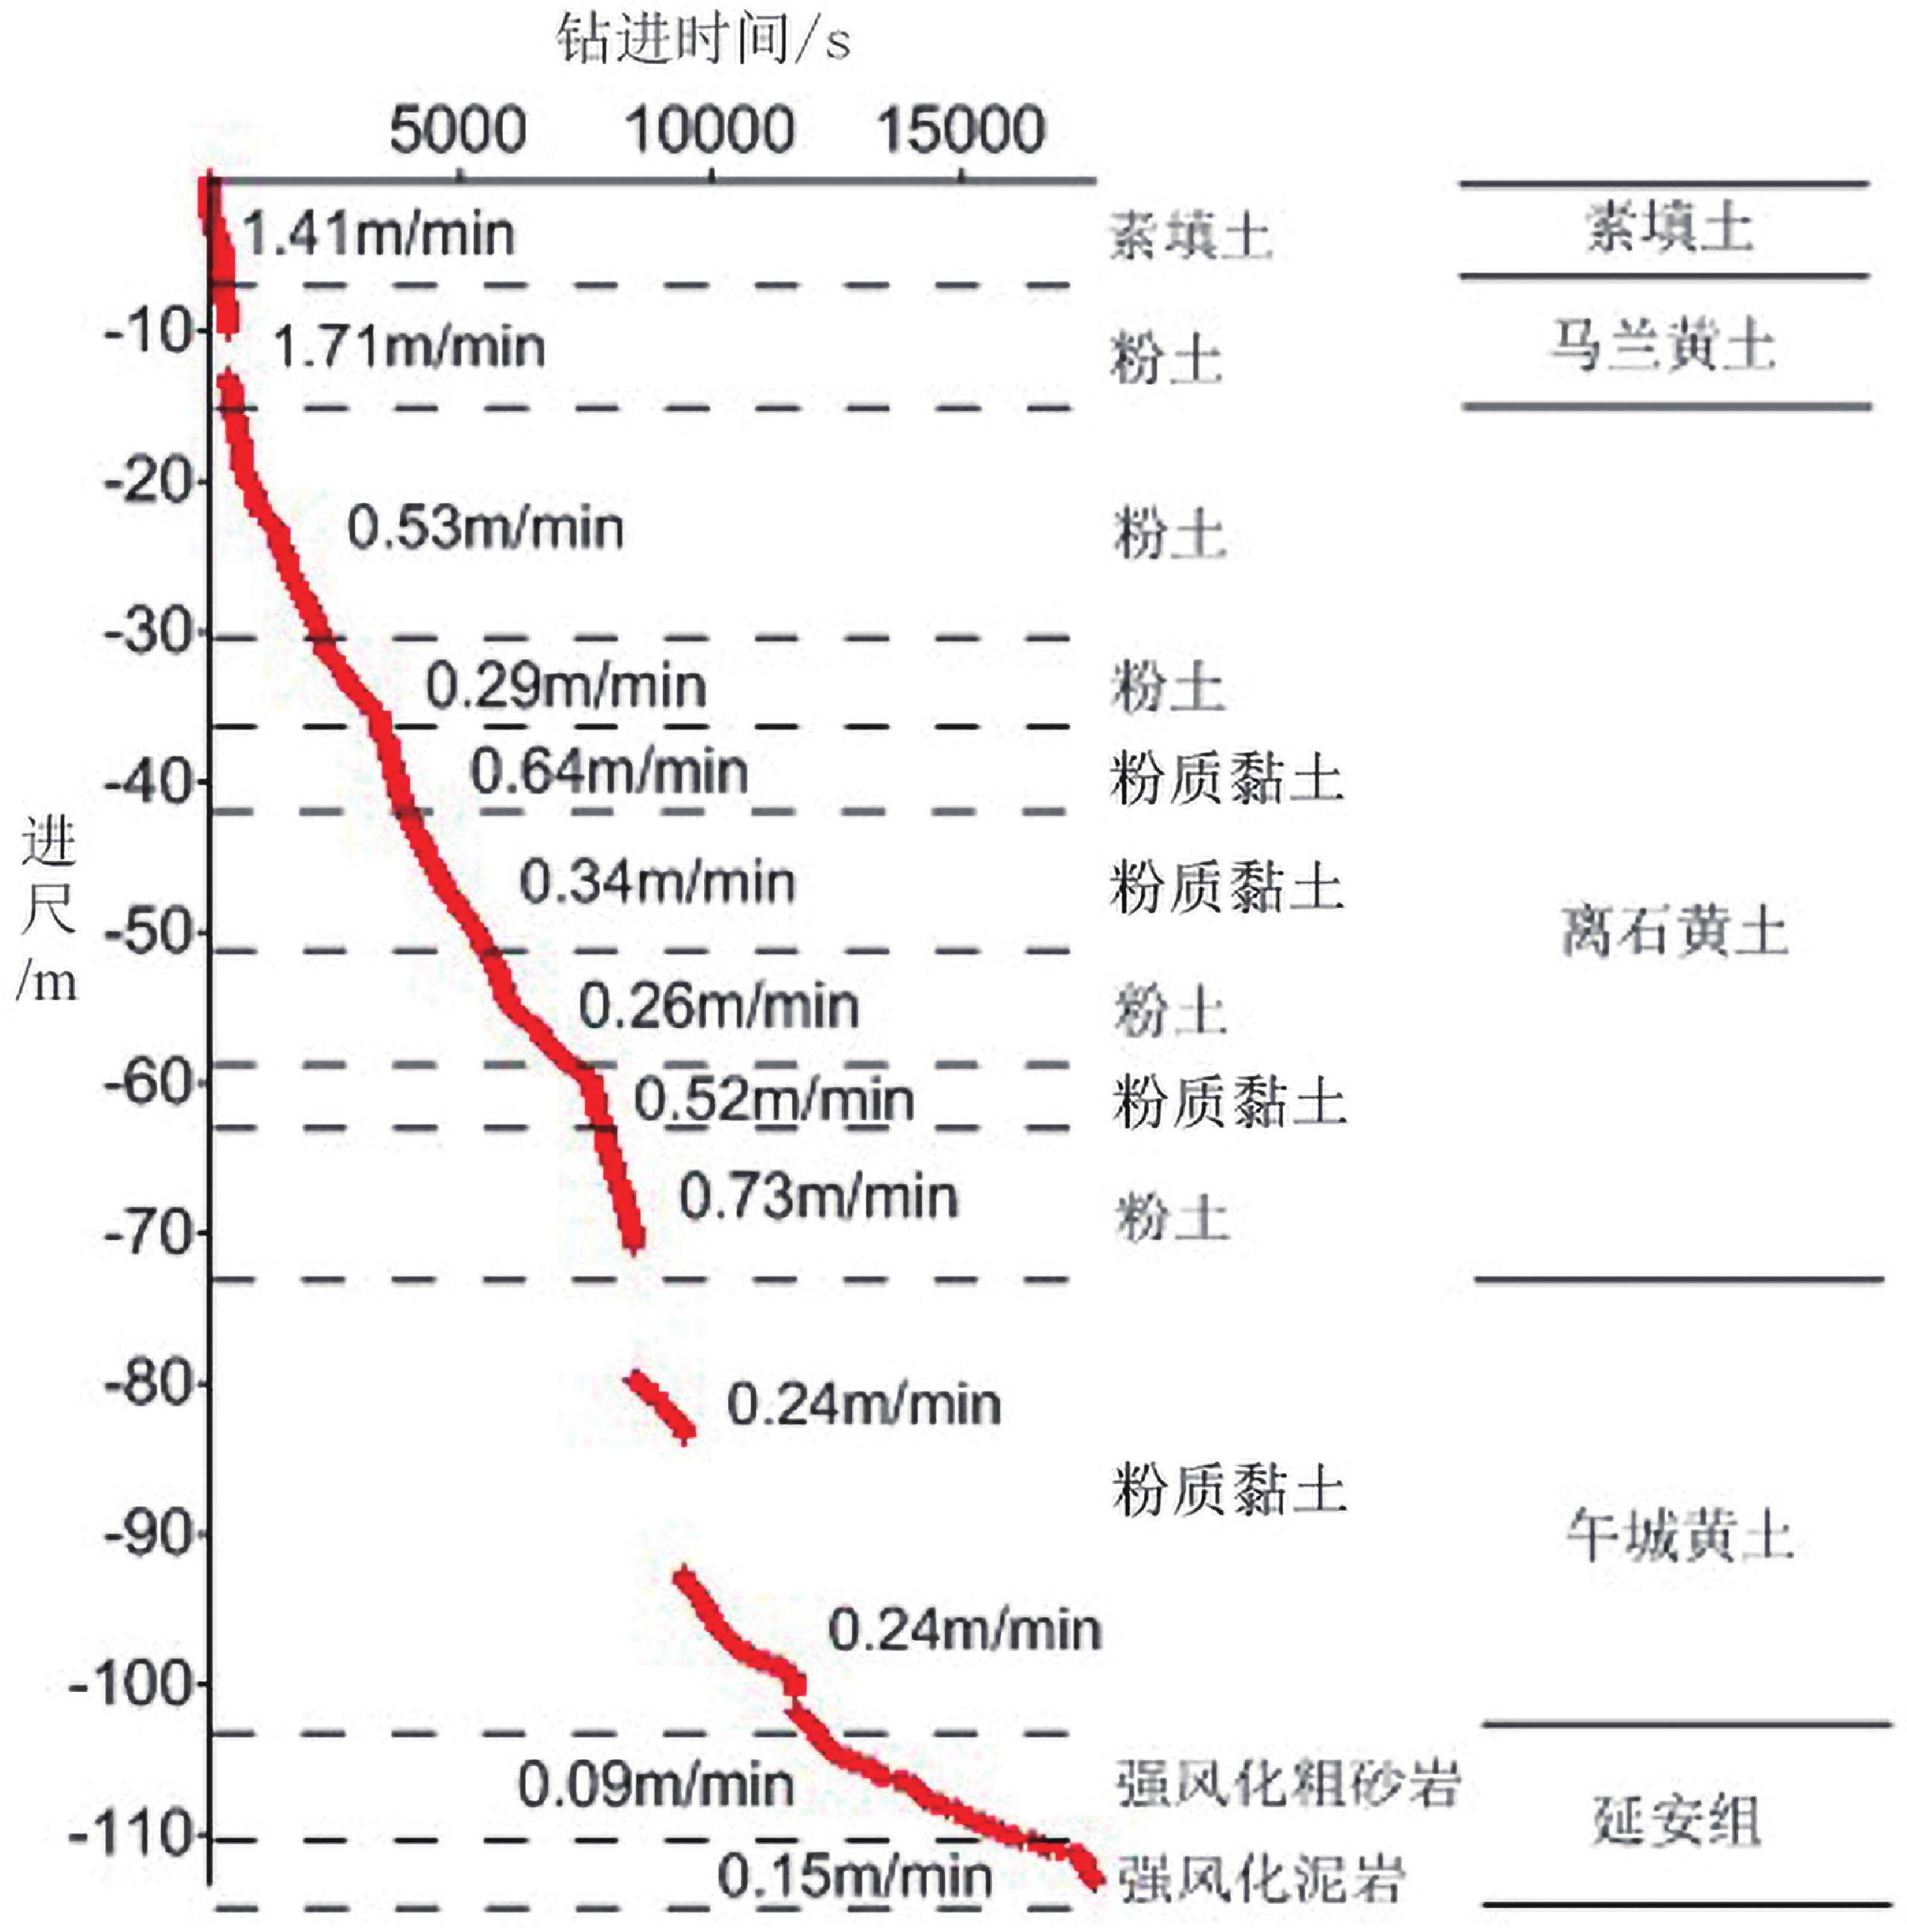
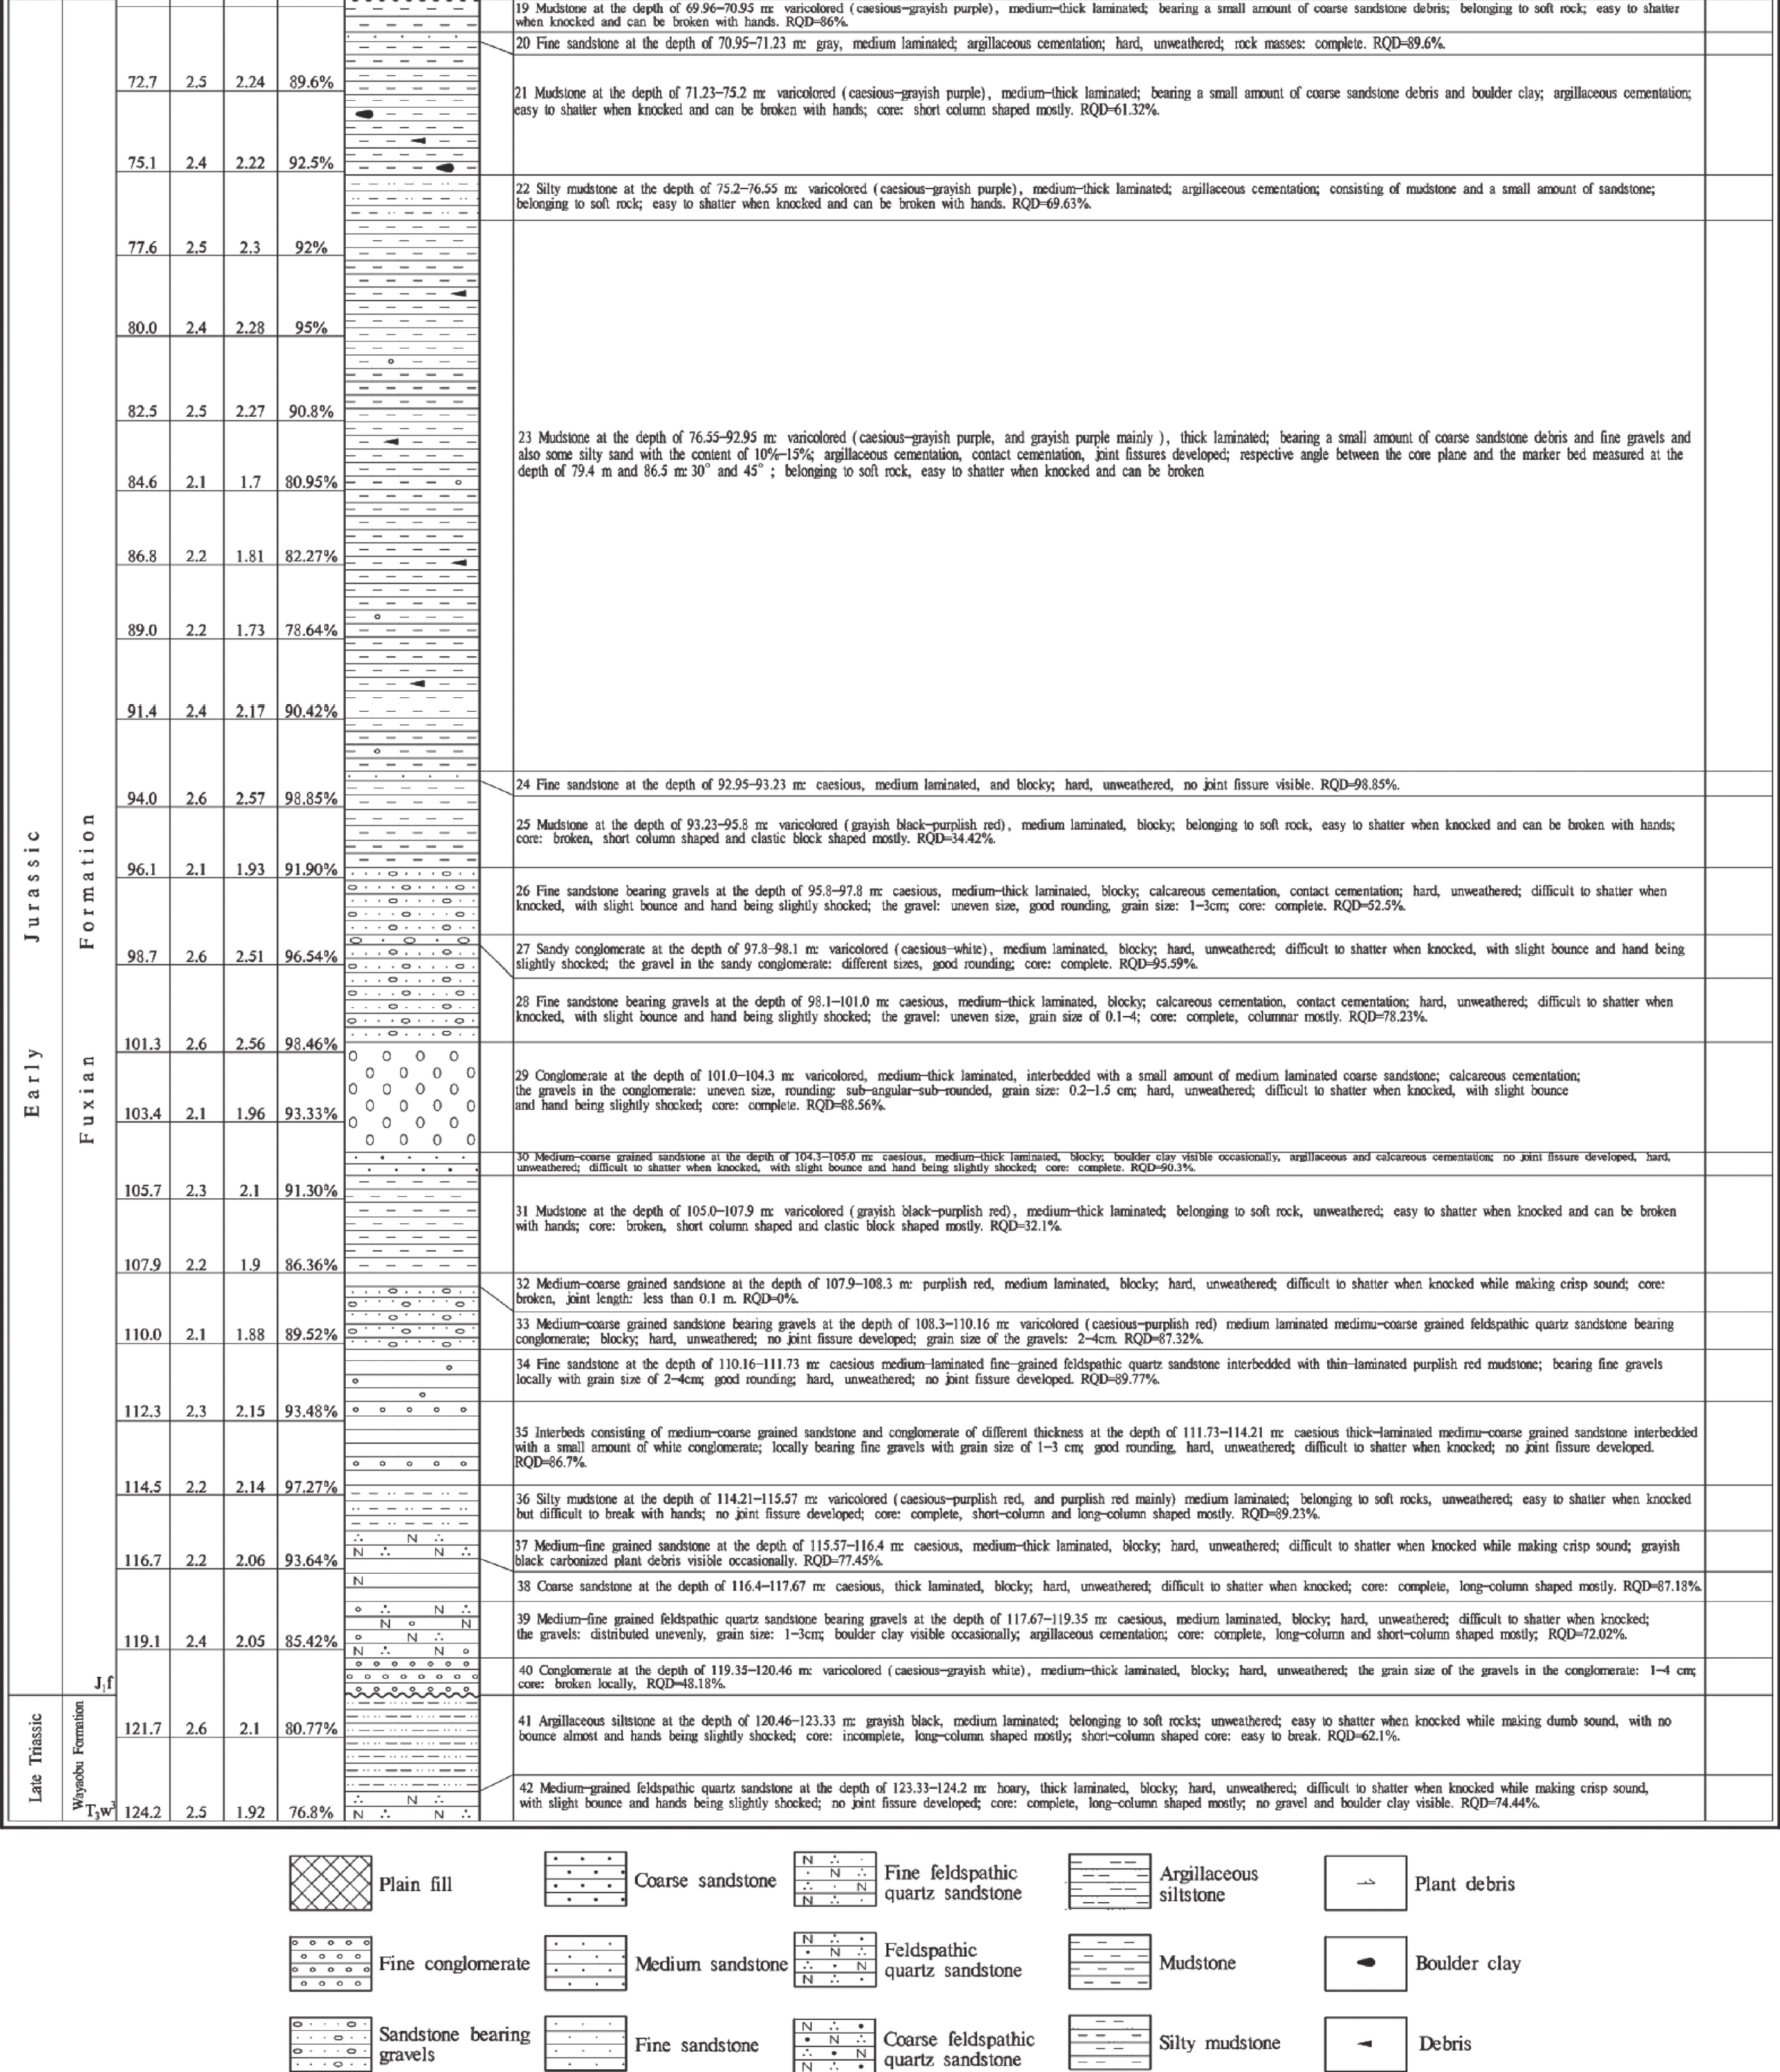
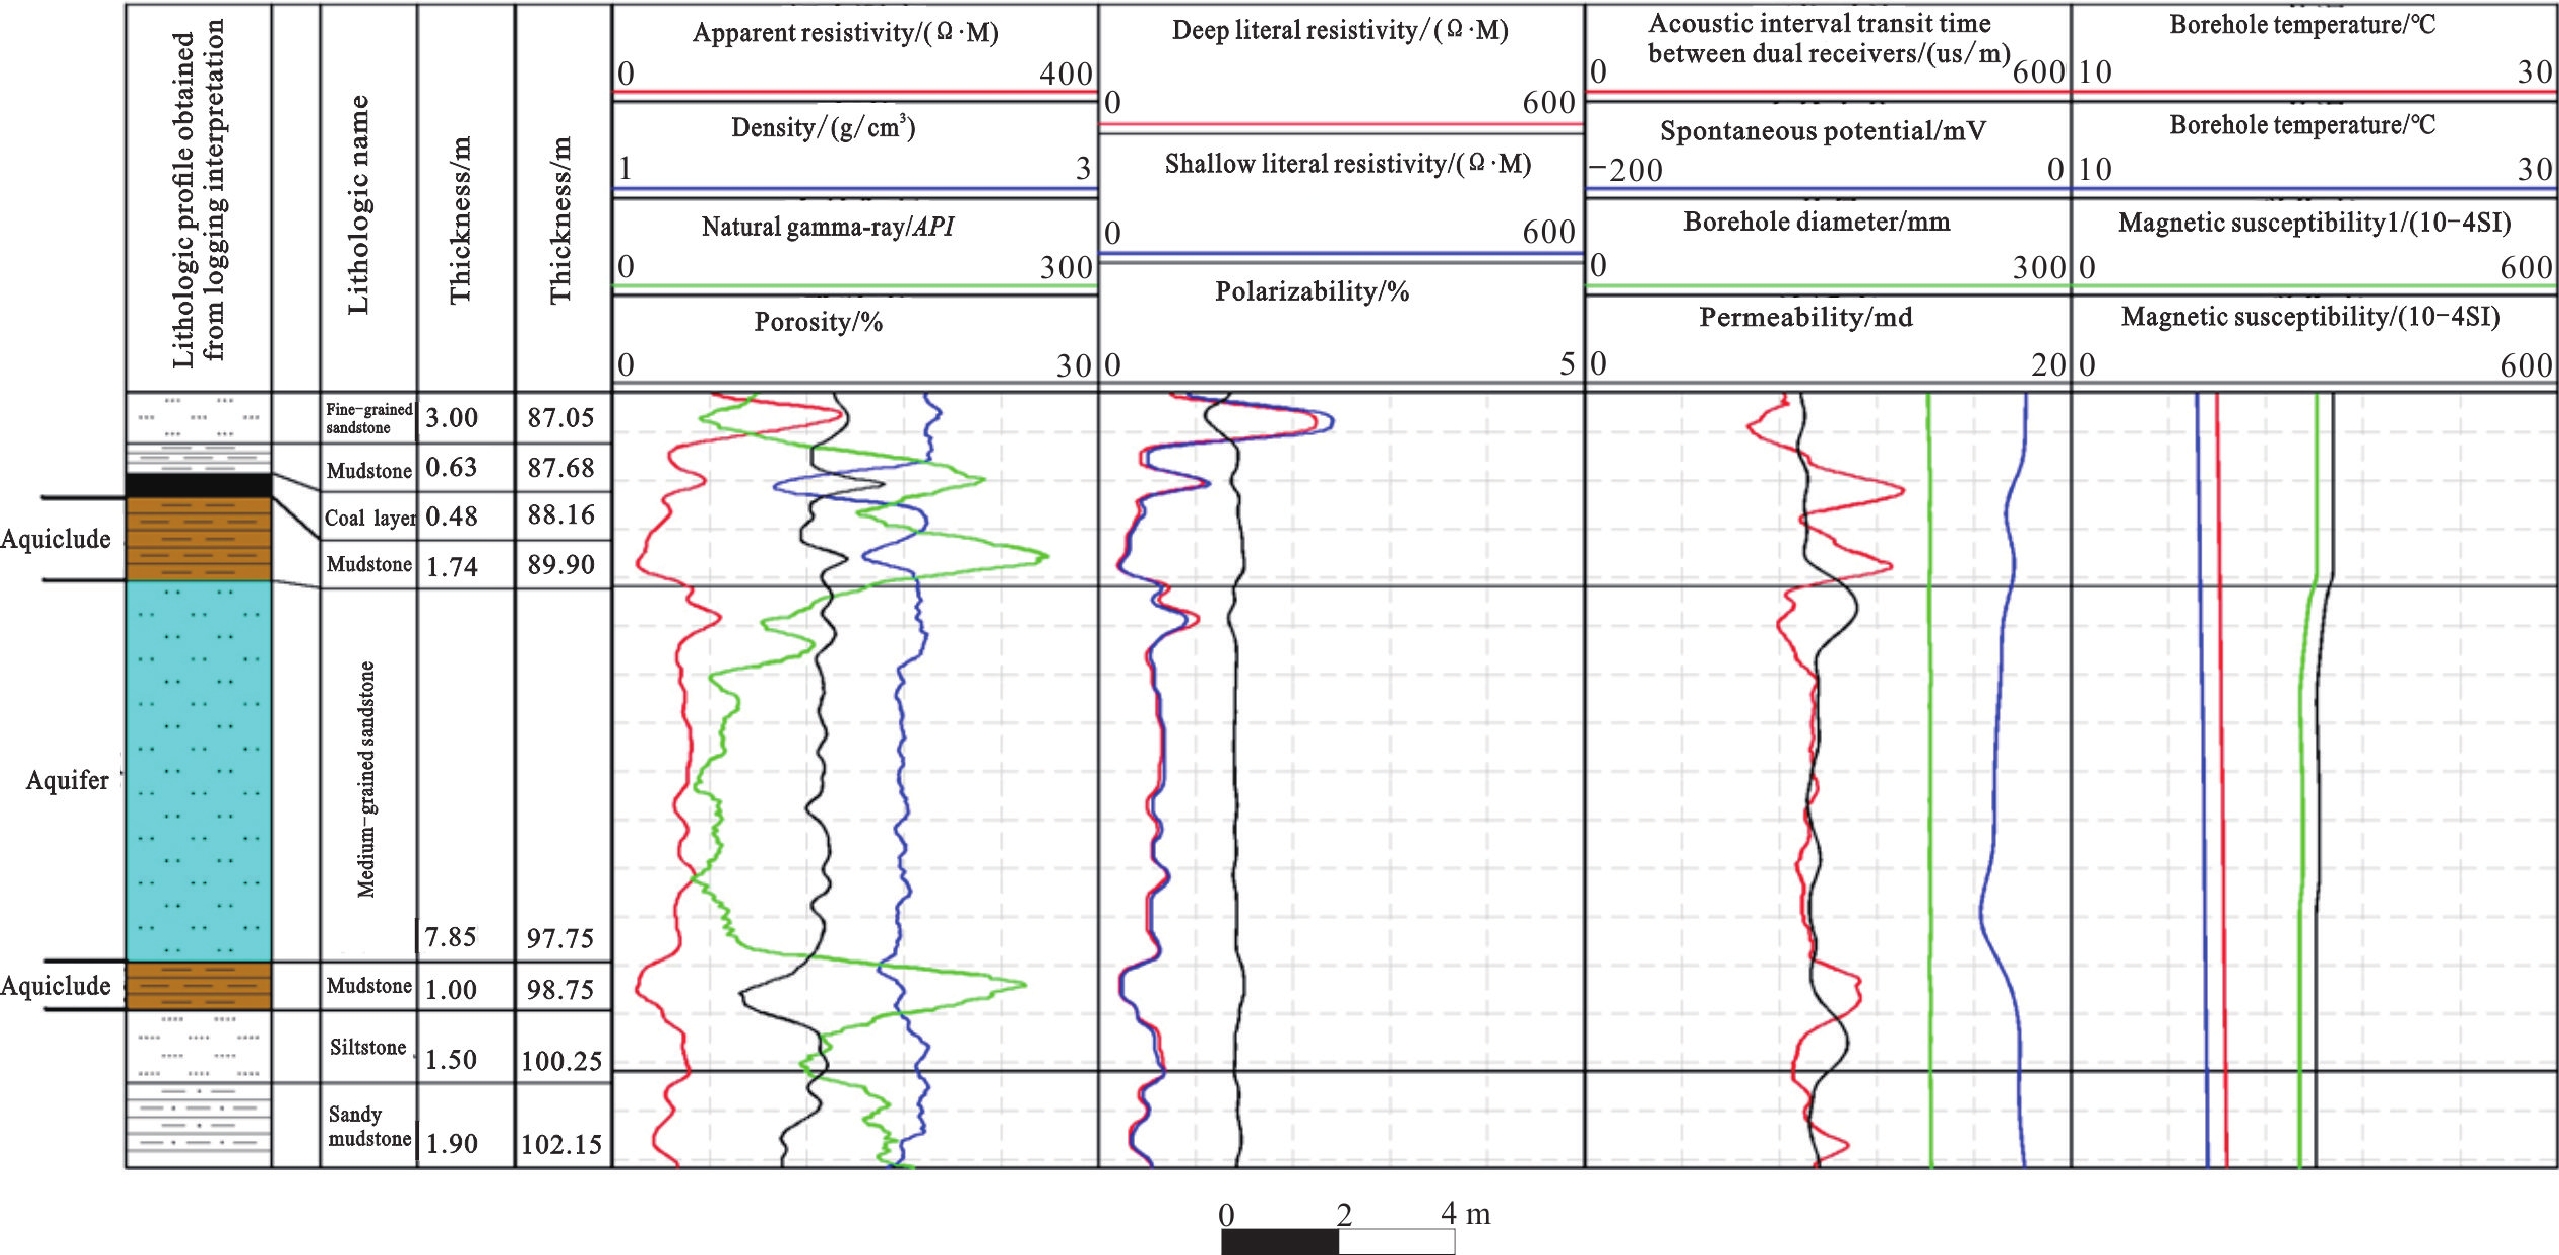
7. Characteristics of the Logging Curve of Engineering Geological Boreholes Drilled in the Yan’an Formation
![]()
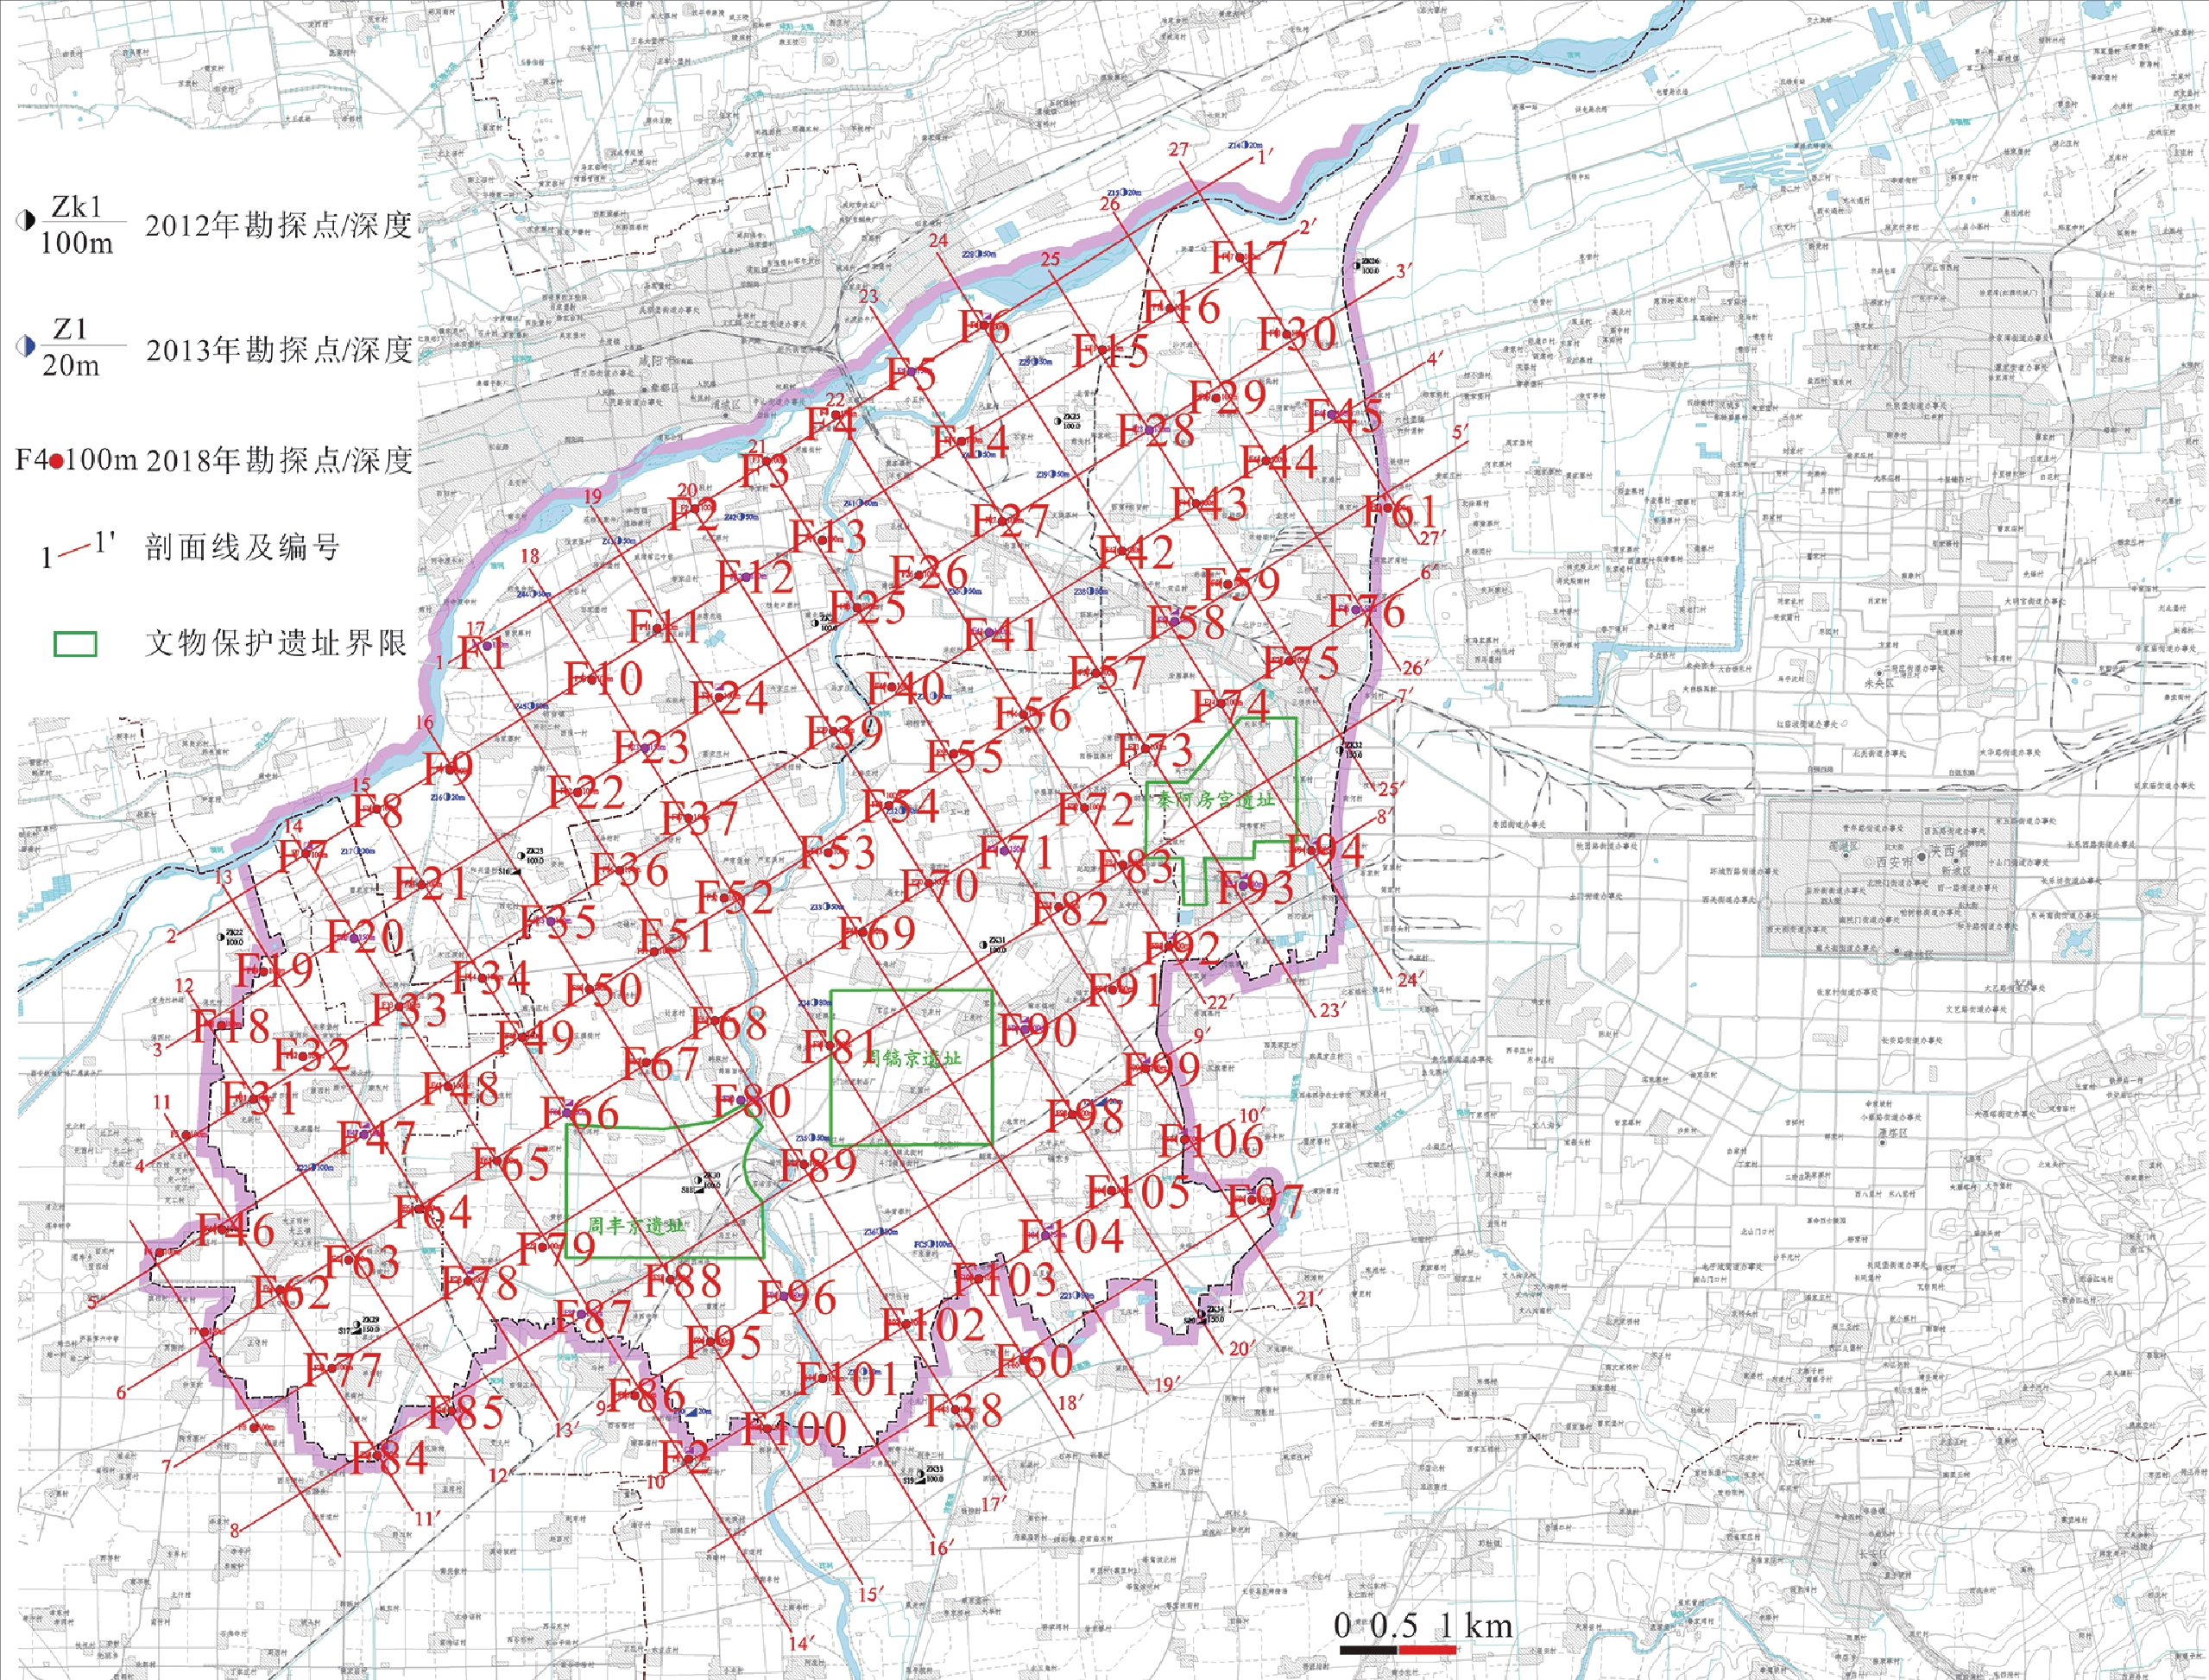
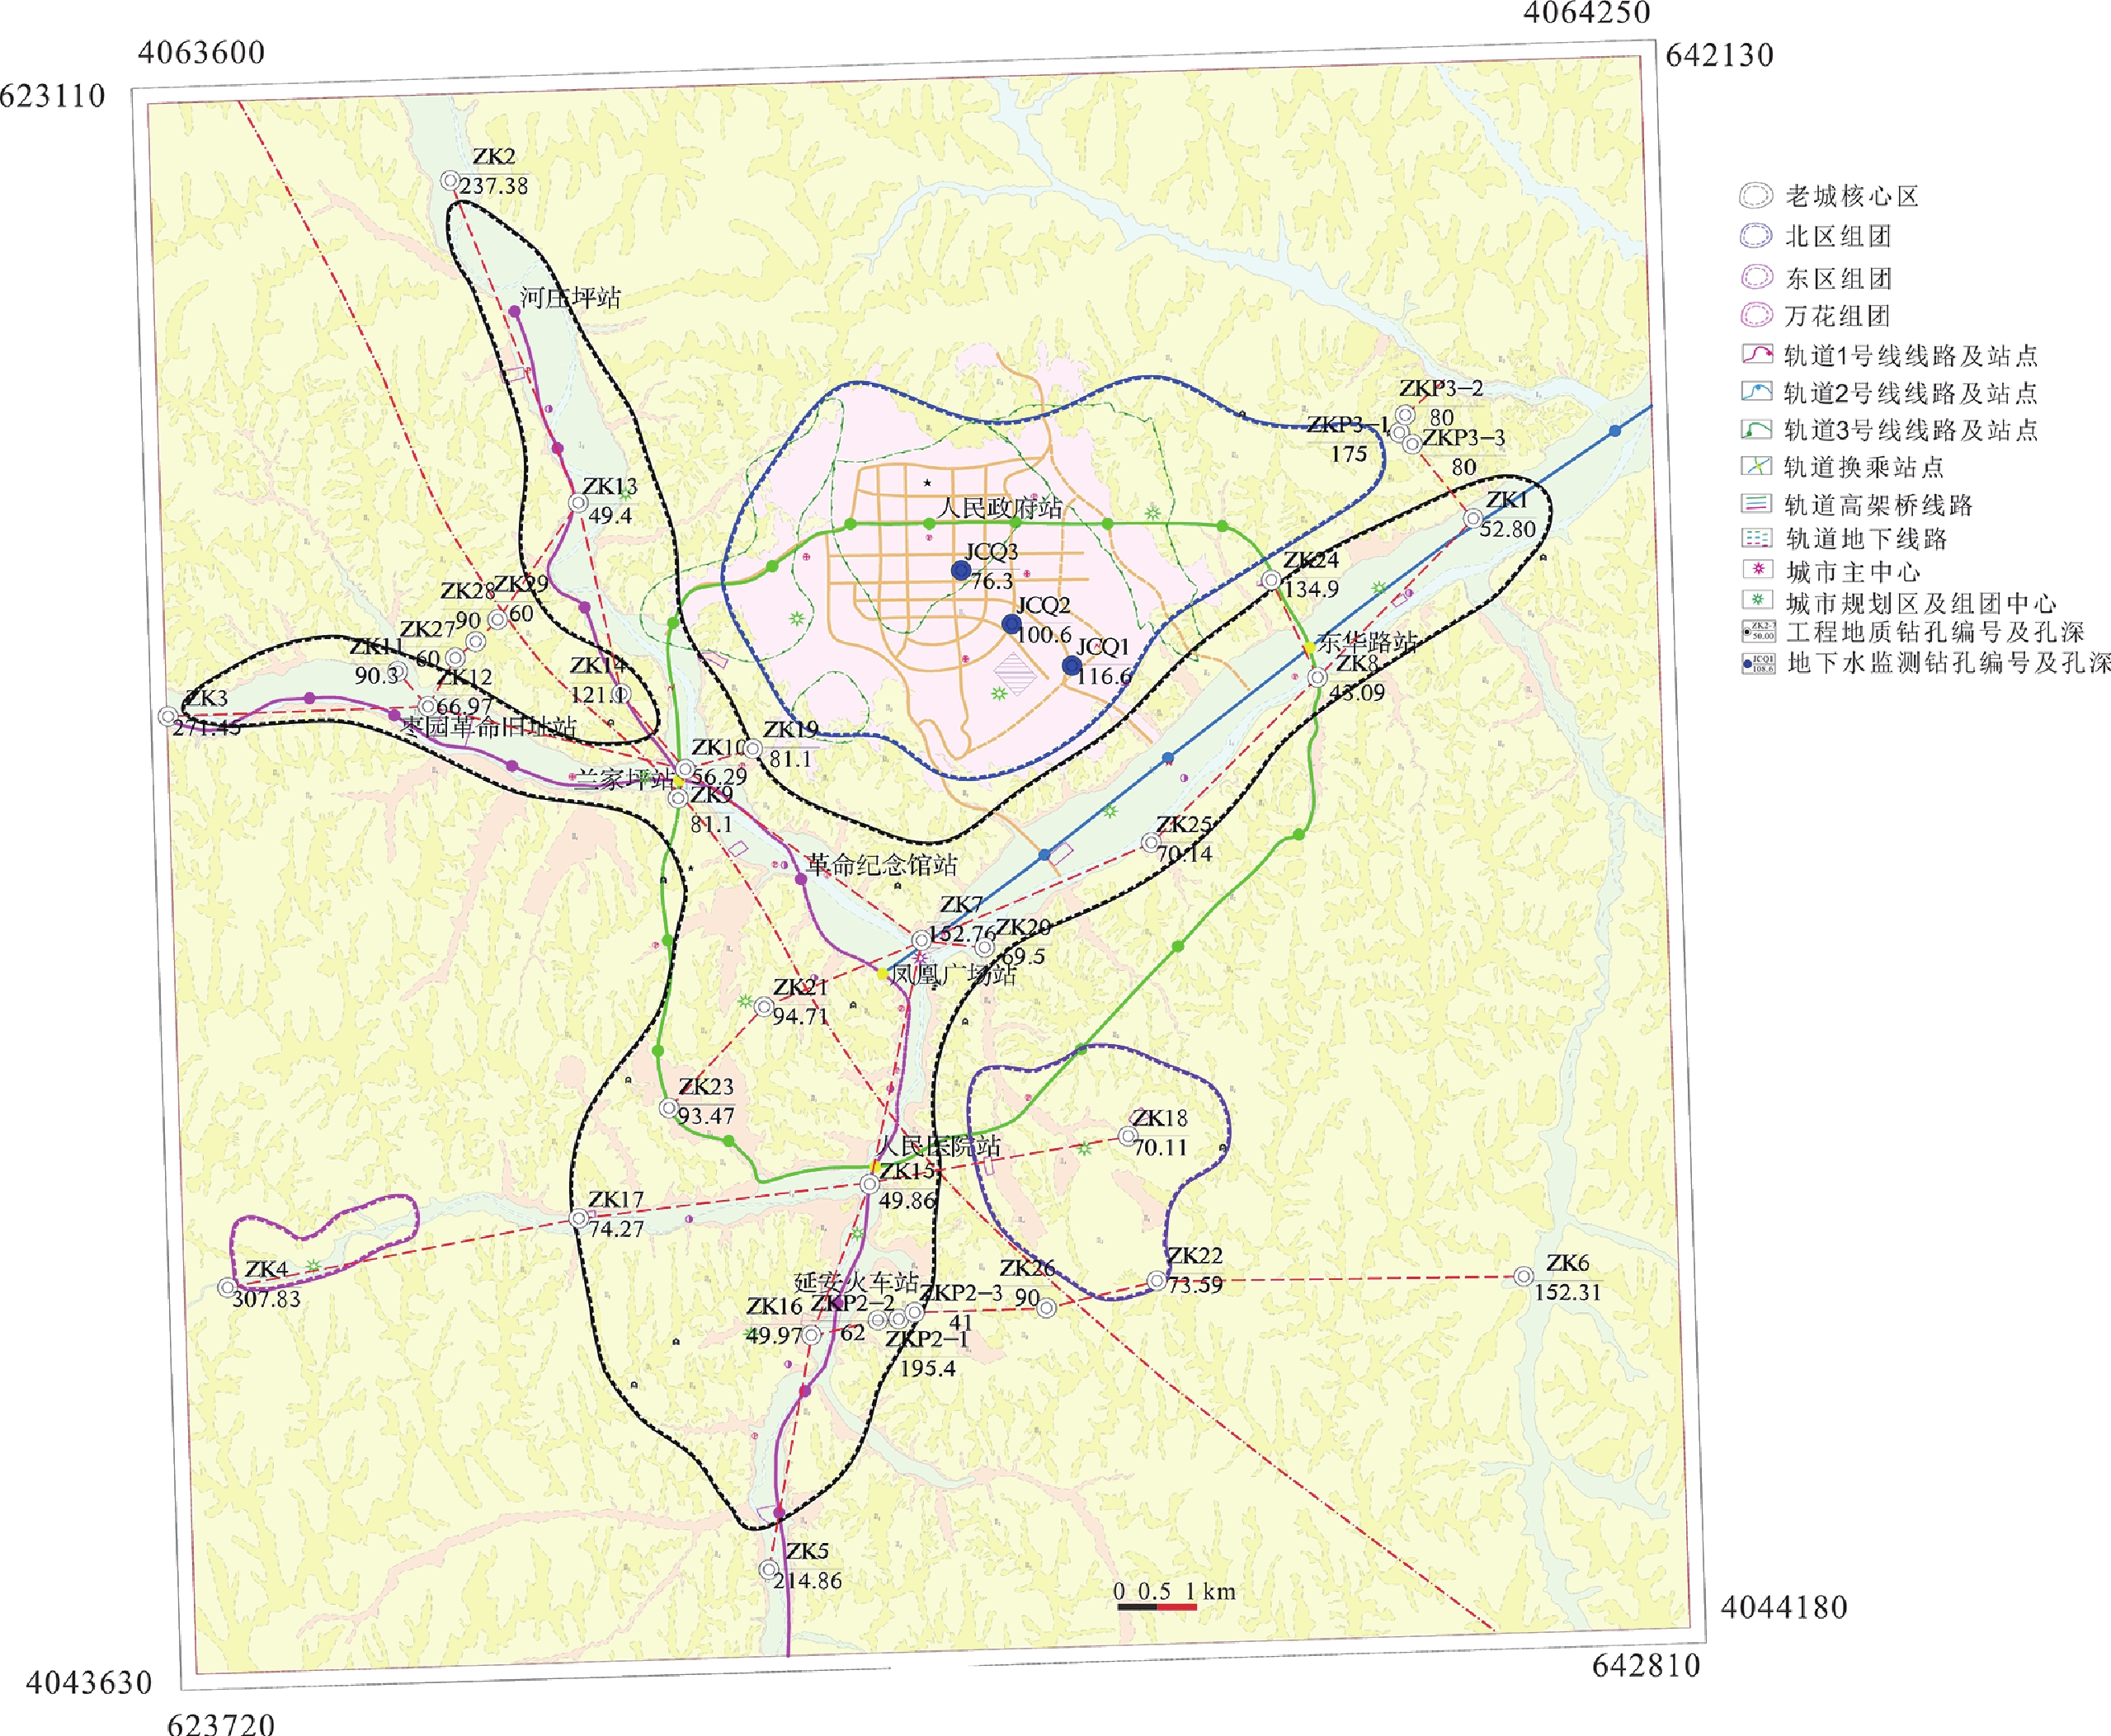
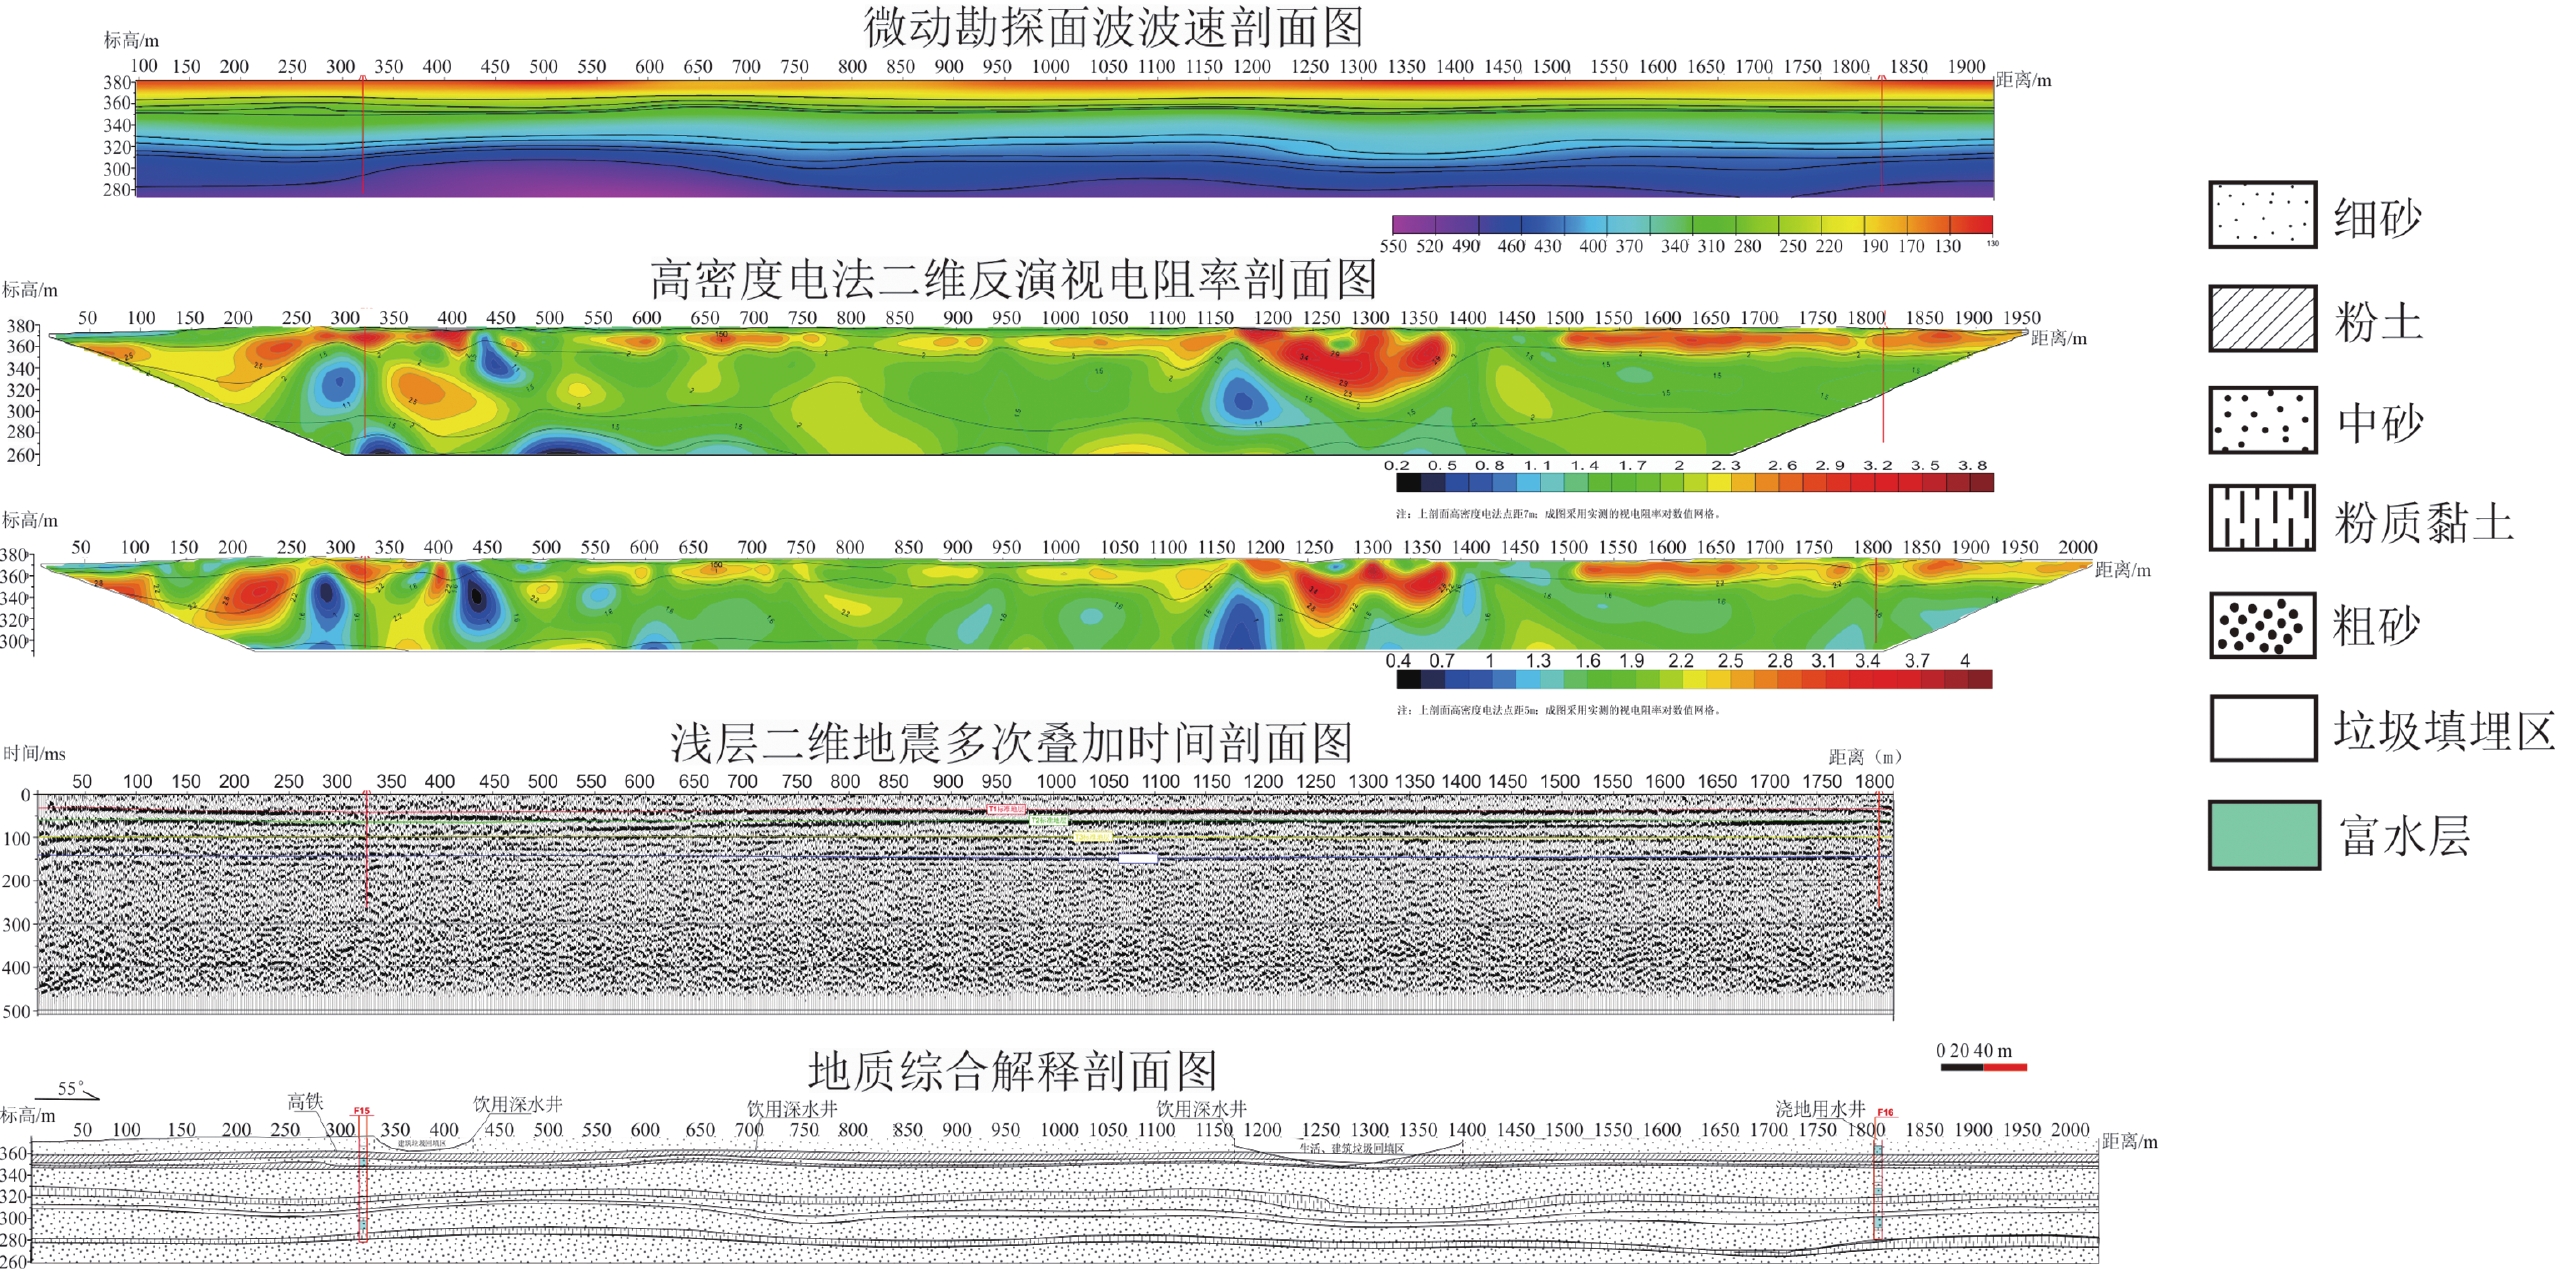
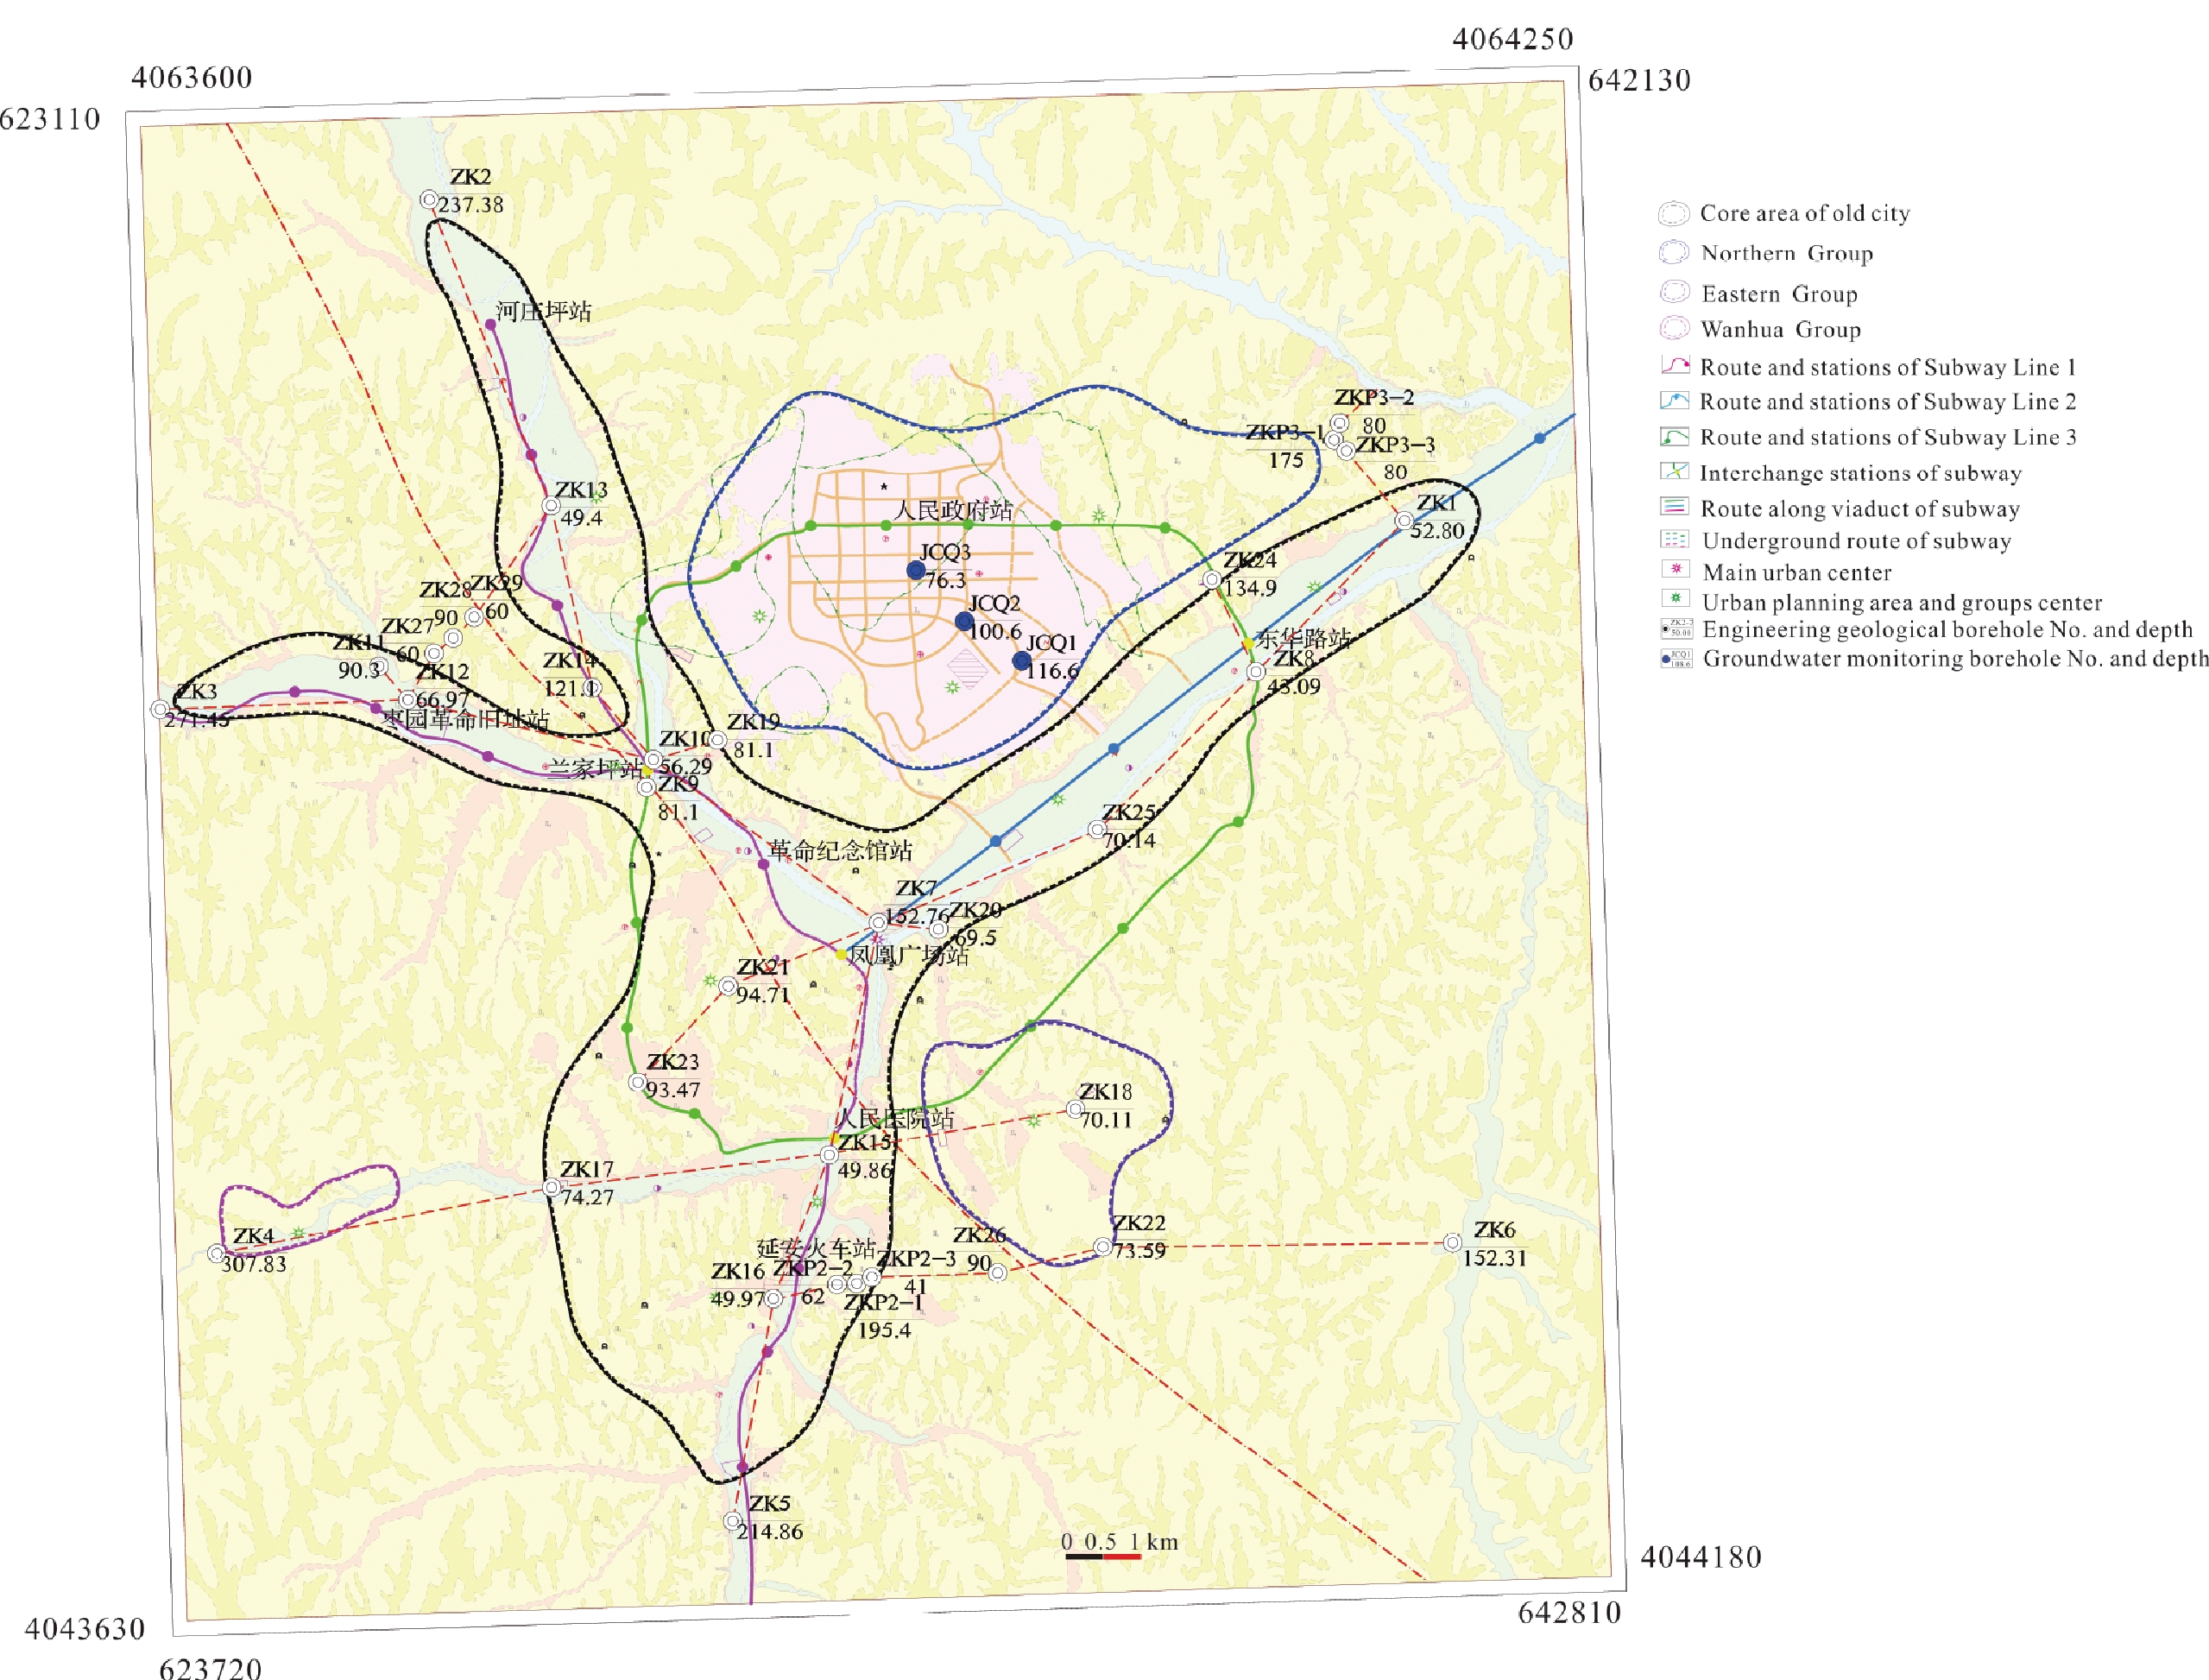
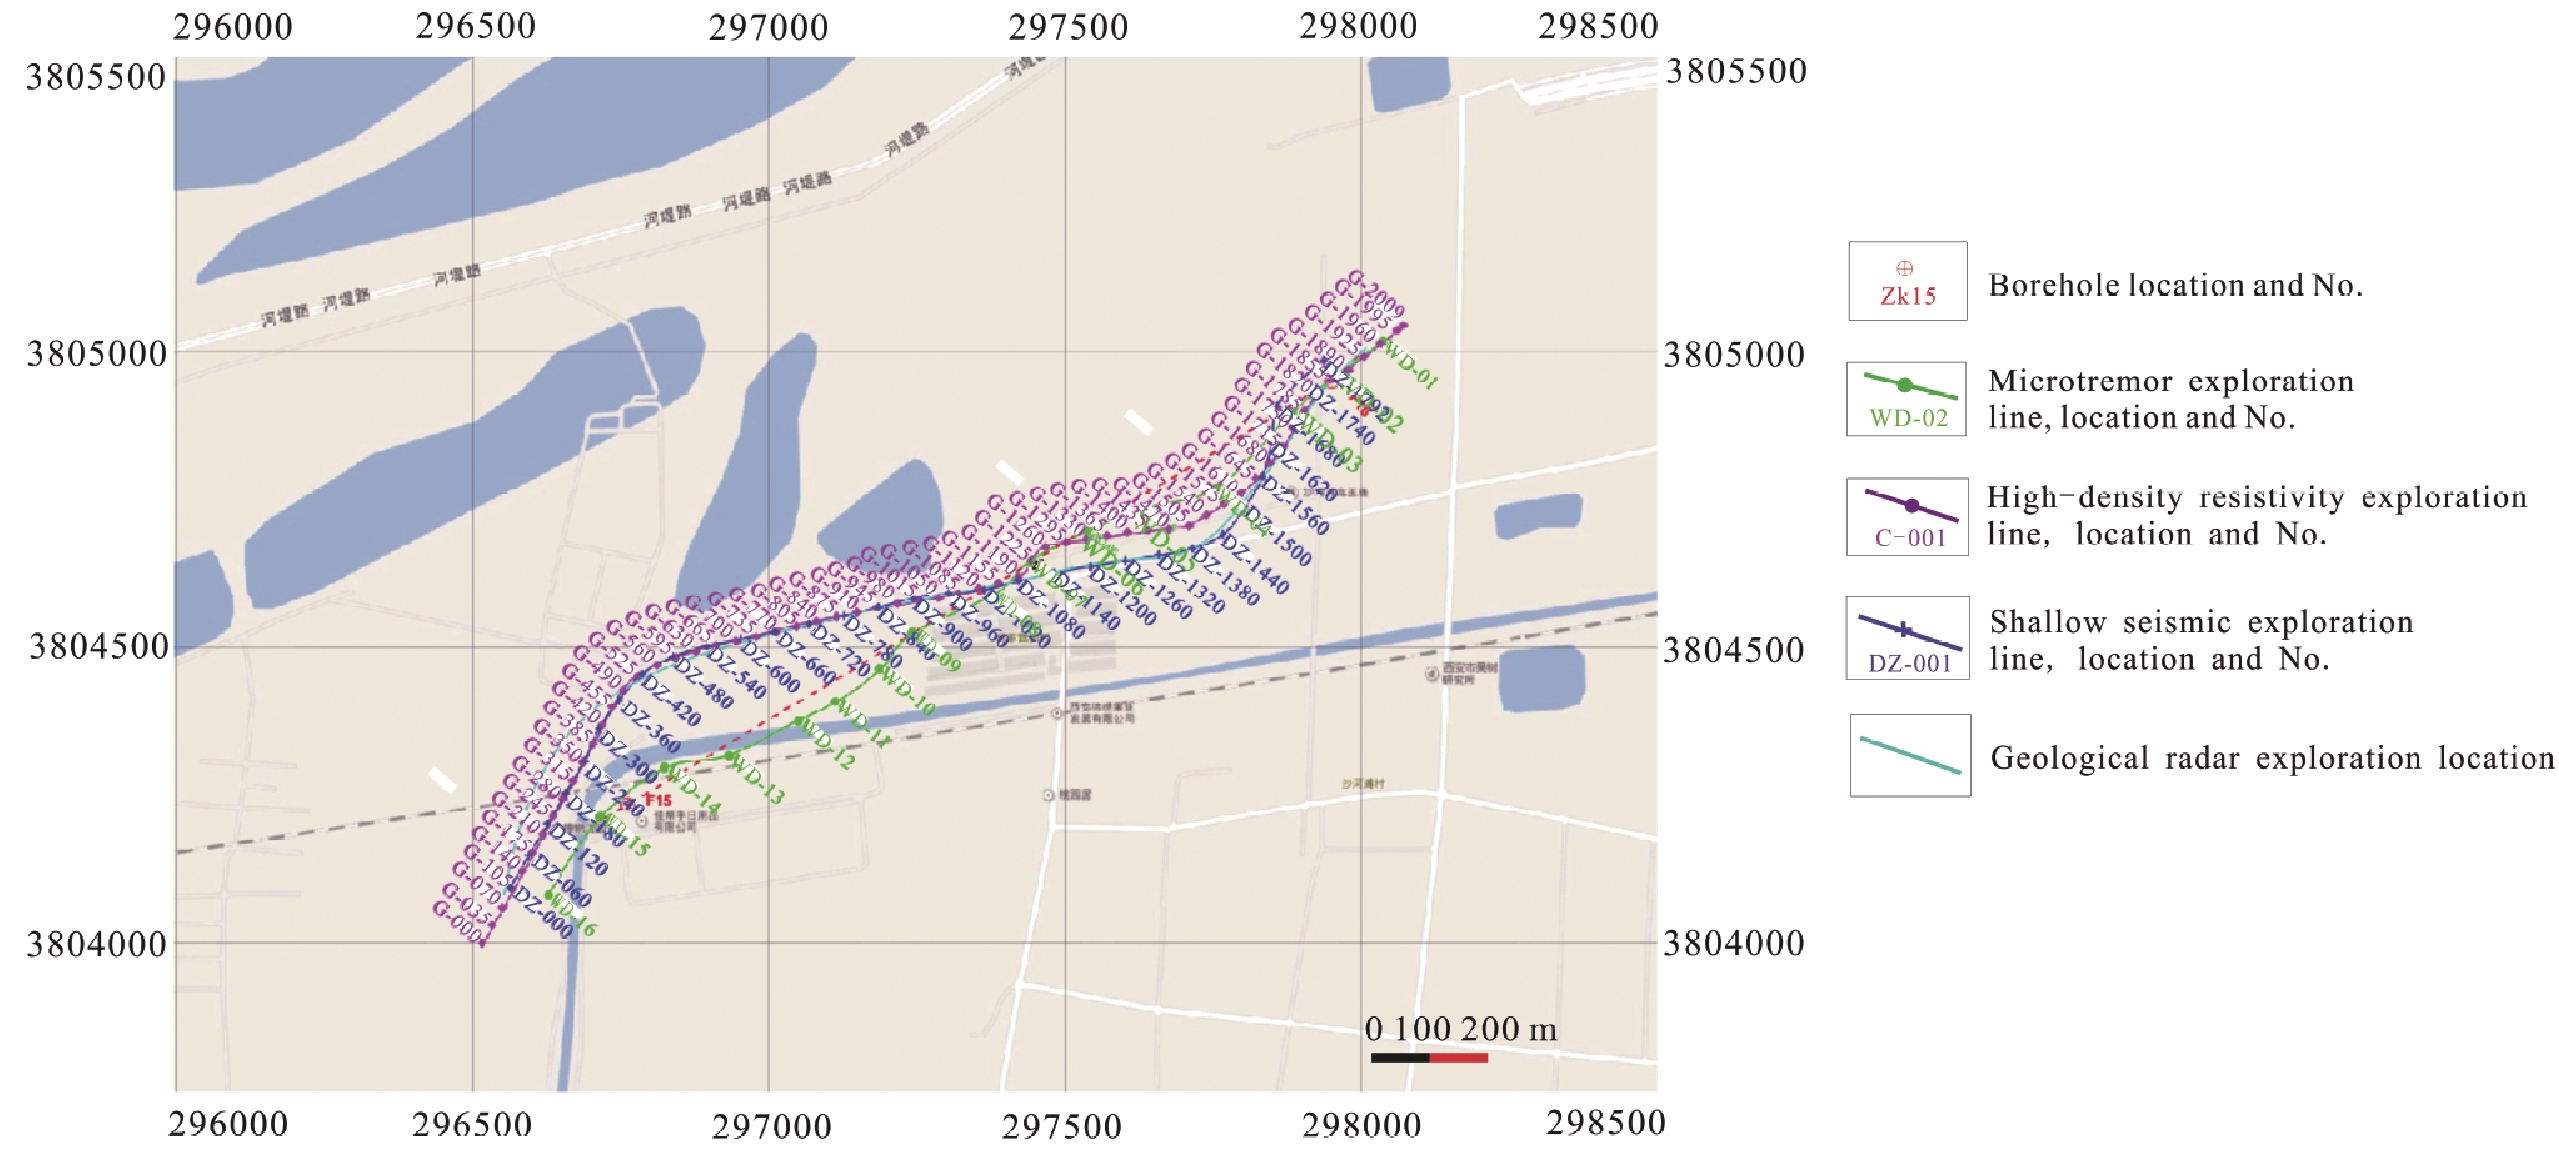
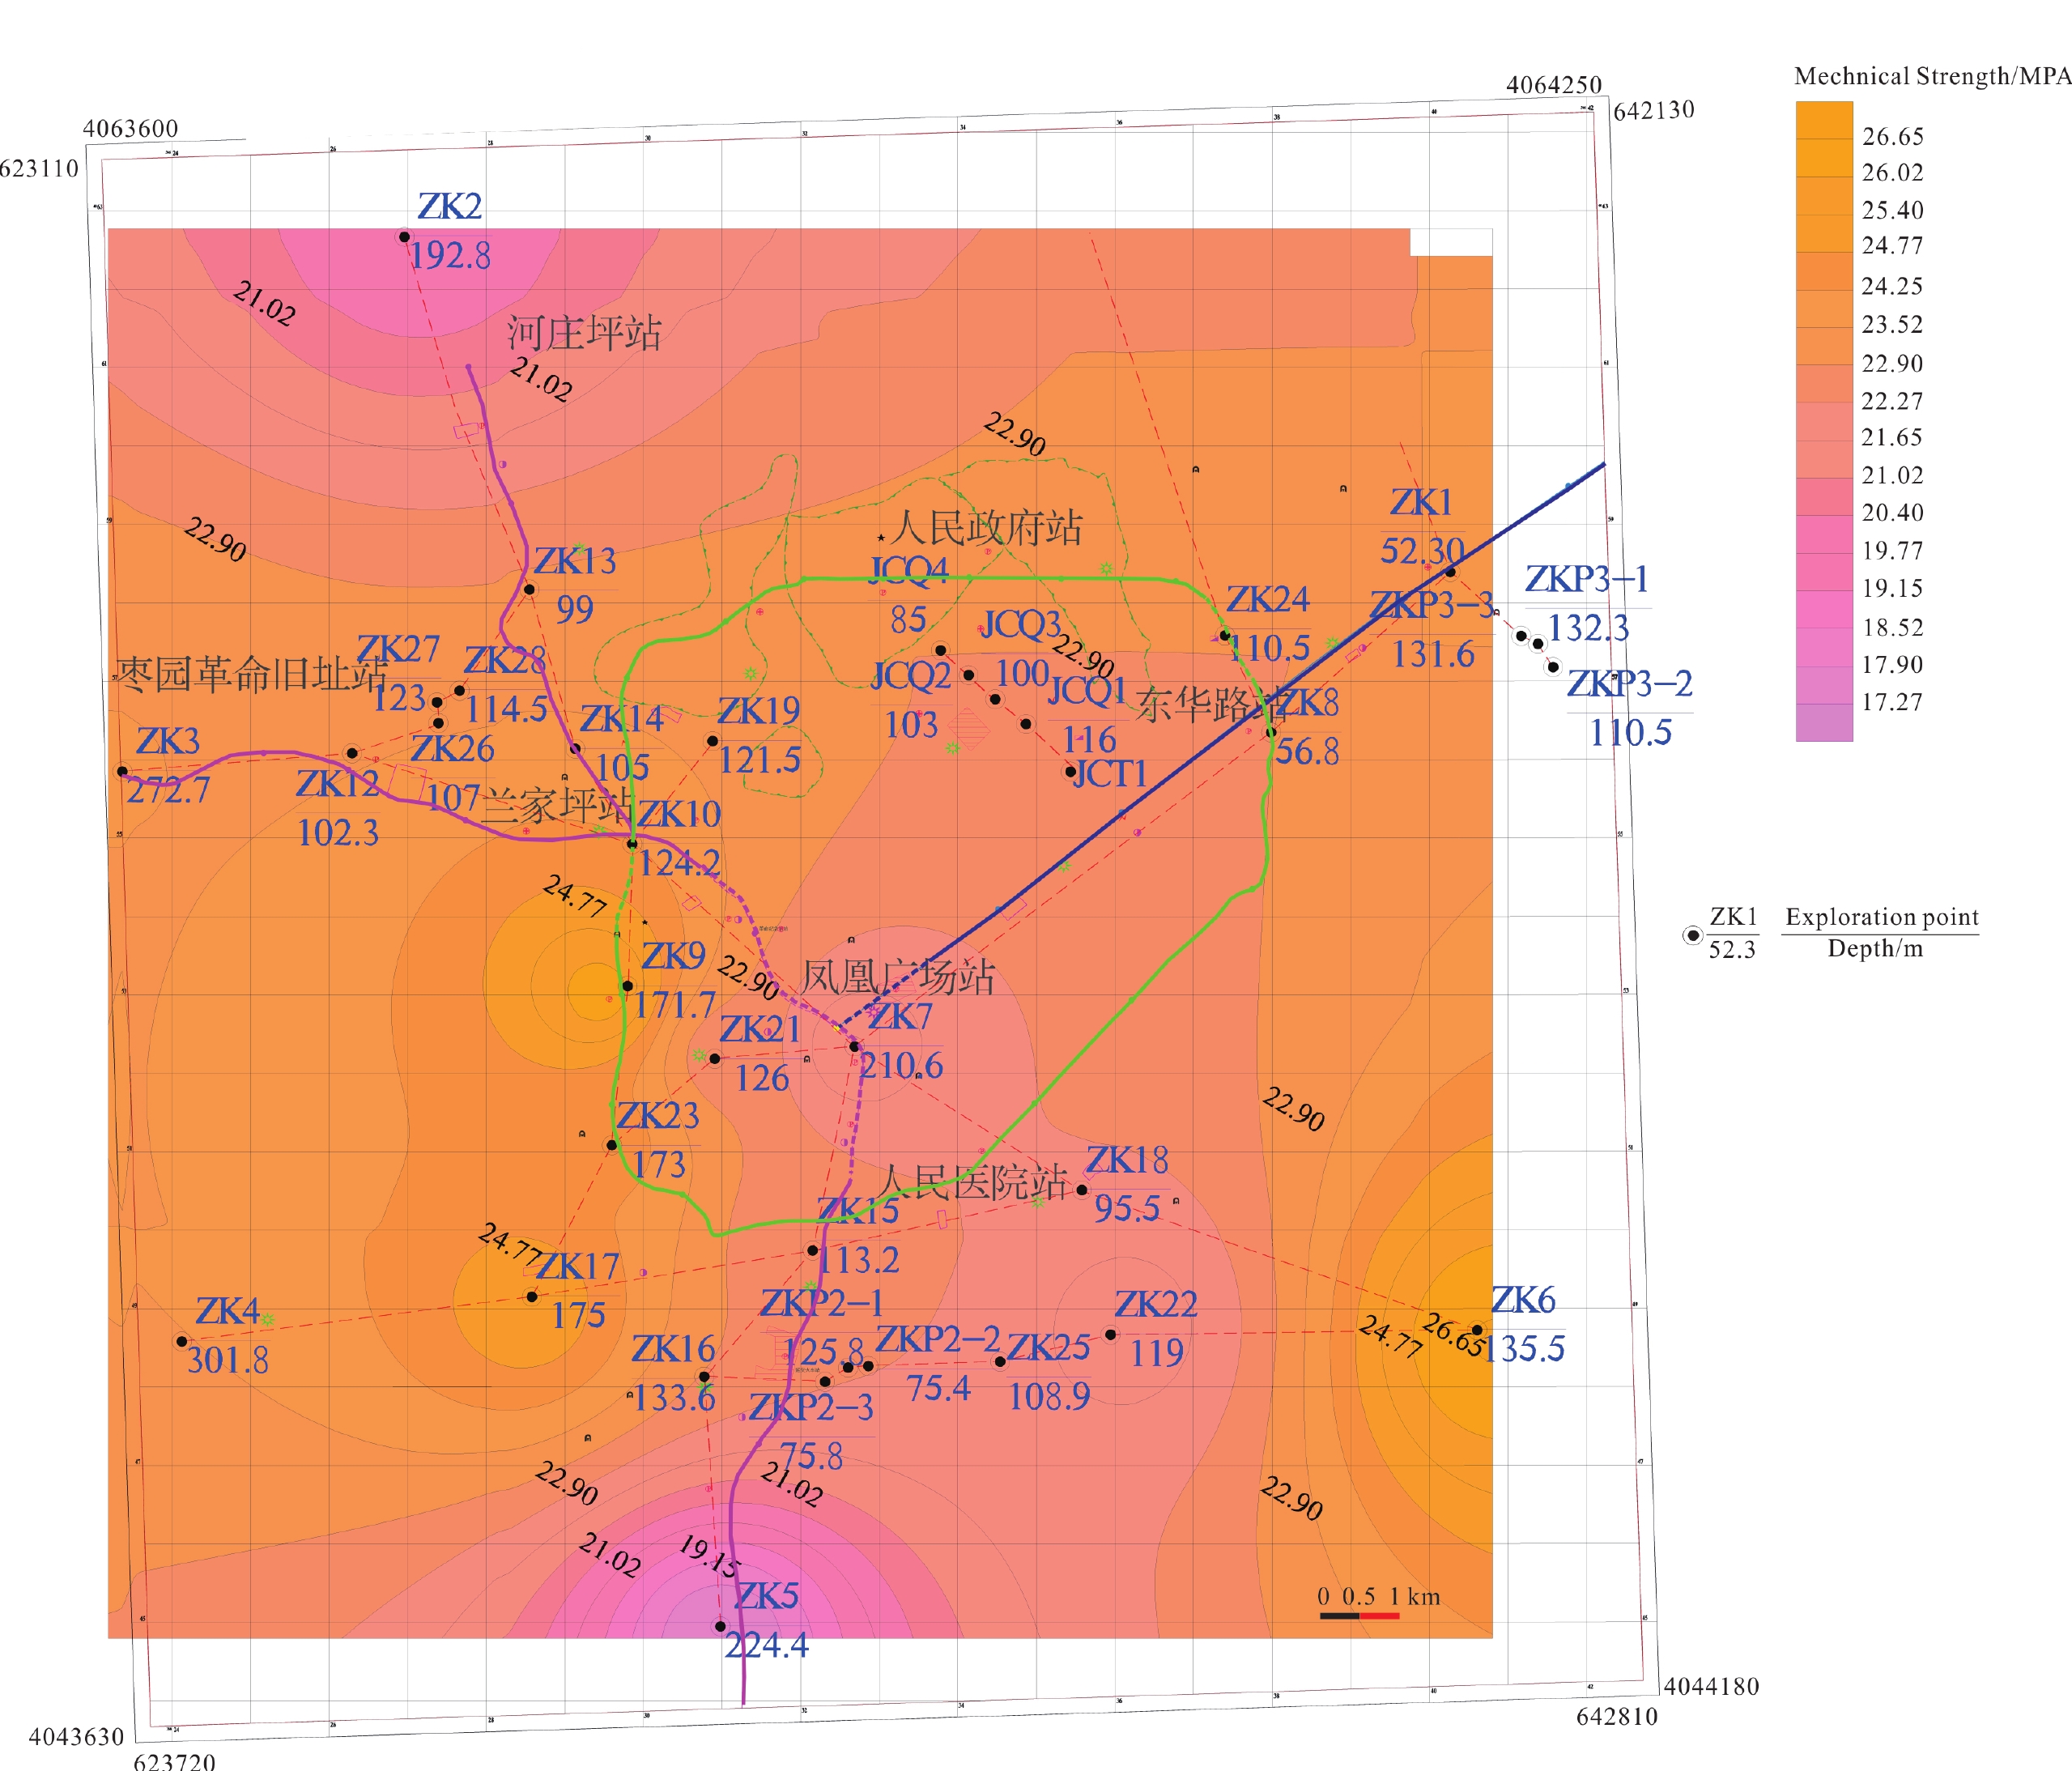
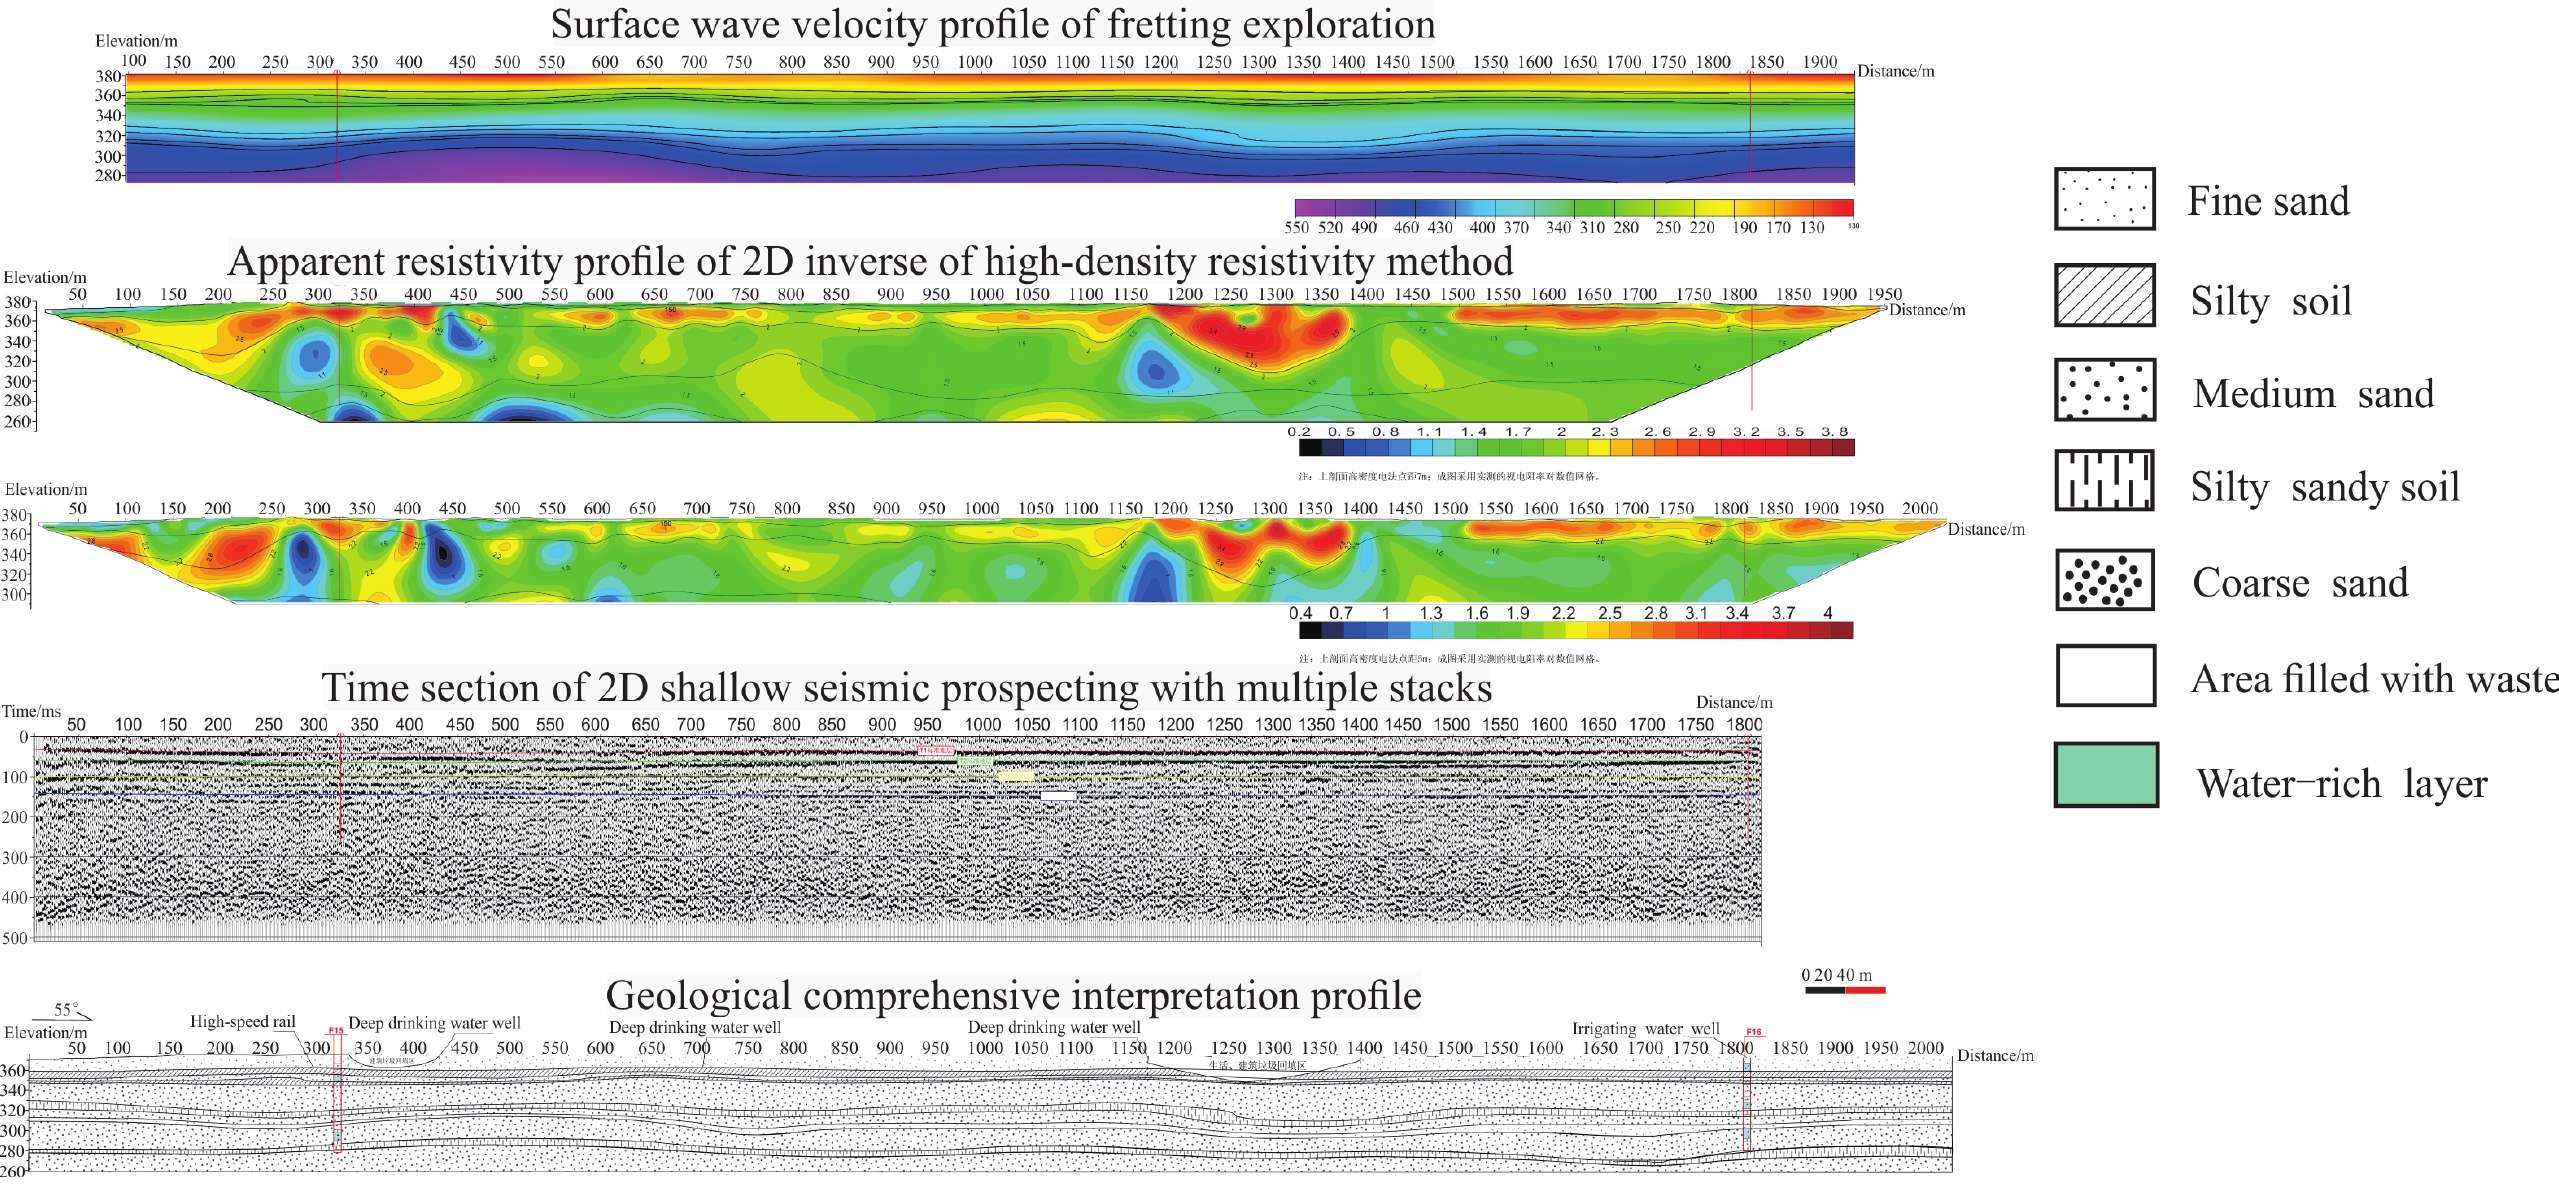
11. Comprehensive profiles of underground space exploration in Xi’an and interpretation results
表 1 数据库(集)元数据简表
条目 描述 数据库(集)名称 干扰环境下城市地下空间组合探测与全要素数据集 数据库(集)作者 张茂省,中国地质调查局西安地质调查中心,陕西省水资源与环境工程技术研究中心
王益民,中国地质调查局西安地质调查中心,陕西省水资源与环境工程技术研究中心
张 戈,中国地质调查局西安地质调查中心,陕西省水资源与环境工程技术研究中心
董 英,中国地质调查局西安地质调查中心,陕西省水资源与环境工程技术研究中心
孙萍萍,中国地质调查局西安地质调查中心,陕西省水资源与环境工程技术研究中心
贾 俊,中国地质调查局西安地质调查中心,陕西省水资源与环境工程技术研究中心
数据时间范围 2013—2018年 地理区域 西安市,东经107°24′~109°30′,北纬33°24′~34°24′
延安市,东经109°22′~109°37′,北纬36°27′~36°40′
山阳县,东经109°50′10″~109°56′57″,北纬33°30′27″~33°33′05″数据格式 .jpg,.xls,.doc,.mpj,.dwg 数据量 1.19 GB 数据服务系统网址 http://dcc.cgs.gov.cn 基金项目 中国地质调查局地质调查项目 “陕西省重要城镇地质灾害风险评估、关中-天水经济区综合地质调查、西安多要素城市地质调查、延安革命老区综合地质调查”(DD20160261、DD20189220、DD20189270) 语种 中文 数据库(集)组成 钻探数据包括:钻孔编号、钻孔地理位置、钻孔坐标、孔口高程、钻机类别、施工方法、施工日期、钻孔深度、地层岩性描述、分层序号、分层厚度、取样深度
测井数据包括:测量日期、测量深度、自然伽玛、自然电位、密度、声波时差、双侧向电阻率、极化率、磁化率、伽玛能谱、井温、井径、井斜
随钻监测数据包括:测量日期、钻进回次、加杆长度、钻孔深度、油缸位移、钻杆转速、油压、扭压
实验测试数据包括:土样测试数据为样品编号、取样深度、含水率、天然密度、粘聚力、内摩擦角、自重湿陷系数、比表面积,岩芯测试数据为样品编号、取样深度、声波速度、单轴抗压强度
地面物探数据包括:测量日期、探测方法、排列装置、测量点数、测线长度、采样间隔 下载: 导出CSV
表 2 西安市工程地质钻孔基本情况
钻孔
编号钻孔深度/m 编录岩性 测井 随钻监测 实验测试 白鹿原 200.00 黄土、粉质黏土、砂砾石层 有 机场 200.00 黄土、粉质黏土、细砂、砂砾石层 有 F1 150.00 细砂、中砂、粉质黏土、砂砾石层 有 F2 100.00 黄土状土、粉质黏土、中砂、粗砂 F3 100.00 黄土状土、粉质黏土、细砂、中砂 F4 100.00 黄土状土、粉质黏土、细砂、中砂、砂砾石层 有 F5 100.00 黄土状土、中砂、砂砾石层 有 F6 100.00 黄土状土、粉质黏土、细砂、粗砂 有 F7 100.20 黄土状土、粉质黏土、粗砂、砾砂 F8 100.00 黄土状土、粉质黏土、细砂、中砂 F9 100.00 粉质黏土、细砂、中砂、砂砾石层 有 F10 100.00 黄土状土、粉质黏土、细砂、中砂、砾砂 有 土样 F11 100.00 黄土状土、粉质黏土、细砂、中砂、砾砂、砂砾石层 有 F12 150.00 黄土状土、粉质黏土、细砂、中砂、粗砂、砂砾石层 有 土样 F13 100.00 粉质黏土、细砂、中砂、粗砂、砾砂、砂砾石层、 有 F14 100.00 粉质黏土、细砂、中砂、粗砂、砾砂 有 有 土样 F15 100.00 粉质黏土、细砂、中砂、粗砂、 有 F16 100.00 粉质黏土、细砂、中砂、粗砂、 有 有 土样 F17 100.00 粉质黏土、细砂、中砂、粗砂、 有 土样 F18 100.10 粉质黏土、细砂、中砂、粗砂、砾砂、砂砾石层 有 F19 100.00 中砂、砾砂、砂砾石层 有 有 土样 F20 150.00 粉质黏土、细砂、中砂、砾砂、砂砾石层 有 有 土样 F21 100.00 粉质黏土、细砂、中砂、粗砂、砾砂、砂砾石层 有 土样 F22 100.00 黄土状土、粉质黏土、细砂、中砂、粗砂、砾砂 有 土样 F23 150.00 粉质黏土、细砂、中砂、粗砂、砾砂、砂砾石层 有 土样 F24 100.00 黄土状土、粉质黏土、细砂、中砂 有 F25 100.00 粉质黏土、细砂、中砂、粗砂、砾砂 有 土样 F26 100.00 粉质黏土、细砂、中砂、砂砾石层 有 土样 F27 100.00 粉质黏土、中砂、粗砂 有 有 土样 F28 150.00 粉质黏土、细砂、粗砂 有 土样 F29 100.00 粉质黏土、细砂、粗砂 有 土样 F30 100.00 粉质黏土、细砂、粗砂 有 F31 100.00 粉质黏土、细砂、中砂、粗砂、砾砂 有 土样 F32 100.00 粉质黏土、细砂、中砂、粗砂、砾砂、砂砾石层 有 土样 F33 100.00 粉质黏土、细砂、中砂、砾砂、砂砾石层 土样 F34 100.00 粉质黏土、细砂、中砂、砾砂 有 土样 F35 150.00 黄土状土、粉质黏土、细砂、中砂、粗砂、砾砂 有 土样 F36 100.00 粉质黏土、细砂、中砂、粗砂、砂砾石层 有 土样 F37 100.00 粉质黏土、细砂、中砂、粗砂 有 土样 F38 100.00 黄土状土、粉质黏土、细砂、中砂、粗砂 有 F39 100.00 粉质黏土、细砂、中砂、粗砂、砂砾石层 有 土样 F40 100.20 粉质黏土、细砂、中砂、砾砂 有 F41 150.00 粉质黏土、细砂、中砂、粗砂、 有 有 土样 F42 100.00 细砂、中砂、粗砂、 有 土样 F43 100.00 粉质黏土、细砂、中砂、粗砂、 有 有 F44 100.00 粉质黏土、细砂、中砂、粗砂、砾砂、砂砾石层 有 土样 F45 150.00 粉质黏土、细砂、中砂、粗砂、 有 有 土样 F46 100.00 粉质黏土、细砂、中砂、粗砂、砾砂、砂砾石层 有 土样 F47 150.00 黄土状土、粉质黏土、细砂、中砂、砾砂、砂砾石层 有 有 土样 F48 100.00 黄土状土、粉质黏土、细砂、中砂、粗砂、砾砂、砂砾石层 有 F49 100.00 粉质黏土、细砂、中砂、粗砂、砾砂 有 土样 F50 100.00 粉质黏土、细砂、中砂、粗砂、砾砂、砂砾石层 有 土样 F51 100.00 粉质黏土、细砂、中砂、砂砾石层 有 土样 F52 100.00 细砂、中砂、砾砂 有 土样 F53 100.00 粉质黏土、细砂、中砂、砾砂 有 土样 F54 100.00 粉质黏土、细砂、中砂、粗砂、砾砂 有 土样 F55 100.00 粉质黏土、细砂、中砂、粗砂、砾砂 有 土样 F56 100.00 粉质黏土、细砂、中砂、砾砂 有 F57 100.00 粉质黏土、细砂、中砂、粗砂 有 有 土样 F58 150.00 粉质黏土、细砂、中砂、粗砂、砂砾石层 有 有 土样 F59 100.00 粉质黏土、细砂、中砂、砾砂 有 土样 F60 100.50 黄土状土、粉质黏土、细砂、中砂 有 F61 100.00 粉质黏土、细砂、中砂、砾砂 有 土样 F62 100.40 黄土状土、粉质黏土、中砂 有 F63 100.00 粉质黏土、中砂、砾砂 有 F64 100.00 粉质黏土、细砂、中砂、砂砾石层 有 有 土样 F66 150.00 黄土状土、粉质黏土、细砂、中砂、砂砾石层 有 有 F67 100.10 粉质黏土、细砂、中砂、粗砂、砾砂 有 F68 100.00 粉质黏土、细砂、中砂、砂砾石层 有 土样 F69 100.00 粉质黏土、细砂、中砂 有 土样 F70 100.00 粉质黏土、细砂、中砂、粗砂 有 有 土样 F71 150.00 粉质黏土、细砂、粗砂、砾砂 有 有 土样 F72 100.00 粉质黏土、细砂、中砂 有 有 土样 F73 100.00 粉质黏土、细砂、中砂 有 土样 F74 100.00 粉质黏土、细砂、中砂、粗砂 有 土样 F75 100.00 粉质黏土、细砂、中砂 有 土样 F76 150.00 粉质黏土、细砂、中砂、粗砂、砾砂 有 土样 F77 100.20 粉质黏土、细砂、中砂、粗砂 有 F78 100.10 黄土状土、粉质黏土、中砂、粗砂、砾砂 F79 100.10 粉质黏土、细砂、中砂、粗砂 有 F80 150.10 粉质黏土、细砂、中砂、砾砂 有 F81 100.50 粉质黏土、细砂、中砂、粗砂、砾砂 有 F82 100.30 粉质黏土、细砂、中砂 有 F83 100.00 粉质黏土、细砂、中砂、砾砂、砂砾石层 有 土样 F84 100.50 黄土状土、粉质黏土、细砂、中砂 有 F85 100.10 黄土状土、粉质黏土、中砂、砾砂 F86 100.20 粉质黏土、细砂、中砂 有 F87 150.00 粉质黏土、细砂、中砂、砾砂、砂砾石层 有 土样 F88 100.20 黄土状土、粉质黏土、中砂、粗砂、砾砂 有 F89 100.20 粉质黏土、细砂、中砂、粗砂 有 F90 150.00 粉质黏土、细砂、中砂、粗砂 有 有 土样 F91 100.00 粉质黏土、细砂、中砂 有 土样 F92 100.00 粉质黏土、中砂 有 有 土样 F93 150.40 粉质黏土、细砂、中砂、粗砂、砂砾石层 有 F95 100.20 粉质黏土、细砂、中砂 有 F96 150.30 粉质黏土、细砂、中砂、粗砂 有 F97 100.50 黄土状土、粉质黏土、中砂、粗砂 有 F98 100.50 粉质黏土、细砂、中砂、粗砂 有 F99 100.10 粉质黏土、细砂、中砂、粗砂 有 F100 100.10 粉质黏土、中砂、粗砂 有 F101 100.00 粉质黏土、细砂、中砂 有 土样 F102 100.00 粉质黏土、细砂、中砂 有 F103 100.20 粉质黏土、细砂、中砂 有 F104 150.00 粉质黏土、细砂、中砂 有 有 土样 F105 100.40 粉质黏土、细砂、中砂、粗砂 有 有 F106 100.00 黄土状土、粉质黏土、细砂、中砂、粗砂 有 土样
下载: 导出CSV
表 3 延安市工程地质钻孔基本情况
钻孔
编号钻孔深度/m 编录岩性 测井 随钻监测 实验测试 ZK01 52.30 粉质黏土、砂砾石层、细砂岩、泥岩 ZK02 192.86 粉质黏土、砂砾石层、细砂岩、泥岩、粗砂岩 有 有 岩芯 ZK03 272.68 粉质黏土、砂砾石层、细砂岩、泥岩、粗砂岩 有 有 岩芯 ZK04 293.00 细砂岩、泥岩、粗砂岩 有 有 ZK05 214.00 细砂岩、泥岩、粗砂岩 有 岩芯 ZK06 139.00 砂砾石层、细砂岩、泥岩 有 有 岩芯 ZK07 202.00 细砂岩、泥岩、粗砂岩 有 有 ZK08 56.80 粉质黏土、砂砾石层、细砂岩、泥岩 ZK09 151.00 黄土、细砂岩、泥岩、粗砂岩 有 ZK10 119.50 细砂岩、泥岩、粗砂岩 ZK12 102.00 粉质黏土、砂砾石层、细砂岩、泥岩、粗砂岩 有 ZK13 92.00 粉质黏土、细砂、砂砾石层、细砂岩、泥岩、粗砂岩 岩芯 ZK14 90.00 黄土、红黏土、细砂岩、泥岩 有 土样 ZK15 99.00 细砂岩、泥岩、粗砂岩 有 岩芯 ZK16 130.00 细砂岩、泥岩、粗砂岩 岩芯 ZK17 174.00 细砂岩、泥岩、粗砂岩 有 岩芯 ZK18 92.00 细砂岩、泥岩、粗砂岩 ZK19 120.00 黄土、红黏土、粗砂岩 有 ZK21 118.00 细砂岩、泥岩、粗砂岩 有 ZK22 98.00 黄土、细砂岩、泥岩、粗砂岩 有 ZK23 173.00 红黏土、细砂岩、泥岩、粗砂岩 有 ZK24 104.00 黄土 土样 ZK25 89.00 黄土、红黏土 ZK26 64.00 黄土、红黏土、细砂岩、泥岩、 土样 ZK27 123.00 黄土 土样 ZK28 108.00 黄土、红黏土、细砂岩、泥岩、 土样 ZKP2-1 126.80 黄土、红黏土、细砂岩、泥岩、 ZKP2-2 75.40 红黏土、细砂岩、泥岩 ZKP2-3 50.00 黄土、细砂岩、泥岩、粗砂岩 ZKP3-1 117.00 黄土、红黏土 土样 ZKP3-2 110.00 黄土、红黏土、细砂岩、泥岩、 土样 ZKP3-3 131.50 黄土、红黏土 土样
下载: 导出CSV
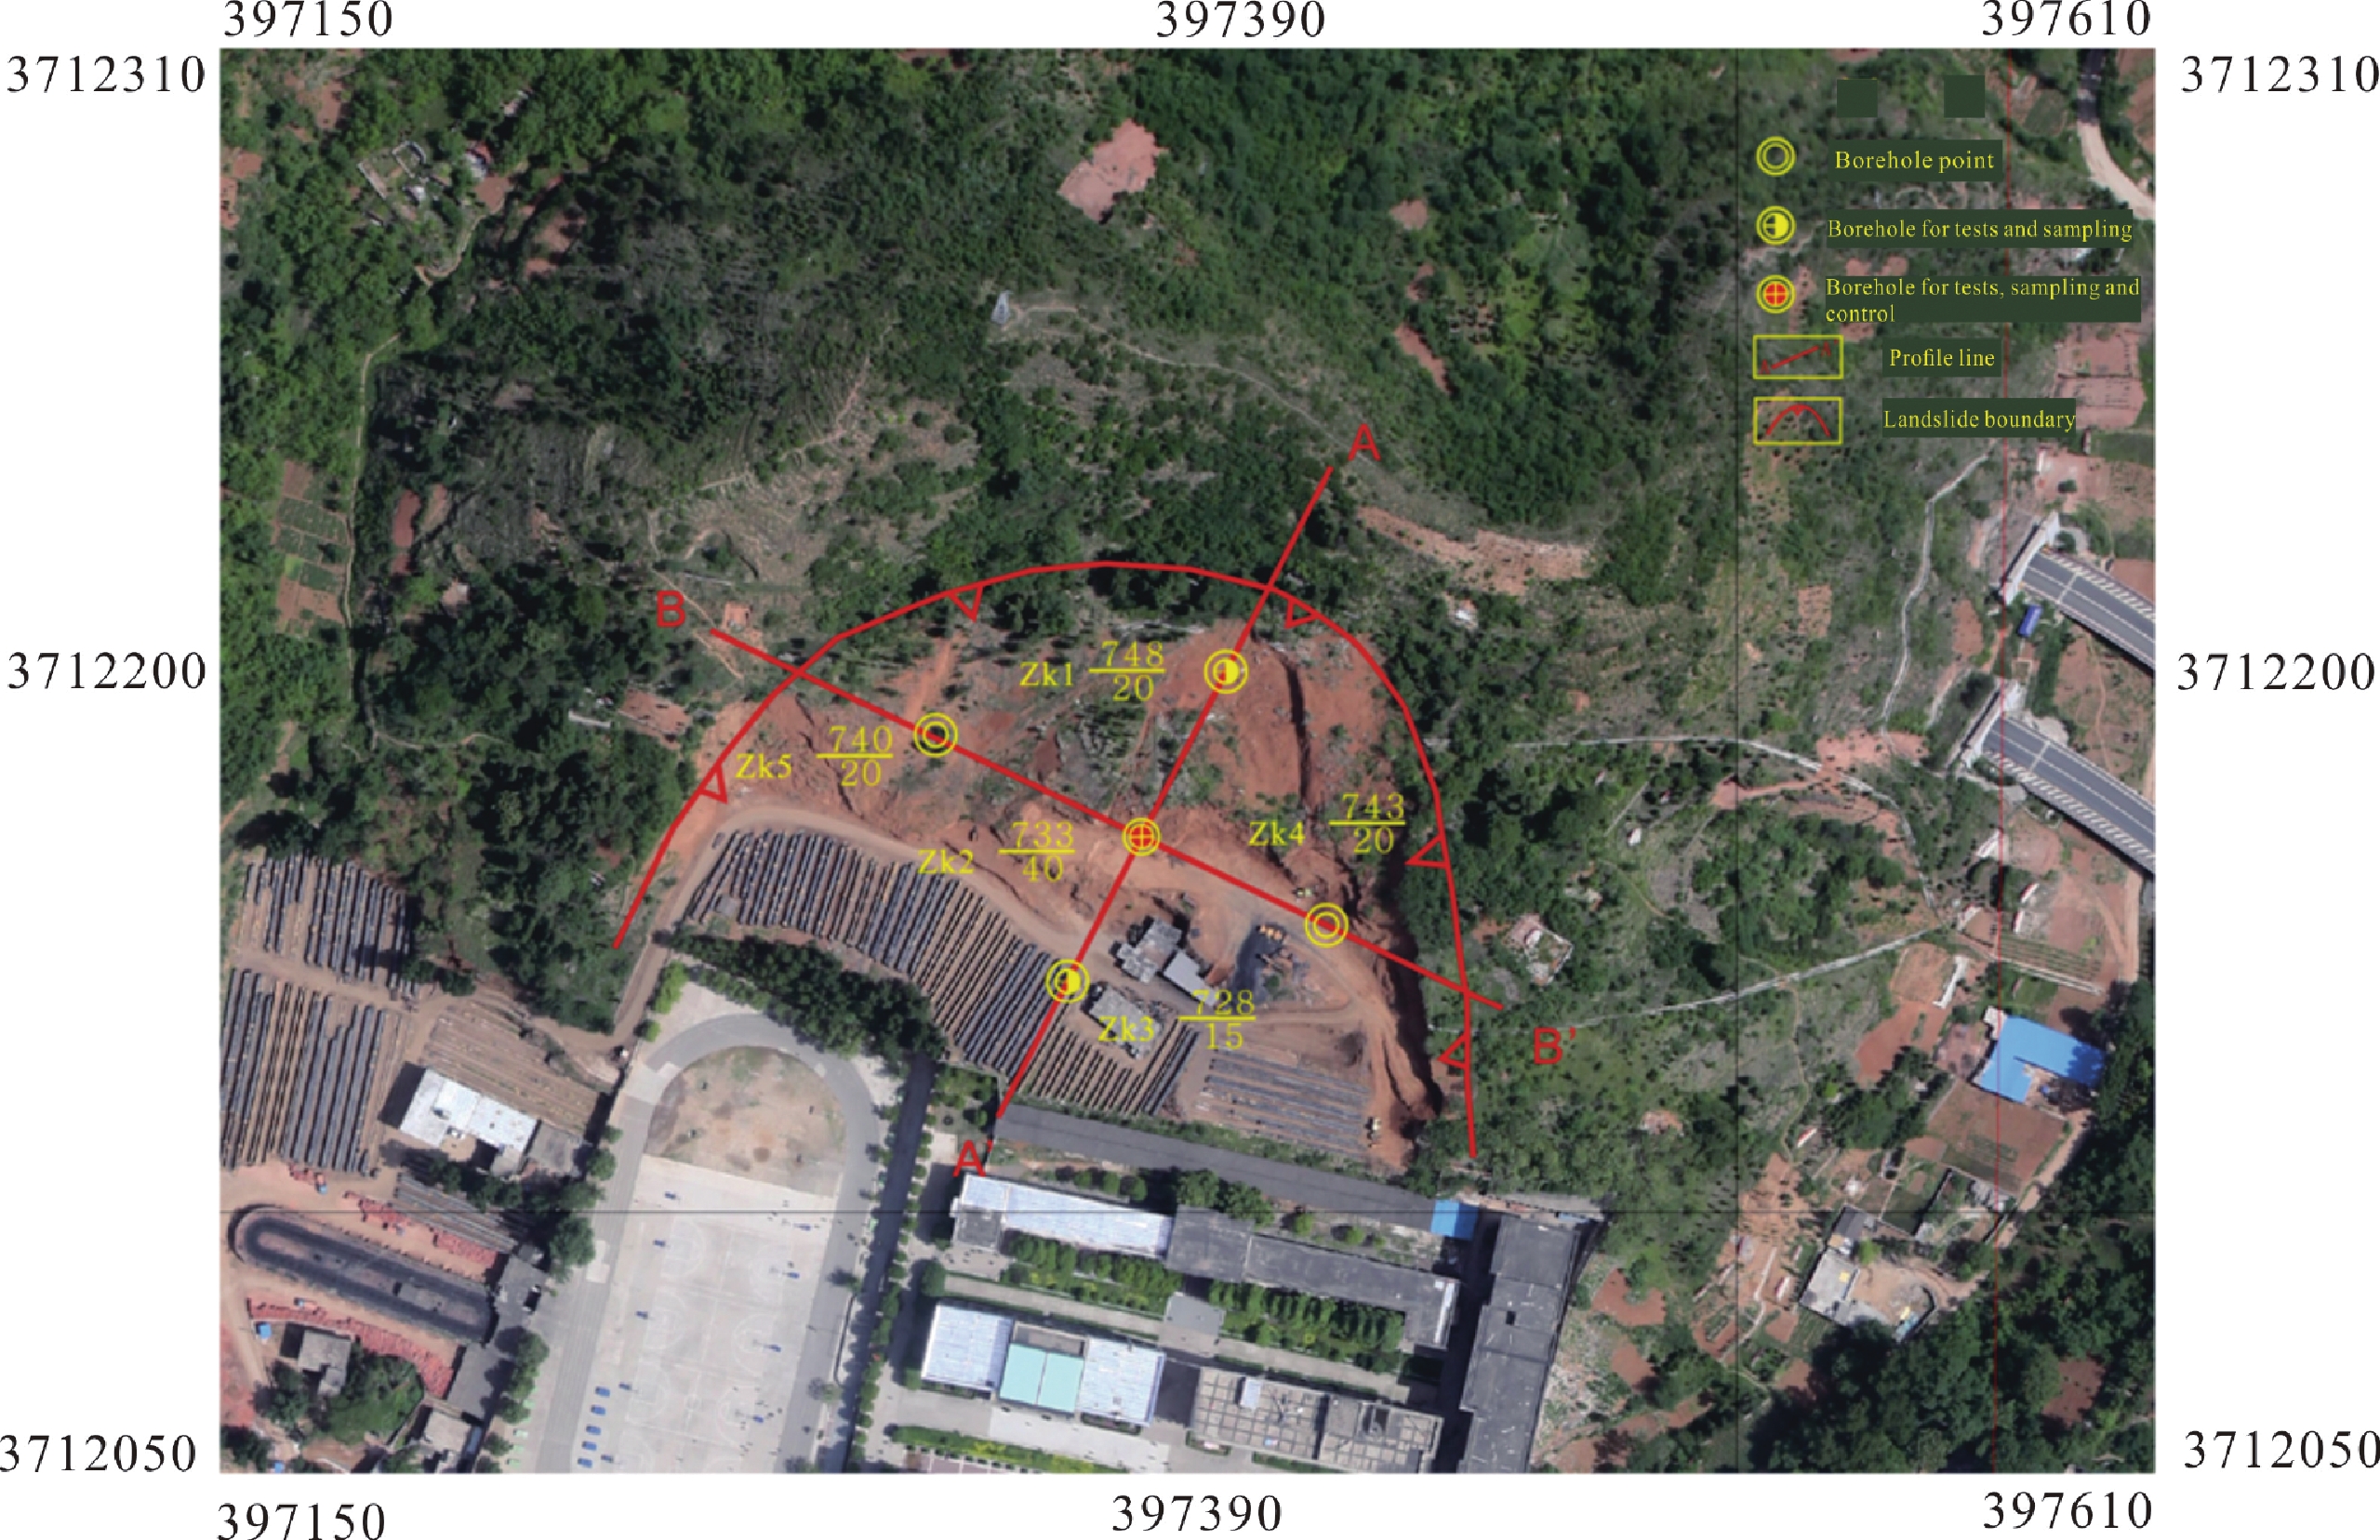
表 4 山阳县工程地质钻孔基本情况
钻孔编号 钻孔深度/m 编录岩性 测井 随钻监测 实验测试 山阳中学ZK1 20.00 黏土、粗砂、砂砾石层 有 山阳中学ZK3 20.00 黏土、粗砂、砂砾石层 有 山阳中学ZK4 20.00 粉质黏土、黏土、钙质结核 有 山阳中学ZK5 20.00 黏土、中砂、粗砂、砂砾石层 有 桥儿沟ZK2 20.00 坡积层、千枚岩 有 桥儿沟ZK3 34.00 滑坡堆积物、千枚岩 有 桥儿沟ZK4 20.00 坡积层、千枚岩 有 桥儿沟ZK5 20.00 坡积层、千枚岩 有
下载: 导出CSV
表 5 随钻监测提取钻进过程有效数据的判断条件
钻机状态 位移传感器C 转速传感器R 油压传感器P 钻进过程 加压钻进 C2-C1<a R>0 P1>P2 不加压钻进 C2-C1=0 R>0 P1=P2=0 其他过程 空钻 C2-C1>a R>0 P1>P2 下钻杆、上钻杆 C2-C1=0 R=0 P1<P2 注:P1是上油压,P2是下油压,a是根据随钻监测数据和钻孔记录确定的数值,在岩石和土中钻进的a值不同。
下载: 导出CSV
表 6 西安城市地下空间探测基本情况
序号 工作方法 测量日期 工作量 采样间隔/m 1 多参数综合测井 9月11~21日 200 m 0.05 2 微动台阵 10月11~14日 16点 100 3 高密度电法 10月19~22日 2.01 km 7 4 浅层地震 10月14~28日 1.8 km 4 5 地质雷达 10月23~26日 2.8 km 1 6 高密度电法 11月8~11日 2.04 km 5
下载: 导出CSV
表 8 测井数据文件格式
数据名称 文件格式 初始数据 txt格式 测井曲线、对比图 mpj格式(MapGIS文件) 等值线图 jpg格式 单孔测井总结 doc格式 技术说明、报告 doc格式、pdf格式
下载: 导出CSV
表 9 延安工程地质钻孔测井结果统计表
层位 岩性 视电阻率/(Ω·m) 密度/(g/cm3) 自然伽玛/API 孔隙度/% 渗透率/md−1 平均 平均 平均 平均 平均 第四系(Q) 粉质黏土 60.08 2.13 111.48 10.11 13.36 粉土 108.12 1.95 109.62 18.58 12.40 粉砂 21.60 2.10 92.40 10.01 12.02 细砂 108.04 2.03 81.30 10.96 11.24 砾石 136.23 2.48 54.30 15.22 12.25 黄土 140.16 1.98 113.04 16.99 15.16 J2y2 砂质泥岩 33.62 2.26 121.58 8.41 10.59 细粒砂岩 40.74 2.28 106.31 6.13 12.62 泥岩 21.50 2.37 167.82 7.50 13.52 中粒砂岩 33.62 2.26 121.58 8.41 10.59 粉砂岩 31.84 2.40 130.50 7.00 11.24 细砾岩 37.56 2.21 82.81 9.20 10.25 粗粒砂岩 42.39 2.07 56.56 10.26 9.56 J2y1 砂质泥岩 31.53 2.26 155.29 8.38 10.93 泥岩 21.22 2.33 160.82 9.60 10.15 粗粒砂岩 78.45 2.33 58.15 9.82 9.57 细粒砂岩 60.81 2.30 93.72 9.24 10.18 中粒砂岩 49.47 2.31 79.19 9.27 10.60 粉砂岩 46.29 2.46 103.01 13.25 11.34 细砾岩 226.96 2.41 43.20 13.10 11.24 中砾岩 53.86 2.44 85.37 7.42 11.17 J2f 泥岩 15.32 2.43 173.38 8.31 11.42 砂质泥岩 26.88 2.41 130.50 6.22 10.81 粗粒砂岩 28.08 2.49 60.62 14.62 9.61 细粒砂岩 25.36 2.49 118.32 12.62 10.53 中粒砂岩 35.36 2.37 106.68 11.15 9.84 粉砂岩 31.12 2.51 143.58 9.05 9.55 T3w 泥岩 26.29 2.46 184.23 10.82 10.08 砂质泥岩 41.05 2.45 163.14 9.73 9.78 中粒砂岩 60.75 2.50 82.99 13.04 9.50 细粒砂岩 67.70 2.49 110.10 12.83 10.65 炭质泥岩 25.53 1.93 178.53 9.26 9.53 泥质粉砂岩 42.91 2.45 164.40 8.53 9.83
下载: 导出CSV
表 11 延安黄土及红黏土物理力学指标试验结果统计表
层号 值别 含水率
/%重度
/kN·m−3干重度
/kN·m−3孔隙比 饱和度
/%液限
/%塑限
/%塑性指数
/%液性指数
/%压缩系数
/MPa−1湿陷系数 内聚力
/kPa内摩擦角
/°晚更新世黄土 统计频数 30 29 29 29 29 30 30 30 30 29 15 8 8 最大值 20.2 19 16.8 1.31 76.0 28.2 17.5 11.0 0.72 0.2 0.099 62.1 32.2 最小值 3.0 13.3 12.4 0.61 15.0 24.6 16.7 9.4 <0 0.1 0.030 22.1 15.3 平均值 12.72 15.9 14.1 0.94 38.86 27.13 17.15 9.89 0.19 0.075 33.54 24.1 标准差 4.77 1.6 1.1 0.16 17.0 0.47 0.12 0.3 0.08 13.33 5.31 变异系数 0.38 0.10 0.08 0.17 0.44 0.02 0.01 0.04 0.44 0.40 0.22 中更新世黄土 统计频数 127 127 127 127 127 126 128 128 129 126 12 60 60 最大值 22.6 21.0 18.1 0.987 98.0 29.9 17.9 12.0 0.92 0.46 0.078 75.8 45.0 最小值 4.9 16.8 13.8 0.482 38.0 24.3 16.6 7.7 0.0 0.07 0.004 10.8 13.6 平均值 18.39 19.0 16.0 0.7 71.94 29.16 17.46 11.7 0.17 0.13 0.013 45.41 29.81 标准差 3.73 0.9 0.8 0.09 12.9 1.91 0.74 0.24 0.20 0.06 19.33 7.06 变异系数 0.20 0.05 0.05 0.12 0.18 0.07 0.04 0.11 1.19 0.43 0.43 0.24 红黏土 统计频数 4 4 3 4 3 4 4 4 4 4 4 4 4 最大值 17.60 20.9 18.8 0.618 91.6 30.7 21.2 11.7 0.71 0.12 0.005 450.8 54.5 最小值 7.07 17.5 17.8 0.443 66.9 25.9 16.8 9.1 0.57 0.02 0.002 41.65 24.0 平均值 11.99 19.2 18.2 0.517 75.56 29.03 18.9 10.2 0.67 0.08 0.003 201.8 32.4
下载: 导出CSV
表 12 延安砂岩物理力学指标试验结果统计表
统计指标 统计数 最大值 最小值 平均值 标准差 变异系数 饱和容重/g·cm−3 36 2.72 2.66 2.68 0.02 0.01 比重 36 2.54 2.23 2.31 0.09 0.03 普通吸水率 36 6.92 6.26 6.53 0.22 0.03 软化系数 36 0.72 0.57 0.67 0.05 0.11 抗拉强度/MPa 36 2.4 1.5 1.97 0.28 0.14 单轴抗压强度/MPa 干燥 36 75.1 43.0 61.2 10.9 0.20 饱水 36 51.3 28.2 41.2 9.07 0.22 弹性模量/MPa 36 4583 3865 4203 233.4 0.10 泊松比 36 0.26 0.17 0.22 0.03 0.12 内聚力/MPa 36 4.6 3.9 4.23 0.24 0.10 内摩擦角/° 36 43.5 40.0 41.6 1.00 0.02
下载: 导出CSV
表 13 延安泥岩物理力学指标试验结果统计表
统计指标 统计数 最大值 最小值 平均值 标准差 变异系数 单轴抗压强度/MPa 干燥 33 1.336 0.747 0.944 0.15 0.16 饱水 33 0.774 0.311 0.502 0.16 0.31 弹性模量/MPa 33 9.8 6.86 7.26 2.08 0.25 泊松比 33 0.30 0.25 0.26 0.04 0.13 内聚力/kPa 33 71.1 16.7 53.85 3.8 0.21 内摩擦角/° 33 35 21 26 1.0 0.16
下载: 导出CSV
1 Metadata Table of Database (Dataset)
Items Description Database (dataset) name All-Element Dataset of Combined Exploration of Urban Underground Spaces with Strong Interference Database (dataset) authors Zhang Maosheng, Xi’an Center, China Geological Survey; Shaanxi Engineering Technical Research Center of Water Resources and Environment
Wang Yimin, Xi’an Center, China Geological Survey; Shaanxi Engineering Technical Research Center of Water Resources and Environment
Zhang Ge, Xi’an Center, China Geological Survey; Shaanxi Engineering Technical Research Center of Water Resources and Environment
Dong Ying, Xi’an Center, China Geological Survey; Shaanxi Engineering Technical Research Center of Water Resources and Environment
Sun Pingping, Xi’an Center, China Geological Survey; Shaanxi Engineering Technical Research Center of Water Resources and Environment
Jia Jun, Xi’an Center, China Geological Survey; Shaanxi Engineering Technical Research Center of Water Resources and EnvironmentData acquisition time 2013—2018 Geographical area Xi’an City, located at E 107°24′–109°30′ and N 33°24′–34°24′
Yan’an, located at E 109°22′–109°37′ and N 36°27′–36°40′
Shanyang County, located at E 109°50′10″–109°56′57″ and N 33°30′27″–33°33′05″Data format .jpg, .xls, .doc, .mpj, .dwg Data size 1.19 GB Data service system URL http://dcc.cgs.gov.cn Fund project China Geological Survey projects titled “Risk Assessment of Geological Disasters in Important Towns in Shaanxi” (DD20160261) and “Comprehensive Geological Survey in Guanzhong – Tianshui Economic Region” (DD20189220) and “Multi-element Urban Geological Survey in Xi’an and Comprehensive Geological Survey in Yan’an, a Former Base of the Communist Party of China” (DD20189270) Language Chinese Database (dataset) composition Data of drilling: the No., geographical location and coordinates of borehole, elevation of borehole head, drilling rig type, drilling method, drilling date, borehole depth, stratigraphic lithologic description, sub-layer No., sub-layer depth and sampling depth
Data of logging: measuring date, measuring depth, natural gamma ray, spontaneous potential, density, interval transit time, dual laterolog resistivity, polarizability, magnetic susceptibility, gamma-ray spectrometry and the temperature, diameter and deviation of well
Data of MWD: measuring date, drilling roundtrip, length of added drill rod, borehole depth, cylinder displacement, drill rod rpm, oil pressure and torsion pressure
Data of testing: testing data of soil samples consisting of sample No., sampling depth, moisture content, natural density, cohesive force, inner friction angle, coefficient of self-weight collapsibility and specific surface area; testing data of core samples including sample No., sampling depth, acoustic velocity and uniaxial compressive strength
Data of ground geophysical prospecting: measuring date, prospecting method, electrode arrangement device, number of measuring points, length of measuring line and sampling interval
下载: 导出CSV
2 Basic Information of Engineering Geological Boreholes in Xi’an
Borehole No. Borehole depth/m Lithology recorded Logging MWD Testing Bailuyuan 200.00 Loess, silty clay, sandy gravel layer Yes Airport 200.00 Loess, silty clay, fine sand, sandy gravel layer Yes F1 150.00 Fine sand, medium sand, silty clay, sandy gravel layer Yes F2 100.00 Loess-like soil, silty clay, medium sand, coarse sand F3 100.00 Loess-like soil, silty clay, fine sand, medium sand F4 100.00 Loess-like soil, silty clay, fine sand, medium sand, sandy gravel layer Yes F5 100.00 Loess-like soil, medium sand, sandy gravel layer Yes F6 100.00 Loess-like soil, silty clay, fine sand, coarse sand Yes F7 100.20 Loess-like soil, silty clay, coarse sand, gravelly sand F8 100.00 Loess-like soil, silty clay, fine sand, medium sand F9 100.00 Silty clay, fine sand, medium sand, and sandy gravel layer Yes F10 100.00 Loess-like soil, silty clay, fine sand, medium sand, gravelly sand Yes Soil sample F11 100.00 Loess-like soil, silty clay, fine sand, medium sand, gravelly sand, sandy gravel layer Yes F12 150.00 Loess-like soil, silty clay, fine sand, medium sand, coarse sand, sandy gravel layer Yes Soil sample F13 100.00 Silty clay, fine sand, medium sand, coarse sand, gravelly sand, sandy gravel layer Yes F14 100.00 Silty clay, fine sand, medium sand, coarse sand, gravelly sand Yes Yes Soil sample F15 100.00 Silty clay, fine sand, medium sand, coarse sand Yes F16 100.00 Silty clay, fine sand, medium sand, coarse sand Yes Yes Soil sample F17 100.00 Silty clay, fine sand, medium sand, coarse sand Yes Soil sample F18 100.10 Silty clay, fine sand, medium sand, coarse sand, gravelly sand, sandy gravel layer Yes F19 100.00 Medium sand, gravelly sand, sandy gravel layer Yes Yes Soil sample F20 150.00 Silty clay, fine sand, medium sand, gravelly sand, sandy gravel layer Yes Yes Soil sample F21 100.00 Silty clay, fine sand, medium sand, coarse sand, gravelly sand, sandy gravel layer Yes Soil sample F22 100.00 Loess-like soil, silty clay, fine sand, medium sand, coarse sand, gravelly sand Yes Soil sample F23 150.00 Silty clay, fine sand, medium sand, coarse sand, gravelly sand, sandy gravel layer Yes Soil sample F24 100.00 Loess-like soil, silty clay, fine sand, medium sand Yes F25 100.00 Silty clay, fine sand, medium sand, coarse sand, gravelly sand Yes Soil sample F26 100.00 Silty clay, fine sand, medium sand, sandy gravel layer Yes Soil sample F27 100.00 Silty clay, medium sand, coarse sand Yes Yes Soil sample F28 150.00 Silty clay, fine sand, coarse sand Yes Soil sample F29 100.00 Silty clay, fine sand, coarse sand Yes Soil sample F30 100.00 Silty clay, fine sand, coarse sand Yes F31 100.00 Silty clay, fine sand, medium sand, coarse sand, gravelly sand Yes Soil sample F32 100.00 Silty clay, fine sand, medium sand, coarse sand, gravelly sand, sandy gravel layer Yes Soil sample F33 100.00 Silty clay, fine sand, medium sand, gravelly sand, sandy gravel layer Soil sample F34 100.00 Silty clay, fine sand, medium sand, gravelly sand Yes Soil sample F35 150.00 Loess-like soil, silty clay, fine sand, medium sand, coarse sand, gravelly sand Yes Soil sample F36 100.00 Silty clay, fine sand, medium sand, coarse sand, sandy gravel layer Yes Soil sample F37 100.00 Silty clay, fine sand, medium sand, coarse sand Yes Soil sample F38 100.00 Loess-like soil, silty clay, fine sand, medium sand, coarse sand Yes F39 100.00 Silty clay, fine sand, medium sand, coarse sand, sandy gravel layer Yes Soil sample F40 100.20 Silty clay, fine sand, medium sand, gravelly sand Yes F41 150.00 Silty clay, fine sand, medium sand, coarse sand Yes Yes Soil sample F42 100.00 Fine sand, medium sand, coarse sand Yes Soil sample F43 100.00 Silty clay, fine sand, medium sand, coarse sand Yes Yes F44 100.00 Silty clay, fine sand, medium sand, coarse sand, gravelly sand, sandy gravel layer Yes Soil sample F45 150.00 Silty clay, fine sand, medium sand, coarse sand Yes Yes Soil sample F46 100.00 Silty clay, fine sand, medium sand, coarse sand, gravelly sand, sandy gravel layer Yes Soil sample F47 150.00 Loess-like soil, silty clay, fine sand, medium sand, gravelly sand, sandy gravel layer Yes Yes Soil sample F48 100.00 Loess-like soil, silty clay, fine sand, medium sand, coarse sand, gravelly sand, sandy gravel layer Yes F49 100.00 Silty clay, fine sand, medium sand, coarse sand, gravelly sand Yes Soil sample F50 100.00 Silty clay, fine sand, medium sand, coarse sand, gravelly sand, sandy gravel layer Yes Soil sample F51 100.00 Silty clay, fine sand, medium sand, sandy gravel layer Yes Soil sample F52 100.00 Fine sand, medium sand, gravelly sand Yes Soil sample F53 100.00 Silty clay, fine sand, medium sand, gravelly sand Yes Soil sample F54 100.00 Silty clay, fine sand, medium sand, coarse sand, gravelly sand Yes Soil sample F55 100.00 Silty clay, fine sand, medium sand, coarse sand, gravelly sand Yes Soil sample F56 100.00 Silty clay, fine sand, medium sand, gravelly sand Yes F57 100.00 Silty clay, fine sand, medium sand, coarse sand Yes Yes Soil sample F58 150.00 Silty clay, fine sand, medium sand, coarse sand, sandy gravel layer Yes Yes Soil sample F59 100.00 Silty clay, fine sand, medium sand, gravelly sand Yes Soil sample F60 100.50 Loess-like soil, silty clay, fine sand, medium sand Yes F61 100.00 Silty clay, fine sand, medium sand, gravelly sand Yes Soil sample F62 100.40 Loess-like soil, silty clay, medium sand Yes F63 100.00 Silty clay, medium sand, gravelly sand Yes F64 100.00 Silty clay, fine sand, medium sand, sandy gravel layer Yes Yes Soil sample F66 150.00 Loess-like soil, silty clay, fine sand, medium sand, sandy gravel layer Yes Yes F67 100.10 Silty clay, fine sand, medium sand, coarse sand, gravelly sand Yes F68 100.00 Silty clay, fine sand, medium sand, sandy gravel layer Yes Soil sample F69 100.00 Silty clay, fine sand, medium sand Yes Soil sample F70 100.00 Silty clay, fine sand, medium sand, coarse sand Yes Yes Soil sample F71 150.00 Silty clay, fine sand, coarse sand, gravelly sand Yes Yes Soil sample F72 100.00 Silty clay, fine sand, medium sand Yes Yes Soil sample F73 100.00 Silty clay, fine sand, medium sand Yes Soil sample F74 100.00 Silty clay, fine sand, medium sand, coarse sand Yes Soil sample F75 100.00 Silty clay, fine sand, medium sand Yes Soil sample F76 150.00 Silty clay, fine sand, medium sand, coarse sand, gravelly sand Yes Soil sample F77 100.20 Silty clay, fine sand, medium sand, coarse sand Yes F78 100.10 Loess-like soil, silty clay, medium sand, coarse sand, gravelly sand F79 100.10 Silty clay, fine sand, medium sand, coarse sand Yes F80 150.10 Silty clay, fine sand, medium sand, gravelly sand Yes F81 100.50 Silty clay, fine sand, medium sand, coarse sand, gravelly sand Yes F82 100.30 Silty clay, fine sand, medium sand Yes F83 100.00 Silty clay, fine sand, medium sand, gravelly sand, sandy gravel layer Yes Soil sample F84 100.50 Loess-like soil, silty clay, fine sand, medium sand Yes F85 100.10 Loess-like soil, silty clay, medium sand, gravelly sand F86 100.20 Silty clay, fine sand, medium sand Yes F87 150.00 Silty clay, fine sand, medium sand, gravelly sand, sandy gravel layer Yes Soil sample F88 100.20 Loess-like soil, silty clay, medium sand, coarse sand, gravelly sand Yes F89 100.20 Silty clay, fine sand, medium sand, coarse sand Yes F90 150.00 Silty clay, fine sand, medium sand, coarse sand Yes Yes Soil sample F91 100.00 Silty clay, fine sand, medium sand Yes Soil sample F92 100.00 Silty clay, medium sand Yes Yes Soil sample F93 150.40 Silty clay, fine sand, medium sand, coarse sand, sandy gravel layer Yes F95 100.20 Silty clay, fine sand, medium sand Yes F96 150.30 Silty clay, fine sand, medium sand, coarse sand Yes F97 100.50 Loess-like soil, silty clay, medium sand, coarse sand Yes F98 100.50 Silty clay, fine sand, medium sand, coarse sand Yes F99 100.10 Silty clay, fine sand, medium sand, coarse sand Yes F100 100.10 Silty clay, medium sand, coarse sand Yes F101 100.00 Silty clay, fine sand, medium sand Yes Soil sample F102 100.00 Silty clay, fine sand, medium sand Yes F103 100.20 Silty clay, fine sand, medium sand Yes F104 150.00 Silty clay, fine sand, medium sand Yes Yes Soil sample F105 100.40 Silty clay, fine sand, medium sand, coarse sand Yes Yes F106 100.00 Loess-like soil, silty clay, fine sand, medium sand, coarse sand Yes Soil sample
下载: 导出CSV
4 Basic information of Engineering Geological Boreholes in Shanyang
Borehole No. Borehole depth/m Lithology recorded Logging MWD Testing Shanyang Middle School ZK1 20.00 Clay, coarse sand, sandy gravel layer Yes Shanyang Middle School ZK3 20.00 Clay, coarse sand, sandy gravel layer Yes Shanyang Middle School ZK4 20.00 Silty clay, clay, calcareous nodule Yes Shanyang Middle School ZK5 20.00 Clay, medium sand, coarse sand, sandy gravel layer Yes Qiaoergou ZK2 20.00 Diluvium layer, phyllite Yes Qiaoergou ZK3 34.00 Diluvium caused by landslide, phyllite Yes Qiaoergou ZK4 20.00 Diluvium layer, phyllite Yes Qiaoergou ZK5 20.00 Diluvium layer, phyllite Yes
下载: 导出CSV
3 Basic Information of Engineering Geological Boreholes in Yan’an
Borehole No. Borehole depth/m Lithology recorded Logging MWD Testing ZK01 52.30 Silty clay, sandy gravel layer, fine sandstone, mudstone ZK02 192.86 Silty clay, sandy gravel layer, fine sandstone, mudstone, coarse sandstone Yes Yes Core sample ZK03 272.68 Silty clay, sandy gravel layer, fine sandstone, mudstone, coarse sandstone Yes Yes Core sample ZK04 293.00 Fine sandstone, mudstone, coarse sandstone Yes Yes ZK05 214.00 Fine sandstone, mudstone, coarse sandstone Yes Core sample ZK06 139.00 Sandy gravel layer, fine sandstone, mudstone Yes Yes Core sample ZK07 202.00 Fine sandstone, mudstone, coarse sandstone Yes Yes ZK08 56.80 Silty clay, sandy gravel layer, fine sandstone, mudstone ZK09 151.00 Loess, fine sandstone, mudstone, coarse sandstone Yes ZK10 119.50 Fine sandstone, mudstone, coarse sandstone ZK12 102.00 Silty clay, sandy gravel layer, fine sandstone, mudstone, coarse sandstone Yes ZK13 92.00 Silty clay, fine sand, sandy gravel layer, fine sandstone, mudstone, coarse sandstone Core sample ZK14 90.00 Loess, red clay, fine sandstone, mudstone Yes Soil sample ZK15 99.00 Fine sandstone, mudstone, coarse sandstone Yes Core sample ZK16 130.00 Fine sandstone, mudstone, coarse sandstone Core sample ZK17 174.00 Fine sandstone, mudstone, coarse sandstone Yes Core sample ZK18 92.00 Fine sandstone, mudstone, coarse sandstone ZK19 120.00 Loess, red clay, coarse sandstone Yes ZK21 118.00 Fine sandstone, mudstone, coarse sandstone Yes ZK22 98.00 Loess, fine sandstone, mudstone, coarse sandstone Yes ZK23 173.00 Red clay, fine sandstone, mudstone, coarse sandstone Yes ZK24 104.00 Loess Soil sample ZK25 89.00 Loess, red clay ZK26 64.00 Loess, red clay, fine sandstone, mudstone Soil sample ZK27 123.00 Loess Soil sample ZK28 108.00 Loess, red clay, fine sandstone, mudstone Soil sample ZKP2-1 126.80 Loess, red clay, fine sandstone, mudstone ZKP2-2 75.40 Red clay, fine sandstone, mudstone ZKP2-3 50.00 Loess, fine sandstone, mudstone, coarse sandstone ZKP3-1 117.00 Loess, red clay Soil sample ZKP3-2 110.00 Loess, red clay, fine sandstone, mudstone Soil sample ZKP3-3 131.50 Loess, red clay Soil sample
下载: 导出CSV
5 Conditions Used to Determine Effective MWD Data During Extraction from Initial Drilling Data
Drilling rig state Displacement
sensor CRotational speed
sensor ROil pressure
sensor PDrilling progresses Pressurized drilling C2−C1<a R>0 P1>P2 Non-pressurized drilling C2−C1=0 R>0 P1=P2=0 Other processes Hollow drilling C2−C1>a R>0 P1>P2 Remove drilling rod, install drilling rod C2−C1=0 R=0 P1<P2 Notes: P1 and P2 refers to upper oil pressure and lower oil pressure, respectively. a refers to the value determined based on the MWD data and drilling records and it differs between drilling in rocks and drilling in soils.
下载: 导出CSV
6 Basic Information of the Urban Underground Space Exploration in Xi’an
No. Method Measuring date Workload Sampling interval/m 1 Multi-parameter comprehensive logging September 11–21 200 m 0.05 2 Microtremor array method October 11–14 16 points 100 3 High-density resistivity method October 19–22 2.01 km 7 4 Shallow seismic prospecting October 14–28 1.8 km 4 5 Geological radar method October 23–26 2.8 km 1 6 High-density resistivity method November 8–11 2.04 km 5
下载: 导出CSV
7 Engineering Geological Borehole Data and Their File Formats
Data name File format Stratigraphic Column of the Boreholes in Xi’an .dwg (CAD file) Stratigraphic Column of the Boreholes in Yan’an .mpj (MapGIS file)
下载: 导出CSV
8 Logging Data of Boreholes and Their File Formats
Data name File format Initial data .txt Logging curve, comparison diagram .mpj (Mapgis file) Isoline map .jpg Summary of logging of single boreholes .doc Technical description, report .doc, .pdf
下载: 导出CSV
9 Statistics of Logging Results from Engineering Geological Boreholes in Yan’an
Horizon Lithology Apparent resistivity/Ω.m Density/
(g/cm3)Natural gamma
ray/APIPorosity/
%Permeability/
md−1Average Average Average Average Average Quaternary (Q) Silty clay 60.08 2.13 111.48 10.11 13.36 Silty soil 108.12 1.95 109.62 18.58 12.40 Silty sand 21.60 2.10 92.40 10.01 12.02 Fine sand 108.04 2.03 81.30 10.96 11.24 Gravel 136.23 2.48 54.30 15.22 12.25 Loess 140.16 1.98 113.04 16.99 15.16 J2y2 Sandy mudstone 33.62 2.26 121.58 8.41 10.59 Fine-grained sandstone 40.74 2.28 106.31 6.13 12.62 Mudstone 21.50 2.37 167.82 7.50 13.52 Medium-grained sandstone 33.62 2.26 121.58 8.41 10.59 Siltstone 31.84 2.40 130.50 7.00 11.24 Fine conglomerate 37.56 2.21 82.81 9.20 10.25 Coarse-grained sandstone 42.39 2.07 56.56 10.26 9.56 J2y1 Sandy mudstone 31.53 2.26 155.29 8.38 10.93 Mudstone 21.22 2.33 160.82 9.60 10.15 Coarse-grained sandstone 78.45 2.33 58.15 9.82 9.57 Fine-grained sandstone 60.81 2.30 93.72 9.24 10.18 Medium-grained sandstone 49.47 2.31 79.19 9.27 10.60 Siltstone 46.29 2.46 103.01 13.25 11.34 Fine conglomerate 226.96 2.41 43.20 13.10 11.24 Medium conglomerate 53.86 2.44 85.37 7.42 11.17 J2f Mudstone 15.32 2.43 173.38 8.31 11.42 Sandy mudstone 26.88 2.41 130.50 6.22 10.81 Coarse-grained sandstone 28.08 2.49 60.62 14.62 9.61 Fine-grained sandstone 25.36 2.49 118.32 12.62 10.53 Medium-grained sandstone 35.36 2.37 106.68 11.15 9.84 Siltstone 31.12 2.51 143.58 9.05 9.55 T3w Mudstone 26.29 2.46 184.23 10.82 10.08 Sandy mudstone 41.05 2.45 163.14 9.73 9.78 Medium-grained sandstone 60.75 2.50 82.99 13.04 9.50 Fine-grained sandstone 67.70 2.49 110.10 12.83 10.65 Carbonaceous mudstone 25.53 1.93 178.53 9.26 9.53 Argillaceous siltstone 42.91 2.45 164.40 8.53 9.83
下载: 导出CSV
10 MWD Data and Their File Formats
Data name File format Initial data .txt Analytical result .xls MWD parameter curve .srf (surfer file) Technical manual, report .doc
下载: 导出CSV
11 Statistics of Test Results of the Physical and Mechanical Indices of the Loess and Red Clay in Yan’an
Layer No. Value type Moisture content/% Unit weight/kN.m−3 Dry unit weight/kN.m−3 Pore ratio Degree of saturation/% Liquid limit/% Plastic limit/% Plastic index/% Liquidity index/% Compression coefficient/
MPa−1Coefficient of collapsibility Cohesion/kPa Inner friction angle/° Late Pleistocene loess Statistic frequency 30 29 29 29 29 30 30 30 30 29 15 8 8 Max. 20.2 19 16.8 1.31 76.0 28.2 17.5 11.0 0.72 0.2 0.099 62.1 32.2 Min. 3.0 13.3 12.4 0.61 15.0 24.6 16.7 9.4 <0 0.1 0.030 22.1 15.3 Mean 12.72 15.9 14.1 0.94 38.86 27.13 17.15 9.89 0.19 0.075 33.54 24.1 Standard deviation 4.77 1.6 1.1 0.16 17.0 0.47 0.12 0.3 0.08 13.33 5.31 Coefficient of variation 0.38 0.10 0.08 0.17 0.44 0.02 0.01 0.04 0.44 0.40 0.22 Middle Pleistocene loess Statistic frequency 127 127 127 127 127 126 128 128 129 126 12 60 60 Max. 22.6 21.0 18.1 0.987 98.0 29.9 17.9 12.0 0.92 0.46 0.078 75.8 45.0 Min. 4.9 16.8 13.8 0.482 38.0 24.3 16.6 7.7 0.0 0.07 0.004 10.8 13.6 Mean 18.39 19.0 16.0 0.7 71.94 29.16 17.46 11.7 0.17 0.13 0.013 45.41 29.81 Standard deviation 3.73 0.9 0.8 0.09 12.9 1.91 0.74 0.24 0.20 0.06 19.33 7.06 Coefficient of variation 0.20 0.05 0.05 0.12 0.18 0.07 0.04 0.11 1.19 0.43 0.43 0.24 Red clay Statistic frequency 4 4 3 4 3 4 4 4 4 4 4 4 4 Max. 17.60 20.9 18.8 0.618 91.6 30.7 21.2 11.7 0.71 0.12 0.005 450.8 54.5 Min. 7.07 17.5 17.8 0.443 66.9 25.9 16.8 9.1 0.57 0.02 0.002 41.65 24.0 Mean 11.99 19.2 18.2 0.517 75.56 29.03 18.9 10.2 0.67 0.08 0.003 201.8 32.4
下载: 导出CSV
13 Statistics of Test Results of Physical and Mechanical Indices of Mudstone in Yan’an
Statistic index Statistic number Max. Min. Mean Standard deviation Coefficient of variation Uniaxial compressive strength/MPa Dry 33 1.336 0.747 0.944 0.15 0.16 Water saturated 33 0.774 0.311 0.502 0.16 0.31 Elastic modulus/MPa 33 9.8 6.86 7.26 2.08 0.25 Poisson’s ratio 33 0.30 0.25 0.26 0.04 0.13 Cohesion/kPa 33 71.1 16.7 53.85 3.8 0.21 Inner friction angle/° 33 35 21 26 1.0 0.16
下载: 导出CSV
12 Statistics of Test Results of Physical and Mechanical Indices of Sandstone in Yan’an
Statistic index Statistic number Max. Min. Mean Standard deviation Coefficient of variation Saturated unit weight/g.cm−3 36 2.72 2.66 2.68 0.02 0.01 Specific gravity 36 2.54 2.23 2.31 0.09 0.03 Normal water absorption 36 6.92 6.26 6.53 0.22 0.03 Softening coefficient 36 0.72 0.57 0.67 0.05 0.11 Tensile strength/MPa 36 2.4 1.5 1.97 0.28 0.14 Uniaxial compressive strength/MPa Dry 36 75.1 43.0 61.2 10.9 0.20 Water saturated 36 51.3 28.2 41.2 9.07 0.22 Elastic modulus/MPa 36 4583 3865 4203 233.4 0.10 Poisson’s ratio 36 0.26 0.17 0.22 0.03 0.12 Cohesion/MPa 36 4.6 3.9 4.23 0.24 0.10 Inner friction angle/° 36 43.5 40.0 41.6 1.00 0.02
下载: 导出CSV
-
[1] Bobylev N. 2009. Mainstreaming sustainable development into a city’s master plan: a case of urban underground space use[J]. Land Use Policy, 26(4): 1128−1137. doi: 10.1016/j.landusepol.2009.02.003
[2] Broere W. 2016. Urban underground space: Solving the problems of today’s cities[J]. Tunnelling and Underground Space Technology, 55: 245−248. doi: 10.1016/j.tust.2015.11.012
[3] Yue ZQ, Lee CF, Law KT, et al. 2004. Automatic monitoring of rotary-percussive drilling for ground characterization –illustrated by a case example in Hong Kong[J]. International Journal of Rock Mechanics & Mining Science, 41: 573−612.
[4] 陈伟. 2006. 城市地下空间开挖对环境的影响与试验研究[D]. 中南大学. [5] 何静, 何晗晗, 郑桂森, 刘予, 周圆心, 肖景泽, 王纯君. 2019. 北京五环城区浅部沉积层的三维地质结构建模[J]. 中国地质, 46(2): 244−254. http://d.old.wanfangdata.com.cn/Periodical/zgdizhi201902004 [6] 戚帮申, 丰成君, 谭成轩, 张鹏, 孟静, 张春山, 杨为民, 杨肖肖, 雷晓东. 2019. 京张地区延矾盆地北缘活动断裂带桑园镇隐伏段综合地球物理及钻孔地层剖面研究[J]. 中国地质, 46(3): 468−481. http://d.old.wanfangdata.com.cn/Periodical/zgdizhi201903005 [7] 钱七虎. 1998. 城市可持续发展与地下空间开发利用[J]. 地下空间, 18(2): 69−74. http://d.old.wanfangdata.com.cn/Periodical/jzgcjsysj2015081743 [8] 乔永康, 张明洋, 刘洋, 彭芳乐. 2017. 古都型历史文化名城地下空间总体规划策略研究[J]. 地下空间与工程学报, 13(4): 859−867. http://d.old.wanfangdata.com.cn/Periodical/dxkj201704001 [9] 田中英, 张茂省, 冯立, 孙萍萍, 于锋丹. 2019. 基于综合物探的黄土滑坡优势通道探测[J]. 西北地质, 52(2): 172−180. http://d.old.wanfangdata.com.cn/Periodical/xbdz201902020 [10] 王化齐, 董英, 张茂省. 2019. 西安市地下空间开发利用现状与对策建议[J]. 西北地质, 52(2): 46−52. http://d.old.wanfangdata.com.cn/Periodical/xbdz201902006 [11] 王亚辉, 张茂省, 师云超, 董英, 王锋, 于峰丹. 2019. 基于综合物探的城市地下空间探测与建模[J]. 西北地质, 52(2): 83−94. http://d.old.wanfangdata.com.cn/Periodical/xbdz201902011 [12] 杨文采, 田钢, 夏江海, 杨波. 2019. 华南丘陵地区城市地下空间开发利用前景[J]. 中国地质, 46(3): 447−454. http://d.old.wanfangdata.com.cn/Periodical/zgdizhi201903003 [13] 岳中琦. 2014. 钻孔过程监测(DPM)对工程岩体质量评价方法的完善与提升[J]. 岩石力学与工程学报, 33(10): 1977−1996. http://d.old.wanfangdata.com.cn/Periodical/yslxygcxb201410005 [14] 张茂省, 董英, 刘洁. 2014. 论新型城镇化中的城市地质工作[J]. 兰州大学学报(自然科学版), 50(5): 581−587. http://d.old.wanfangdata.com.cn/Periodical/lzdxxb201405001 [15] 张茂省, 董英, 张新社, 刘洁, 曾庆铭. 2013. 地面沉降预测及其风险防控对策—以大西安西咸新区为例[J]. 中国地质灾害与防治学报, 24(4): 115−118. http://www.wanfangdata.com.cn/details/detail.do?_type=perio&id=zgdzzhyfzxb201304019 [16] 张茂省, 李同录, 程秀娟, 孙萍萍, 李强, 乔志甜, 赵权利. 2019. 山区城市地下空间资源评价与开发利用模式—以延安市为例[J]. 山地学报, 37(3): 303−315. http://www.wanfangdata.com.cn/details/detail.do?_type=perio&id=sdxb201903001 [17] 张茂省, 王化齐, 王尧, 董英, 孙萍萍. 2018. 中国城市地质调查进展与展望[J]. 西北地质, 51(4): 1−8. doi: 10.3969/j.issn.1009-6248.2018.04.001 [18] 张珊珊, 张茂省, 孙萍萍, 董英, 冯立. 2019. 面向黄土地质灾害的优势流研究[J]. 兰州大学学报(自然科学版), 55(2): 274−280. http://www.wanfangdata.com.cn/details/detail.do?_type=perio&id=lzdxxb201902021 [19] 赵镨, 姜杰, 王秀荣. 2017. 城市地下空间探测关键技术及发展趋势[J]. 中国煤炭地质, 29(9): 61−66. doi: 10.3969/j.issn.1674-1803.2017.09.12 [20] 周圆心, 郑桂森, 何静, 李超, 刘予, 何晗晗, 肖景泽. 2019. 北京平原区地下空间建设地质安全监测问题探讨[J]. 中国地质, 46(3): 455−467. http://d.old.wanfangdata.com.cn/Periodical/zgdizhi201903004 [1] Bobylev N. 2009. Mainstreaming sustainable development into a city’s master plan: a case of urban underground space use[J]. Land Use Policy, 26(4): 1128−1137. doi: 10.1016/j.landusepol.2009.02.003
[2] Broere W. 2016. Urban underground space: Solving the problems of today’s cities[J]. Tunnelling and Underground Space Technology, 55: 245−248. doi: 10.1016/j.tust.2015.11.012
[3] Yue ZQ, Lee CF, Law KT, et al. 2004. Automatic monitoring of rotary-percussive drilling for ground characterization–illustrated by a case example in Hong Kong[J]. International Journal of Rock Mechanics & Mining Science, 41: 573−612.
[4] Chen Wei. 2006. Environmental impact and experimental study of urban underground space excavation [D]. Central South University (in Chinese with English abstract). [5] He Jing, He Hanhan, Zheng Guisen, Liu Yu, Zhou Yuanxin, Xiao Jingze, Wang Chunjun. 2019. 3D geological modelling of superficial deposits in Beijing City[J]. Geology in China, 46(2): 244−254. http://d.old.wanfangdata.com.cn/Periodical/zgdizhi201902004
[6] Qi Bangshen, Feng Chengjun, Tan Chengxuan, Zhang Peng, Meng Jing, Zhang Chunshan, Yang Weimin, Yang Xiaoxiao, Lei Xiaodong. 2019. Application of comprehensive geophysical-drilling exploration to detect the buried North Boundary active Fault Belt of Yanqing-Fanshan Basin in Sangyuan town, Beijing-Zhangjiakou area[J]. Geology in China, 46(3): 468−481. http://www.wanfangdata.com.cn/details/detail.do?_type=perio&id=zgdizhi201903005
[7] Qian Qihu. 1998. Urban sustainable development and exploitation of underground space[J]. Chinese Journal of Underground Space and Engineering, 18(2): 69−74 (in Chinese).
[8] Qiao Yongkang, Zhang Mingyang, Liu Yang, Peng Fangle. 2017. Strategy Research on the Master Planning for Underground Space Utilization in Historical and Cultural City of Ancient Capital Type[J]. Chinese Journal of Underground Space and Engineering, 13(4): 859−867 (in Chinese with English abstract). http://www.wanfangdata.com.cn/details/detail.do?_type=perio&id=dxkj201704001
[9] Tian Zhongying, Zhang Maosheng, Feng Li, Yu Fengdan. 2019. Preferential passage detectionof loess landslide based on integrated geophysical exploration[J]. Northwestern Geology, 52(2): 172−180 (in Chinese with English abstract).
[10] Wang Huaqi, Dong Ying, Zhang Maosheng. 2019. Present situation and countermeasures for the underground space utilization in Xi’an city[J]. Northwestern Geology, 52(2): 46−52 (in Chinese with English abstract). http://d.old.wanfangdata.com.cn/Periodical/xbdz201902006
[11] Wang Yahui, Zhang Maosheng, Shi Yunchao, Dong Ying, Wang Feng, Yu Fengdan. 2019. Precise detection and modeling of urban underground space based on integrated geophysical exploration[J]. Northwestern Geology, 52(2): 83−94 (in Chinese with English abstract). http://d.old.wanfangdata.com.cn/Periodical/xbdz201902011
[12] Yang Wencai, Tian Gang, Xia Jianghai, Yang Bo. 2019. The prospect of exploitation and utilization of urban underground space in hilly areas of South China[J]. Geology in China, 46(3): 447−454. http://d.old.wanfangdata.com.cn/Periodical/zgdizhi201903003
[13] Yue Zhongqi. 2014. Drilling process monitoring for refining and upgrading rock mass quality classification methods[J]. Chinese Journal of Rock Mechanics and Engineering, 33(10): 1977−1996 (in Chinese with English abstract). http://www.wanfangdata.com.cn/details/detail.do?_type=perio&id=yslxygcxb201410005
[14] Zhang Maosheng, Dong Ying, Liu Jie. 2014. Discussion of urban geological work in new urbanization[J]. Journal of Lanzhou University(Natural Science), 50(5): 581−587 (in Chinese with English abstract).
[15] Zhang Maosheng, Dong Ying, Zhang Xinshe, Liu Jie. 2013. Zeng Qingming. Prediction of land subsidence and its mitigation methods—a case study in the new urban district of Xi’an-Xianyang[J]. The Chinese Journal of Geological Hazard and Control, 24(4): 115−118 (in Chinese with English abstract).
[16] Zhang Maosheng, Li Tonglu, Cheng Xiujuan, Sun Pingping, Li Qiang, Qiao Zhitian, Zhao Quanli. 2019. Evaluation of underground space resources in mountain cities and their development models-taking Yan’an city as an example[J]. Mountain Research, 37(3): 303−315 (in Chinese with English abstract).
[17] Zhang Maosheng, Wang Huaqi, Wang Yao, Dong Ying, Sun Pingping. 2018. Progress and prospect of urban geological survey in China[J]. Northwestern Geology, 51(4): 1−8 (in Chinese with English abstract) http://d.old.wanfangdata.com.cn/Periodical/xbdz201804001
[18] Zhang Shanshan, Zhang Maosheng, Sun Pingping, Dong Ying, Feng Li. 2019. Advances in and outlooks of preferential flow study in unsaturated soils[J]. Journal of Lanzhou University (Natural Science), 55(2): 274−280 (in Chinese with English abstract). http://www.wanfangdata.com.cn/details/detail.do?_type=perio&id=lzdxxb201902021
[19] Zhao Pu, Jiang Jie, Wang Xiurong. 2017. Urban Underground Space Exploration Key Technologies and Development Trend[J]. Coal Geology of China, 29(9): 61−66 (in Chinese with English abstract). http://d.old.wanfangdata.com.cn/Periodical/zgmtdz201709012
[20] Zhou Yuanxin, Zheng Guisen, He Jing, Li Chao, Liu Yu, He Hanhan, Xiao Jingze. 2019. Research on geological safety monitoring of urban underground space resource utilization in Beijing[J]. Geology in China, 46(3): 455−467 (in Chinese). http://d.old.wanfangdata.com.cn/Periodical/zgdizhi201903004
-
期刊类型引用(6)
1. 韩双宝,周殷竹,郑焰,周金龙,李长青,韩强强,李甫成. 银川平原地下水化学成因机制与组分来源解析. 环境科学. 2024(08): 4577-4588 .  百度学术
百度学术
2. 张卓,郭华明,韩双宝,牛笑童. 沉积物中砷的赋存特征及对地下水砷富集的控制:以内蒙古河套盆地为例. 中国地质. 2024(04): 1331-1341 . 本站查看
3. 吴光伟,李浩林,王庆兵,顾莎,郭梓烽,刘中业. 鲁西北平原地下水高氟与高碘成因分析. 岩矿测试. 2023(04): 793-808 . 百度学术
4. 张卓,柳富田,陈社明. 氢氧、锶钙和锂硼同位素在高氟地下水研究中的应用. 华北地质. 2023(03): 49-56 . 百度学术
5. 李红超,单强,马丙太,赵德刚. 基于逻辑回归分析的焦化行业地下水有机污染物分布特征及影响因素研究. 华北地质. 2023(04): 47-54 . 百度学术
6. 邢世平,郭华明,吴萍,胡学达,赵振,袁有靖. 化隆—循化盆地不同类型含水层组高氟地下水的分布及形成过程. 地学前缘. 2022(03): 115-128 . 百度学术
其他类型引用(2)


计量
- 文章访问数: 2855
- HTML全文浏览量: 518
- PDF下载量: 4118
- 被引次数: 8
