
Extraction of mineral alteration information and mineralization prospecting analysis based on GF−5 hyperspectral in Zhule−Mangla, Tibet
-
摘要:研究目的
近年来,遥感在地质调查和矿产勘查领域取得了广泛的应用,基于多光谱遥感数据的蚀变矿物填图为地质找矿工作提供了重要技术支撑,然而基于国产高光谱遥感数据在此领域的研究却为数不多。高分五号(GF−5)较小的波谱间隔提供了相比于多光谱更为丰富的目标地物波谱信息,为矿物的精细识别提供了良好的数据源。本文主要基于GF−5开展西藏革吉南地区的矿物蚀变信息提取,同时结合Landsat−8、ASTER多光谱数据提取结果叠加对比,综合野外调查验证,进一步深化遥感在地质矿产资源调查领域的应用。
研究方法基于多光谱数据建立了不同类别蚀变矿物的光谱指数模型,在GF−5数据蚀变信息提取方面,摒弃了传统的光谱角匹配等方法,提出了基于决策树分类辅助混合调谐匹配滤波技术进行矿化蚀变信息的提取方法,最后综合区域构造、蚀变信息提取结果等要素,圈定成矿有利区,并开展野外调查验证。
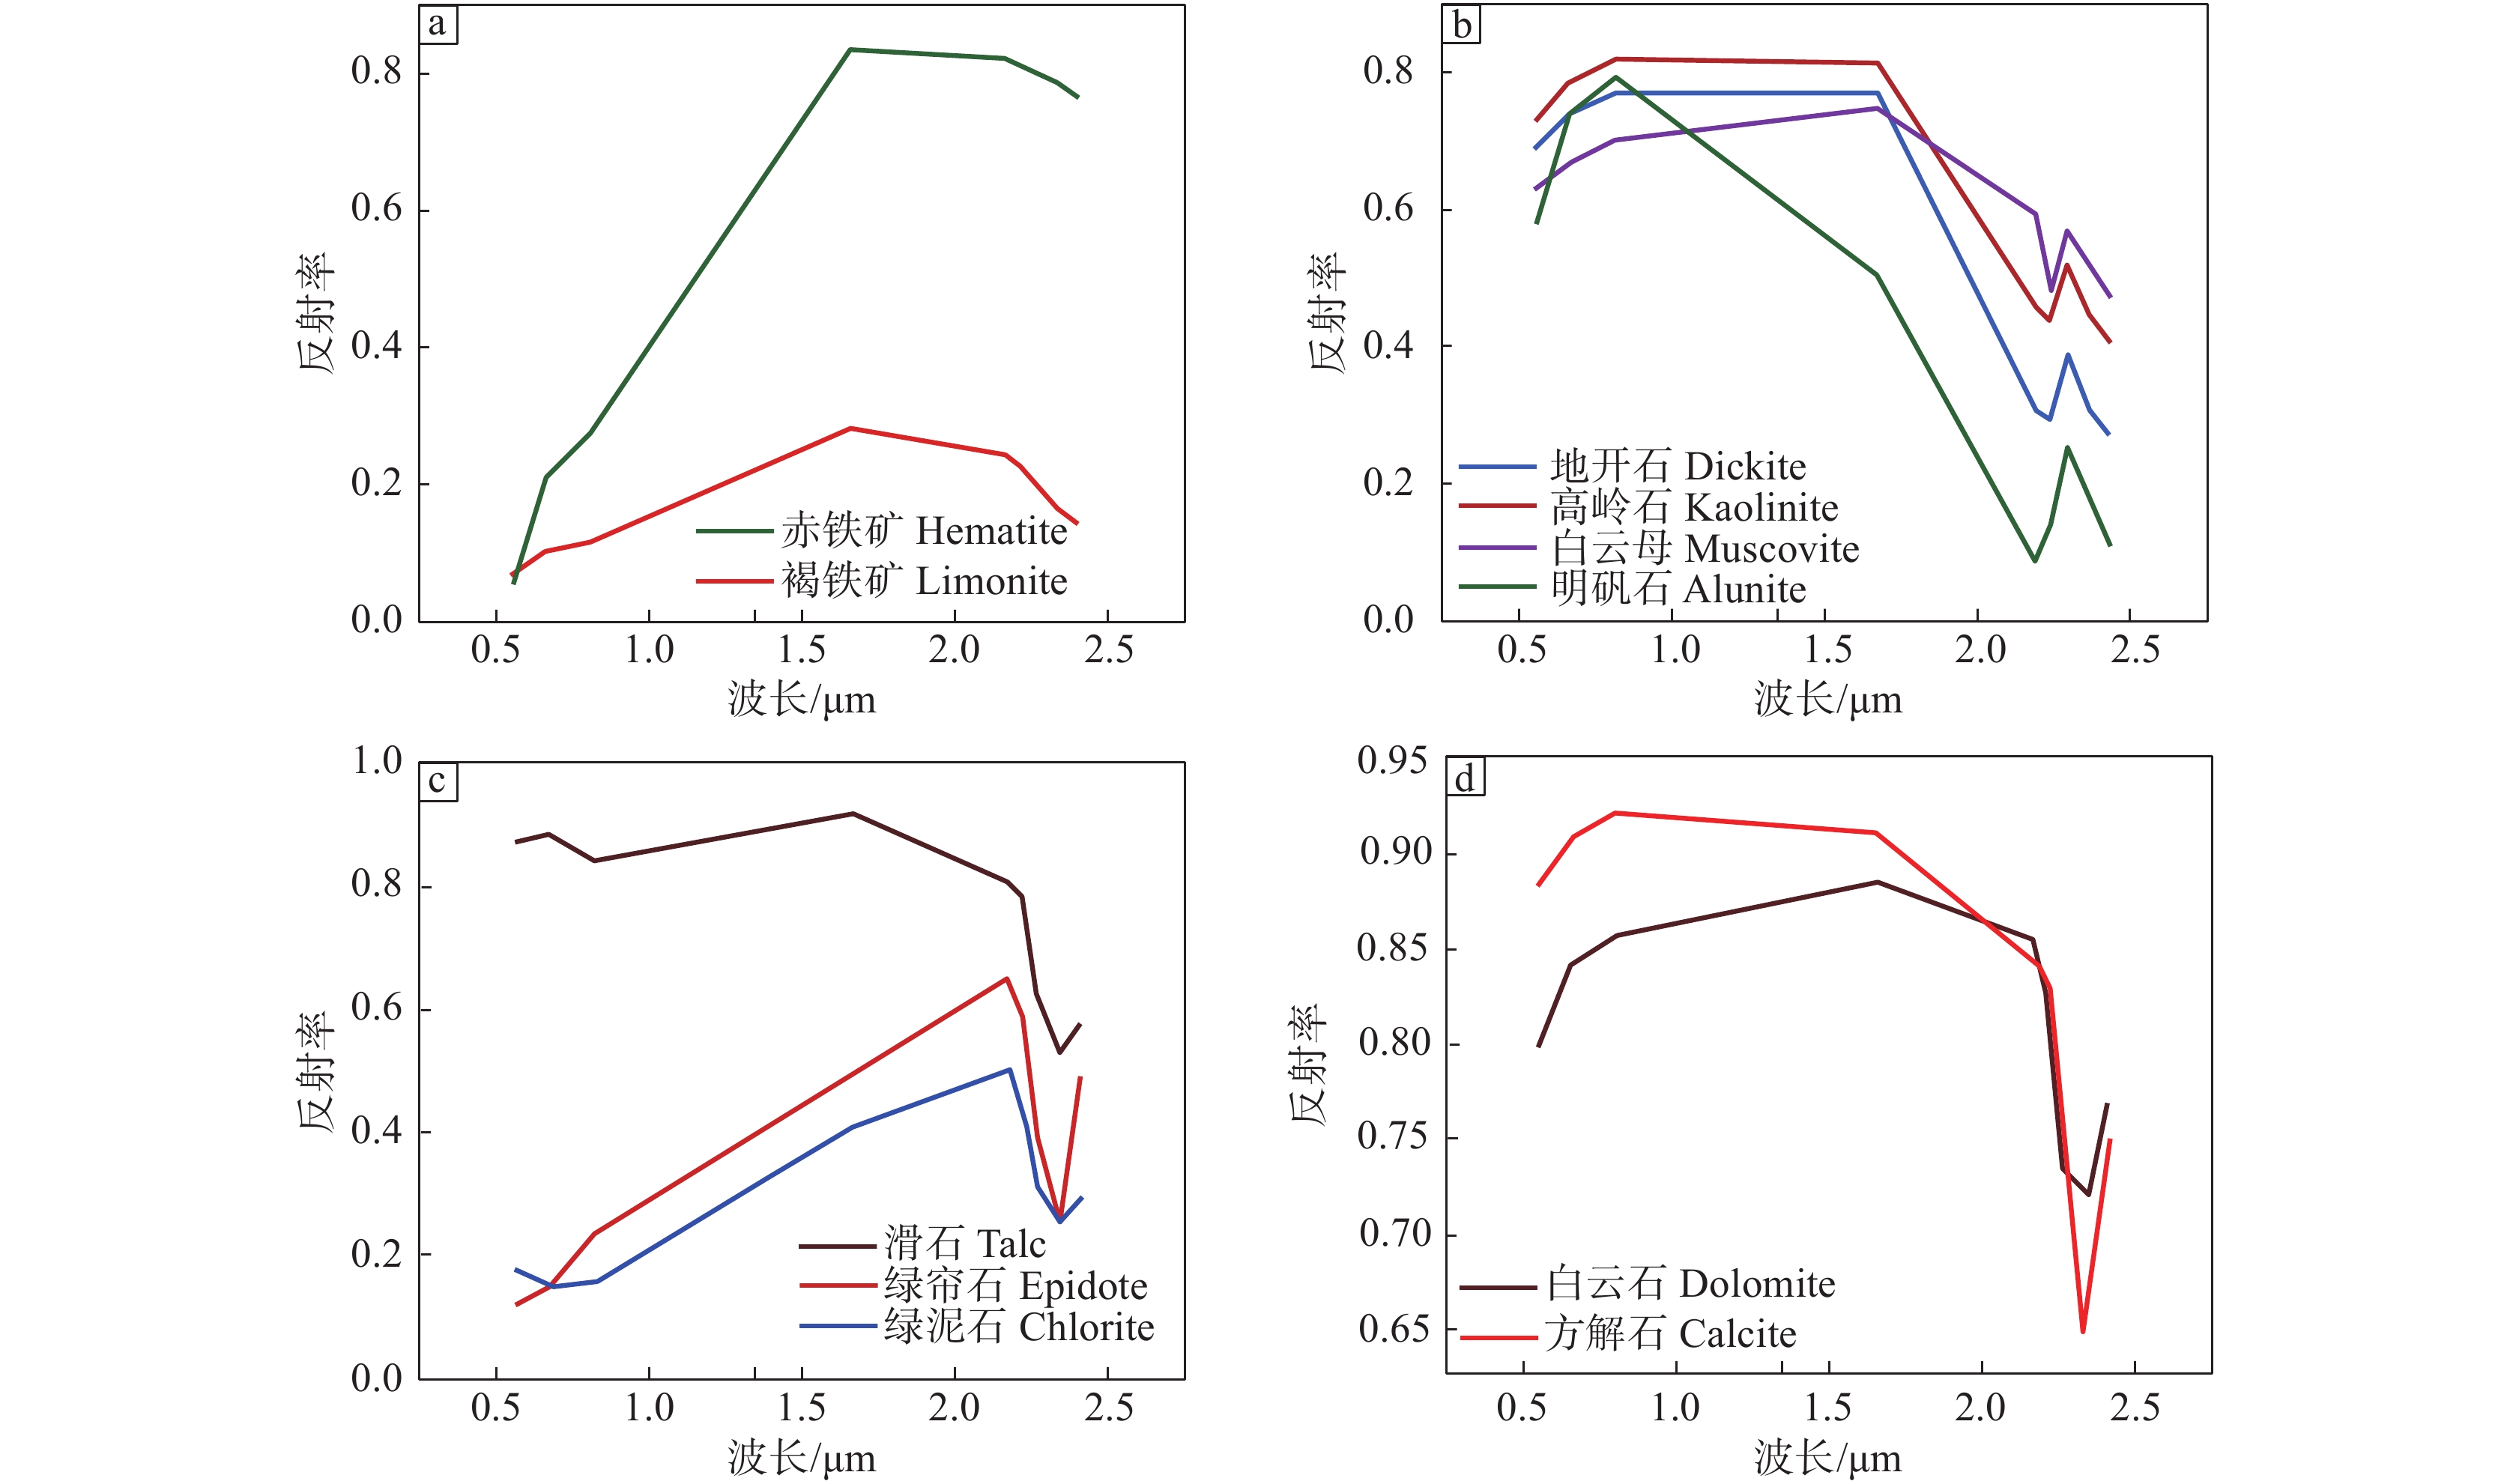
研究结果基于Landsat−8、ASTER两种多光谱数据对铁染、羟基类(Mg−OH、Al−OH)、碳酸盐类矿物信息进行了增强与提取;基于GF−5数据识别出了方解石、钠云母、普通白云母、多硅白云母、明矾石、高岭石、地开石、绿帘石8种蚀变矿物。
结论结合不同数据源的提取与叠加结果,证实了本文提出的矿化蚀变信息提取方法的可行性。根据野外验证情况综合揭示了该地区发育高硫型浅成低温热液蚀变矿物组合,具有斑岩−浅成低温热液矿床的成矿潜力。本文认为高光谱与多光谱数据相结合有助于后续蚀变分带的分析与更精确的成矿预测,从而更好地服务于矿产勘查工程等领域。
创新点:(1)构建了多光谱数据蚀变信息增强指数;(2)基于空间域统计代替频率域滤波去除高光谱条带,并基于决策树分类辅助混合调谐匹配滤波技术进行矿化蚀变信息提取。
Abstract:This paper is the result of mineral exploration engineering.
ObjectiveRemote sensing has been widely used in geological survey and mineral exploration in recent years. Alteration mineral mapping using multispectral remote sensing data provides important technical support for geological prospecting. However, only a limited number of surveys were carried out based on the Chinese hyperspectral remote sensing data. The smaller spectral interval of the GaoFen−5 (GF−5) hyperspectral remote sensing data provides a richer spectral information of geological targets than multispectral data, which offers an ideal data source for mineral identification. This paper was mainly focusing on the extraction of alteration minerals based on GF−5 data in the south of Geji, Tibet. Moreover, the alteration minerals extracted from GF−5 were overlaid and compared with the results extracted from Landsat−8 and ASTER data. The results were verified by field survey, which could deepen the application of remote sensing in mineral resources investigation.
MethodsA spectral index model for different alteration minerals was proposed based on the multispectral data. During the extraction of alteration information from GF−5 data, traditional methods such as spectral angle mapper were abandoned, while the decision tree algorithm was adopted to support mixture tuned matched filter for the extraction of mineralized alteration information. Finally, regional structure, alteration information and other factors were integrated to delineate mineralization anomalous targets. The field investigation was carried out to verify the technical reliability.
ResultsThe information of iron−stained, hydroxyl (Mg−OH, Al−OH) and carbonate minerals was enhanced and extracted using Landsat−8 and ASTER. Eight alteration minerals including calcite, paragonite, muscovite, phengite, alunite, kaolinite, dickite and chlorite were identified by GF−5.
ConclusionsCombined with the extraction and superimposition results from different data sources, the reliability of the mineralization alteration information extraction method proposed in this paper was confirmed. The field investigation results showed that the area is characterized by high−sulfur epithermal alteration mineral assemblage, which has the potential for porphyry−epithermal hydrothermal deposit. It is suggested that the combination of hyperspectral and multispectral could help the subsequent analysis of alteration zonation and provide accurate mineralization prediction for prospecting, so as to serve the sector of mineral exploration engineering.
Highlights:The spectral index for alteration extraction using multispectral data was proposed; The hyperspectral strips were removed by spatial statistical method instead of frequency filtering, and the alteration minerals were extracted by using decision tree algorithm assisted mixed tuned matched filter.
-
1. 引言
石泉–旬阳金矿带整装勘查区7个图幅区1∶50 000水系沉积物测量始于2013年(图1),其中饶峰幅、迎丰街幅和安康幅1∶50 000水系沉积物测量由中国地质调查局发展研究中心2016—2018年组织实施;铁佛寺幅、汉阴幅、大河口幅和赵家湾幅1∶50 000水系沉积物测量由中国地质调查局西安地质调查中心2013—2015年组织实施,承担单位均为陕西地矿第一地质队有限公司。
陕西石泉–旬阳金矿带整装勘查区位于秦岭造山带中部的南秦岭构造带,在漫长地质历史演化中,该区地层经历了多期变形,构造样式以褶皱、滑脱和韧性剪切带最为典型。地层区划隶属于华南地层大区中的牛山地层小区(韩芳林等,2013)(图2)。因盖层与基底间拆离滑脱,以出露滨海环境下形成的震旦纪—早古生代黑色浅变质强变形细碎屑岩系建造最为典型(张复新等,2009;唐永忠等,2012)。区内出露地层有古元古代杨坪岩组、耀岭河岩组中基性火山岩,古生代沉积—浅变质岩,中晚志留世—早泥盆世沉积地层发育不全(刘国惠和张寿广,1993)。
石泉–旬阳金矿带整装勘查区1∶50 000水系沉积物测量从2013年7月份编写项目设计书开始,各项工作均按相关技术要求执行。项目总体按三个阶段进行,第一阶段组织地球化学勘查技术人员进行1∶50 000水系沉积物测量采样工作;第二阶段检查、核对、整理和处理数据,圈定地球化学异常;第三阶段编制地球化学系列图件,建立完善石泉–旬阳金矿带整装勘查区的区域地球化学数据库,筛选并进行异常查证工作。
陕西石泉–旬阳金矿带整装勘查区水系沉积物测量原始数据集元数据简表见表1。
表 1 数据库(集)元数据简表条目 描述 数据库(集)名称 陕西石泉–旬阳金矿带整装勘查区饶峰幅等7个图幅区1∶50 000水系沉积物测量原始数据集 数据库(集)作者 谈 乐,陕西地矿第一地质队有限公司
张永强,陕西地矿第一地质队有限公司
刘小朋,陕西地矿第一地质队有限公司
李小明,陕西地矿第一地质队有限公司
王才进,陕西地矿第一地质队有限公司数据时间范围 2013—2018年 地理区域 陕西省石泉县–旬阳县地区 数据格式 *.xlsx 数据量 2.01MB 数据服务系统网址 http://dcc.cgs.gov.cn 基金项目 中国地质调查局地质调查项目(121201004000150017-53、121201004000160901-54、121201004000172201-45、12120113048100) 语种 中文 数据库(集)组成 数据集为Excel表格,包括7个独立的工作表(sheet),分别为“饶峰幅采样点位及元素分析结果表”、“铁佛寺幅采样点位及元素分析结果表”、“汉阴幅采样点位及元素分析结果表”、“大河口幅采样点位及元素分析结果表”、“赵家湾幅采样点位及元素分析结果表”、“迎丰街幅采样点位及元素分析结果表”、 “安康幅采样点位及元素分析结果表” 2. 野外工作方法
2.1 方法选择
勘查区属湿润−半湿润中低山丘陵自然景观区(樊会民和李方周,2013),湿润、多雨、强剥蚀、深切割,以物理风化为主,沟系冲、洪积物具粗岩屑性质(刘劲松等,2016),适宜开展水系沉积物测量。根据《地球化学普查规范(1∶50 000)》(DZ/T 0011−2015),结合勘查区地球化学景观特点,确定本次地球化学普查采样介质为水系沉积物,采样密度4~8点/km2,样品粒级选择−20目~+60目。
2.2 样品采集
2.2.1 采样部位
勘查区1∶50 000水系沉积物测量采样部位均选择在河沟底部或河岸与水面接触处(张源等,2018)。在间歇性水流地区或主干河道中,主要在河床底部采样;在水流湍急的河道中选择在水流变缓处、水流停滞处、转石背后、水流由窄变宽处,以及河道转弯内侧有较多细粒物质聚集处采样。
2.2.2 采样物质
采样介质以代表原生地质找矿信息的基岩物质成分为原则,采样物质为水系沉积物中的淤泥、粉砂或细砂。
2.2.3 采样方法
勘查区水系沉积物所采集的样品为粗−细粒级混合的粒级段,有效地避开了腐植层取样,样品采集过程中,加强了对蚀变−矿化强烈或重点找矿地段的加密采样工作。采用的具体技术方法如下:
①采样前,先用采样勺拨去地表浮土或腐植层,再进行取样。
②每次装袋前,首先检查布样袋,看是否有开线或破洞。含水样品装袋时先用塑料袋分装后再装入布样带中,防止袋内水分相互淋滤造成湿样互相污染。
③为了提高样品的代表性,样品采集均在采样点位上下游20~30 m范围内3~5处多点采集,组合成一件样品。
④样品采集避开了矿山开发、村镇、水坝、淤地造田、交通要道和路口造成的污染物及岸边崩塌堆积物地段。
2.2.4 野外定点
陕西石泉–旬阳金矿带整装勘查区涉及1∶50 000图幅共7幅(表2),图幅坐标系采用1980西安坐标系,中央经线为111°,图幅涉及地理数据均在陕西地理信息测绘局购买。
表 2 陕西石泉−旬阳金矿带整装勘查区涉及的7幅1∶50 000地形图图幅名称 图幅号 饶峰幅 I49E17001 迎丰街幅 I49E18002 铁佛寺幅 I49E18003 汉阴幅 I49E19003 大河口幅 I49E19004 赵家湾幅 I49E19005 安康幅 I49E02005 用1∶50 000标准地形图作为水系沉积物测量野外工作手图,采用手持IGS-100掌上机(李超岭等,2002)结合地形图进行野外定点。定点实际距离误差均小于30 m,即在手图上均小于1 mm。
2.3 采样点密度
本次共采集水系沉积物样品13 169件。根据勘查区地形地貌特点、景观条件、地质特征,本次1∶50 000水系沉积物测量分别采用了不同的采样布局和采样密度:加密区(即指1∶200 000化探异常明显、矿化信息相对较多、基岩面积大、第四系分布面积较少的地区,除正常布点外,成矿有利地段适当加密)采样密度为5.18~5.46点/km2;一般工作区(即指第四系分布面积相对较多,基岩出露面积小或零星,1∶200 000化探异常弱的地区)采样密度为:4.1~4.3点/km2;放稀区(即山间盆地)采样密度为3.13~3.52点/km2。该采样密度组合可有效地控制工作区内绝大多数汇水面积,经济实用,可有效地达到地球化学普查的目的。
2.4 样品加工
样品加工基本流程为:自然干燥→揉碎→过筛→混匀→称量缩分→填写标签→装袋→填写送样单→装箱(陈玉明和陈秀法,2018)。
样品干燥方式采取日晒风干。干燥过程中及时揉搓样品,防止结块,并用木槌适当敲打。
② 样品干燥后过−20目~+60目尼龙筛,对筛下样品用对角线折叠法混匀,缩分后装入纸样袋中,其重量均≥310 g。
③按样品缩分法将加工好的样品缩分成两份各≥150 g,一份装牛皮纸袋送检,另一份装塑料瓶封装当副样留存。
3. 样品分析测试方法
样品分析测试工作先后由具备岩矿测试甲级资质的自然资源部西安矿产资源监督检测中心和陕西地矿局汉中地质大队有限公司实验室承担,严格执行《地球化学普查(比例尺1∶50 000)规范样品分析技术的补充规定》。
3.1 实验室样品加工与制备
实验室配备有专职样品管理人员,负责样品的验收和保管,并严格按照规范要求办理样品交接手续。
以50件样品为一个分析批次进行编码和样品加工,每一个分析批次中随机插入4个国家一级标准物质,然后进入计算机,打印出分析号与送样号的对照表,以供样品管理人员在管理样品、填写汇总表等准备工作中使用,样品随后由样品管理人员下达至碎矿间进行无污染碎样。
化探样品在加工前均在60℃以下充分烘干。在大批量样品加工前,先对岩屑样分别进行玛瑙球数量、球磨时间的最佳条件试验,使其细磨后样品粒度满足1∶50 000区域地球化学调查的要求为原则。要求细磨加工后样品粒度达到−0.074 mm(−200目)占90%以上。
样品管理人员对每批样品的加工粒度是否达到规定要求进行检查;检查合格后,按规定插入指定的监控样及国家一级标样,同时依照密码编号分出内检样,随后交由质量管理人员下达分析任务。
3.2 分析项目及分析方法
根据项目任务书、合同书及总体设计要求,2013—2015年度 1∶50 000水系沉积物测量分析项目为:Au、Ag、Cu、Pb、Zn、As、Sb、Hg、V、Mo、Ti、W共12种元素。2016—2018年度1∶50 000水系沉积物测量分析项目为Au、Ag、Cu、Pb、Zn、As、Sb、Hg、Bi、Sn、W、Mo、Cd、Co、Cr、Ni共计16种元素。
采用光栅光谱仪(OES)、原子荧光仪(AFS)、等离子质谱仪法(ICP-MS)、发射光谱法(GF-AAS)等仪器进行分析测试,所有元素报出率均为100%。勘查区18种元素分析测试方法配套方案见表3。
表 3 勘查区18种元素分析方法、检出限及报出率统计表分析方法 元素含量 1∶50 000地球化学测量规定检出限 所用方法检出限 报出率(%) GF-AAS w(Au)/10−9 0.3~1 0.23 100 F-AAS w(Cu)/10−6 2 1.00 100 w(Zn)/10−6 20 5.00 100 HG-AFS w(As)/10−6 0.5~1 0.20 100 w(Sb)/10−6 0.3 0.05 100 CV-AFS w(Hg)/10−9 10~50 2.00 100 w(Bi)/10−6 0.3 0.1 100 ICP-OES w(Ti)/10−6 100 9.3 100 w(V)/10−6 20 5 100 OES w(Ag)/10−6 0.050 0.019 100 w(Sn)/10−6 2 0.5 100 ICP-MS w(Pb)/10−6 5~10 0.91 100 w(W)/10−6 1 0.048 100 w(Mo)/10−6 1 0.056 100 w(Ni)/10−6 1 0.21 100 w(Co)/10−6 1 0.10 100 w(Cr)/10−6 10 1.00 100 w(Cd)/10−6 0.2 0.02 100 4. 数据样本描述
石泉–旬阳金矿带整装勘查区饶峰幅等7个图幅1∶50 000水系沉积物测量原始数据集为Excel表格型数据,包括7个独立的工作表(sheet),分别为“饶峰幅水系沉积物测量采样点位及元素分析结果表”、“迎丰街幅水系沉积物测量采样点位及元素分析结果表”、“铁佛寺幅水系沉积物测量采样点位及元素分析结果表”、“汉阴幅水系沉积物测量采样点位及元素分析结果表”、“大河口幅水系沉积物测量采样点位及元素分析结果表”、“赵家湾幅水系沉积物测量采样点位及元素分析结果表”、“安康幅水系沉积物测量采样点位及元素分析结果表”(宋相龙等,2017)。每个工作表(sheet)包含如下内容:样品编号、高斯坐标、图幅号、地层、分析结果(铁佛寺幅、大河口幅、汉阴幅、赵家湾幅分析元素为Au、Hg、Ag、Cu、Pb、Zn、Mo、As、Sb、Ti、V、W;迎丰街幅、饶峰幅、安康幅分析元素为Au、Ag、Cu、Pb、Zn、As、Sb、Hg、Bi、Sn、W、Mo、Cd、Co、Cr、Ni)、备注。数据结构见表4。
表 4 陕西石泉−旬阳金矿带整装勘查区水系沉积物测量数据结构表序号 数据项名称 量纲 数据类型 字段长度 实例 1 样品编号 − 字符型 20 57C2 2 图幅号 − 字符型 20 I49E018002 3 地层 − 字符型 20 O3-S1b 4 高斯横坐标 − 字符型 20 255460 5 高斯纵坐标 − 字符型 20 3672075 6 经度 − 字符型 20 108°22′45″ 7 纬度 − 字浮型 20 33°08′48″ 8 Au 10−9 浮点型 20 1.03 9 Ag 10−6 浮点型 20 42 10 Cu 10−6 浮点型 20 35.9 11 Pb 10−6 浮点型 20 35.9 12 Zn 10−6 浮点型 20 83.7 13 As 10−6 浮点型 20 3.88 14 Sb 10−6 浮点型 20 2.13 15 Hg 10−9 浮点型 20 49 16 Bi 10−6 浮点型 20 0.85 17 Sn 10−6 浮点型 20 3 18 W 10−6 浮点型 20 2.14 19 Mo 10−6 浮点型 20 0.93 20 Cd 10−6 浮点型 20 0.1 21 Co 10−6 浮点型 20 22.3 22 Cr 10−6 浮点型 20 94.6 23 Ni 10−6 浮点型 20 41.9 24 Ti 10−6 浮点型 20 − 25 V 10−6 浮点型 20 − 5. 数据质量和评估
5.1 原始数据质量
铁佛寺幅、汉阴幅、大河口幅和赵家湾幅地球化学测量样品测试过程中以50件样品为一个分析批次进行编码和样品加工,每一个分析批次中随机插入4个国家一级标准物质,分别为GBW07302a、GBW07304a、GBW07309、GBW07318,对分析过程的精密度进行监控。另外随机分段加入12件国家一级标准物(每500件样品插入一次),共插入15次,对分析过程的准确度进行监控,并对样品中部分高值和低值进行了抽查分析,抽查样品数量比例为2.6%。
饶峰幅、迎丰街幅和安康幅地球化学测量样品测试过程中以50件样品为一个分析批进行编码和样品加工,共分为243批。每一个分析批次中随机插入购买于中国地质科学院地球物理地球化学勘查研究所的4个国家一级标准物质对分析过程的准确度进行监控。其中Au、Ag、Hg、Pb、Sn、As、Sb和Bi共8种元素插入GSD-10、GSD-14、GSD-18、GSD-20控制分析过程精密度;Cr、Co、Ni、Cu、Zn、Mo、Cd和W共8种元素插入GSD-8a、GSD-9、GSD-10、GSD-14控制分析过程精密度,并对样品中部分高值和低值进行了抽查分析,抽查样品数量比例为4.1%。
本次检测工作中,分析元素内检(重复样)合格率均在95.00%以上;元素报出率均达到100%;元素异常复查合格率均为97.5%以上;所选用分析方法的检出限均满足DZ/T0130.4−2006中1∶50 000化探样品标准要求。方法的精密度:对所选一级标准物质检测的△lgC平均值在(−0.099~0.099)以内。方法准确度:对所选一级标准物质检测的△lgC平均值在(−0.099~0.099)以内。所选分析方法的检出限、精密度和准确度均满足《地球化学普查(比例尺1∶50 000)规范样品分析技术的补充规定》的质量要求。
上述质量参数数据表明,本次检测的分析质量完全符合《地球化学普查(比例尺1∶50 000)规范样品分析技术的补充规定》及DZ0130.4−2006的质量要求。
5.2 成果数据库建设质量
陕西石泉–旬阳金矿带整装勘查区饶峰幅等7个图幅区1∶50 000水系沉积物测量成果数据库建设(万常选等,2009)均按照化探数据模型采用DGSS软件平台实现(庞健峰等,2017),样品中各分析元素属性结构均参照中国地质调查局固体矿产勘查数据库内容与结构(左群超等,2018;李超岭等,2013)填写,数据结构内容完整齐全。所形成的7幅1∶50 000水系沉积物测量数据库已由中国地质调查局西安地质调查中心及中国地质调查局发展研究中心专家评审验收,评分93分,评为“优秀级”,已完成相关数据库汇交。
6. 结论
本次数据集工作区范围是由中国地质调查局西安地质调查中心与中国地质调查局发展研究中心组织实施的陕西石泉–旬阳金矿带整装勘查区内饶峰幅等7幅图3 010 km2 1∶50 000水系沉积物测量工作,是陕西石泉–旬阳金矿带整装勘查区内首次系统性的采用统一采样方法、分析测试方法、统一分析元素,也是本整装勘查区内首次规范化建立地球化学数据库,获得了珍贵的第一手地球化学测量资料。
本数据集成果指导在整装勘查区内圈定金找矿靶区10处,金成矿远景区12处❶,其中在圈定的陕西省汉阴县双河口一带金找矿靶区内新发现坝王沟金矿点,通过后期省地勘基金投入,金(333+334)资源量30吨;在圈定的陕西省安康市汉滨区将军山一带金找矿靶区内新发现早阳金矿点,通过后期省地勘基金投入,金(333+334)资源量20吨。另外运用本数据集成果新发现4处金矿点,分别为陕西省宁陕县堰沟金矿点、陕西省安康市汉滨区柳坑金矿点、陕西省石泉县石桥金矿点、陕西省石泉县栈房金矿点,均有一定的找矿潜力。另外,本数据集成果指导我省找到2~4处新的大型金矿产资源开发基地。
注释:
❶张永强, 孙健, 谈乐. 2018. 陕西石泉−旬阳金矿带整装勘查区矿产调查与找矿预测2016—2018年子项目总成果报告[R]. 安康:陕西地矿第一地质队有限公司, 1−260.
1. Introduction
The measurement of 1∶50 000 stream sediments across 7 map sheets of the integrated survey area of the Shiquan-Xunyang gold zone began in 2013 (Fig. 1), of which those in the Raofeng, Yingfengjie and Ankang map sheets were organized by the Development and Research Center of China Geological Survey in 2016—2018; those in the Tiefosi, Hanyin, Dahekou and Zhaojiawan map sheets were organized by the Xi’an Center of China Geological Survey in 2013—2015, and both were conducted by the Team No.1, Shaanxi Bureau of Geology and Mineral Resources Co. Ltd..
![]() 图 1 Range for measurement of the 1∶50 000 stream sediments of the 7 Map Sheets in the Integrated Survey Area of the Shiquan-Xunyang Gold Ore Zone, Shaanxi.
图 1 Range for measurement of the 1∶50 000 stream sediments of the 7 Map Sheets in the Integrated Survey Area of the Shiquan-Xunyang Gold Ore Zone, Shaanxi.The integrated survey area of the Shiquan-Xunyang gold ore zone, Shaanxi, located at the South Qinling tectonic zone in the midst of the Qinling orogeny, has experienced multi-stage deformations in its long history of geological evolution, where the typical tectonic patterns are folding, detachment and ductile shearing zones. In terms of stratigraphic regionalization, it belongs to the Niushan stratigraphic sub-region of the South China stratigraphic super-region (Han FL et al., 2013) (Fig. 2). Due to decoupling detachment between the overlying strata and basement, the outcrop in the area is characterized by the formation of Sinian−early-Paleozoic, black, low-metamorphic, strongly-deformed fine clastic rock series, which were formed in the coastal sea environment (Zhang FX et al., 2009; Tang YZ et al., 2012). The outcropped strata within the area include the Paleoproterozoic Yangpingyan Formation, the basic volcanic rock of the Yaolinghe Formation and Paleozoic sedimentary−low-metamorphic rocks, where mid- and late-Silurian−early-Devonian sedimentary strata are poorly developed (Liu GH and Zhang SG, 1993).
![]() 图 2 Schematic diagram of the stratigraphic regionalization of the Integrated Survey Area of the Shiquan-Xunyang Gold Ore Zone, Shaanxi
图 2 Schematic diagram of the stratigraphic regionalization of the Integrated Survey Area of the Shiquan-Xunyang Gold Ore Zone, ShaanxiThe measurement of the 1∶50 000 stream sediments in the integrated survey area of the Shiquan-Xunyang gold ore zone began with preparation of the project design in July 2013, all works being done in accordance with the relevant technical specifications. The project was completed in three stages: Stage 1, organization of the geochemical staff to take samples for the measurement of the 1∶50 000 stream sediments; Stage 2, checking, verifying, collating and processing data, and delineation of geochemical anomalies; Stage 3, plotting a series of geochemical maps, establishing and improving the regional geochemical database for the integrated survey area of the Shiquan-Xunyang gold ore zone, and screening and verifying anomalies.
Metadata for the measured original dataset of the stream sediments in the 7 map sheets of the integrated survey area of the Shiquan-Xunyang gold ore zone, Shaanxi, are shown in Table 1.
表 1 Metadata Table of Database (Dataset)Items Description Database (dataset) name The 1∶50 000 Original Measurement Dataset on Stream Sediments for 7 Map Sheets including the Raofeng Map in the Integrated Survey Area of the Shiquan-Xunyang Gold Ore Zone, Shaanxi Database (dataset) authors Tan Le, Team No.1, Shaanxi Bureau of Geology and Mineral Resources Co. Ltd.
Zhang Yongqiang, Team No.1, Shaanxi Bureau of Geology and Mineral Resources Co. Ltd.
Liu Xiaopeng, Team No.1, Shaanxi Bureau of Geology and Mineral Resources Co. Ltd.
Li Xiaoming, Team No.1, Shaanxi Bureau of Geology and Mineral Resources Co. Ltd.
Wang Caijin, Team No.1, Shaanxi Bureau of Geology and Mineral Resources Co. Ltd.Data acquision time 2013—2018 Geographic area Shiquan-Xunyang, Shaanxi Data format *.xlsx Data size 2.01MB Data service system URL http://dcc.cgs.gov.cn Fund project China Geological Survey Project (121201004000150017-53, 121201004000160901-54, 121201004000172201-45, 12120113048100). Language Chinese Database(dataset) composition The dataset consists of 7 separate Excel sheets: Raofeng Sampling Points and Element Analytical Result Sheet, Tiefosi Sampling Points and Element Analytical Result Sheet, Hanyin Sampling Points and Element Analytical Result Sheet, Dahekou Sampling Points and Element Analytical Result Sheet, Zhaojiawan Sampling Points and Element Analytical Result Sheet, Yingfengjie Sampling Points and Element Analytical Result Sheet and Ankang Sampling Points and Element Analytical Result Sheet. 2. Field Work Methods
2.1 Selection Method
The survey area is a humid−semihumid mid-and-low hilly natural landscape area (Fan HM and Li FZ, 2013), humid, rainy, strongly denuded, deeply cut, mainly physically-weathered, where channel-system alluvium and diluvium have the properties of coarse debris, suitable for the measurement of the stream sediments (Liu JS et al., 2016). In accordance with the Specifications of the Geochemical Reconnaissance Survey (1∶50 000)(DZ/T 0011−2015), considering the geochemical landscape features of the survey area, it was decided to use stream sediment as the medium to be sampled for this geochemical reconnaissance survey, at a sampling density of 4~8 points/km2, and –20 meshes ~ +60 meshes are selected for the sample’s grain size.
2.2 Sampling
2.2.1 Sample Location
In the survey area, samples for measurement of 1∶50 000 stream sediments are all taken from the river bottom or the contact between the riverbank and the water surface (Zhang Y et al., 2018). In intermittent or trunk river channels, samples are mainly taken from the bottom of the riverbed; in rivers with rapid flow, samples are taken at places where water flows slowly or stops, or behind a boulder, or where water flow widens, or at the inner side of the turn of the river channel, where much more fine-grained materials concentrate.
2.2.2 Sampling Materials
Following the principle that sampled media shall represent material components of bedrocks containing original geological prospecting information, sampling materials are sludge, silt or fine sand in stream sediments.
2.2.3 Sampling Methods
Samples taken from the stream sediments in the survey area are graded sections, mixing coarse−fine-grain sizes, care being taken to avoid sampling from the humus layer. During sampling, an emphasis was placed on taking more samples at places where alteration−mineralization is strong, or which are priorities for prospecting. Samples are taken using the specific technique below:
① Prior to sampling, the topsoil or humus layer is removed with a sampling spoon.
② The cloth bag used for housing samples is checked to ensure that it does not have split seams or broken holes before placing samples within it. Before putting moist samples in the bag, they were placed in a plastic bag and then in the cloth bag, to prevent samples from becoming wet and contaminated, due to mutual leaching.
③ To make samples more representative, samples were taken at multiple points of 3~5 places 20~30 m within upstream and downstream of the sampling points and then combined into one sample.
④ Sampling avoids locations where there are pollutants and accumulated collapses at the bank due to mine development, villages and towns, dams, field-making from silty land, traffic route or road junctions.
2.2.4 Point Fixation in the Field
The integrated survey area of the Shiquan-Xunyang gold ore zone, Shaanxi, involves seven 1∶50 000 map sheets (Table 2) in which the 1980 Xi’an coordinate system is used and the central meridian is 111°, and geological data involved in the map sheets were purchased from the Shaanxi Geographic Information Survey Bureau.
表 2 Topographic map of seven 1∶50 000 Map Sheets involved in the Integrated Survey Area of the Shiquan-Xunyang Gold Ore Zone, ShaanxiMap sheet name Map sheet number Raofeng I49E17001 Yingfengjie I49E18002 Tiefosi I49E18003 Hanyin I49E19003 Dahekou I49E19004 Zhaojiawan I49E19005 Ankang I49E02005 The 1∶50 000 standard topographic map is used as a base map for field measurement of the stream sediments to determine the sampling points in the field with a hand-held IGS-100 device (Li CL et al., 2002). Errors in point localization were less than 30 m from their actual locations, i.e. less than 1 mm on the base map.
2.3 Density of Sampling Points
During the project there were 13 169 samples in total taken from stream sediments. Based on topographic and landform characteristics, landscape conditions and geological features, for the measurement of these 1∶50 000 stream sediments, different sampling layouts and densities were used: at the densest area (i.e. referring to areas where at 1∶200 000 a geochemical anomaly is obvious, there was more information on mineralization, larger in the bedrock area and distributed with less Quaternary strata, and in addition to normal point arrangements, sampling in sections favoring metallogenesis are undertaken to the standard density), the sampling density was 5.18~5.46 points/km2; at the ordinal work area (i.e. referring to areas where there are more Quaternary strata, smaller or sporadic outcropped bedrocks, and the 1∶200 000 geochemical anomaly is weak), the sampling density was 4.1~4.3 points/km2; at the scattered area (i.e. intermountain basin), the sampling density was 3.13~3.52 points/km2. The combination of these sampling densities allows the effective control of the vast majority of water catchment within the area, which is cost-effective and enables the effective meeting of the goal of the geochemical reconnaissance survey.
2.4 Sample Processing
The basic procedure to process samples: natural drying → trituration →sieving →mixing evenly → weighing and splitting samples →fillling in the label → placing samples into bags → completing the sample delivery order → placing sampled bags into boxes (Chen YM and Chen XF, 2018).
Sample drying method: dried under sunlight and air. During drying, rub and knead samples regularly to prevent caking, and use a mallet to strike them properly,
② Dried samples were sieved with a −20~+60 mesh nylon sieve, samples under the sieve are mixed evenly through diagonal folding, split and then put into paper bags, their weight being ≥ 310 g.
③ Samples processed by sample splitting were divided into two parts, each part ≥ 150 g, one put into a kraft paper bag and sent for testing, and the other placed into plastic bottles, which were then sealed and kept as duplicate samples.
3. Sample Analysis and Testing
Samples were analyzed and tested by the Xi’an Center for Mineral Resource Supervision and Testing under the Ministry of Natural Resources and a laboratory of the Hanzhong Geological-Battalion Co., Ltd. under the Shaanxi Bureau of Geology and Mineral Resource, both of which possess Qualification A for rock and mineral testing, in strict accordance with the Additional Rules for Regulating Sample Analysis Technologies of Geochemical Reconnaissance Surveys (Scale: 1∶50 000).
3.1 Processing and Preparation of Lab Samples
Labs are provided with full-time staff to manage samples, receive, inspect and care for samples, as well as handle sample handover procedures strictly in accordance with requirements in the specifications.
The samples were coded and processed as an analytical batch of 50, each analytical batch also containing 4 randomly inserted level-1 national standard substances, the data sent to a computer to print out a comparison table showing the respective numbers of samples analyzed and those delivered, which was then used by sample management staff in tasks such as managing samples and filling in the summary tables, and samples were subsequently sent by the sample management staff to the ore-crushing room where they were crushed without contamination.
Geochemical samples must be fully dried at a temperature below 60℃ prior to processing. Before massive sample processing, debris samples should be tested for the best conditions for agate ball numbers and ball-milling time so that the particle size of the finely-ground samples meets the requirement for the 1∶50 000 regional geochemical survey, that finely-ground samples with particle size reaching –0.074 mm (–200 mesh) accounted for at least 90% of the sample.
The sample management staff checked whether each processed batch of samples met the requirement for particle size; inserted designated control samples and Level-1 national standard samples into acceptable batches as required, whilst separating inner inspection samples based on their codes and numbers, and then delivering them to quality management staff to assign analysis tasks.
3.2 Items Analyzed and Analytical Methods
According to the Project Task, Contract and General Design Specification, in 2013—2015, the items to be analyzed during the measurement of the 1∶50 000 stream sediments were the 12 elements: Au, Ag, Cu, Pb, Zn, As, Sb, Hg, V, Mo, Ti and W. In 2016—2018, the items to be analyzed for measurement of the 1∶50 000 stream sediments totalled 16 elements: Au, Ag, Cu, Pb, Zn, As, Sb, Hg, Bi, Sn, W, Mo, Cd, Co, Cr and Ni.
Instruments such as Optical Emission Spectrometer (OES), Atomic Fluorescence Spectrometer (AFS), Inductive Coupling Plasma-Mass Spectrometer (ICP-MS) and Graphite Furnace-Atomic Absorption Spectrometer (GF-AAS) were used in analysis and testing, and all elements reported percentages were 100%. Schemes for testing and analysis of the 18 elements in the survey area are shown in Table 3.
表 3 Analytical methods, detection limits and report percentages of the 18 elements in the survey areaAnalytical method Element content Specified detection limit for the 1∶50 000 geochemical measurement Detection limit of the method used Report percentage (%) GF-AAS w(Au)/10−9 0.3~1 0.23 100 F-AAS w(Cu)/10−6 2 1.00 100 w(Zn)/10−6 20 5.00 100 HG-AFS w(As)/10−6 0.5~1 0.20 100 w(Sb)/10−6 0.3 0.05 100 CV-AFS w(Hg)/10−9 10~50 2.00 100 w(Bi)/10−6 0.3 0.1 100 ICP-OES w(Ti)/10−6 100 9.3 100 w(V)/10−6 20 5 100 OES w(Ag)/10−6 0.050 0.019 100 w(Sn)/10−6 2 0.5 100 ICP-MS w(Pb)/10−6 5~10 0.91 100 w(W)/10−6 1 0.048 100 w(Mo)/10−6 1 0.056 100 w(Ni)/10−6 1 0.21 100 w(Co)/10−6 1 0.10 100 w(Cr)/10−6 10 1.00 100 w(Cd)/10−6 0.2 0.02 100 4. Description of Data Samples
The measured original dataset on the 1∶50 000 stream sediments in the 7 map sheets of the integrated survey area of the Shiquan-Xunyang gold ore zone contains data in Excel form, including 7 separate sheets: Raofeng Sampling Points and Element Analytical Result Sheet, Tiefosi Sampling Points and Element Analytical Result Sheet, Hanyin Sampling Points and Element Analytical Result Sheet, Dahekou Sampling Points and Element Analytical Result Sheet, Zhaojiawan Sampling Points and Element Analytical Result Sheet, Yingfengjie Sampling Points and Element Analytical Result Sheet, and Ankang Sampling Points and Element Analytical Result Sheet (Song XL et al., 2017). Each sheet contains the following: sample No., Gaussian coordinates, map sheet No., stratigraphy, analyzed result (elements analyzed in Tiefosi, Dahekou, Hanyin and Zhaojiawan map sheets are Au, Hg, Ag, Cu, Pb, Zn, Mo, As, Sb, Ti, V and W; elements analyzed in Yingfengjie, Raofeng and Ankang map sheets are Au, Ag, Cu, Pb, Zn, As, Sb, Hg, Bi, Sn, W, Mo, Cd, Co, Cr and Ni) and remarks. Dataset structure could be seen in Table 4.
表 4 Dataset structure of the measured original data of the stream sediments in the integrated survey area of the Shiquan-Xunyang gold ore zone, ShaanxiNo. Name of data item Dimension Data category Field length Real example 1 Sample No. Character type 20 57C2 2 Map sheet No. Character type 20 I49E018002 3 Stratigraphy Character type 20 O3−S1b 4 Gauss horizontal coordinate Character type 20 255460 5 Gauss vertical coordinate Character type 20 3672075 6 Longitude Character type 20 108°22′45″ 7 Latitude Character type 20 33°08′48″ 8 Au 10−9 Floating-point type 20 1.03 9 Ag 10−6 Floating-point type 20 42 10 Cu 10−6 Floating-point type 20 35.9 11 Pb 10−6 Floating-point type 20 35.9 12 Zn 10−6 Floating-point type 20 83.7 13 As 10−6 Floating-point type 20 3.88 14 Sb 10−6 Floating-point type 20 2.13 15 Hg 10−9 Floating-point type 20 49 16 Bi 10−6 Floating-point type 20 0.85 17 Sn 10−6 Floating-point type 20 3 18 W 10−6 Floating-point type 20 2.14 19 Mo 10−6 Floating-point type 20 0.93 20 Cd 10−6 Floating-point type 20 0.1 21 Co 10−6 Floating-point type 20 22.3 22 Cr 10−6 Floating-point type 20 94.6 23 Ni 10−6 Floating-point type 20 41.9 24 Ti 10−6 Floating-point type 20 25 V 10−6 Floating-point type 20 5. Data Quality and Assessment
5.1 Quality of the Original Data
In the process of analyzing and testing geochemical samples in the Tiefosi, Hanyin, Dahekou and Zhaojiawan map sheets, every 50 samples were grouped to be coded and processed as one analytical batch, each analytical batch being randomly inserted with 4 Level-1 national standard substances which were GBW07302a, GBW07304a, GBW07309 and GBW07318, in order to monitor and control the precision of the analytical process. In addition, 12 Level-1 national standard substances are added randomly in sections (once for every 500 samples) for 15 times in total, to monitor the accuracy of the analytical process, and some high and low values of samples were randomly inspected and analyzed, with 2.6% of samples receiving random inspection.
In the process of analyzing and testing geochemical samples in the Raofeng, Yingfengjie and Ankang map sheets, every 50 samples were grouped to be coded and processed as one analytical batch, 243 batches in total. Each analytical batch is randomly inserted with 4 Level-1 national standard substances purchased from the CAGS Geophysical & Geochemical Exploration Institute, in order to monitor and control the accuracy of the analytical process. Of these, to analyze the 8 elements Au, Ag, Hg, Pb, Sn, As, Sb and Bi, GSD-10, GSD-14, GSD-18 and GSD-20 were inserted to control the precision of the analytical process; to analyze the other 8 elements Cr, Co, Ni, Cu, Zn, Mo, Cd and W, GSD-8a, GSD-9, GSD-10 and GSD-14 were inserted to control the precision of the analytical process, and some high and low values of samples were randomly inspected and analyzed, with 1.4 % of samples receiving random inspection.
During this detection, the qualifying rate of element inner examination (duplicate sample) was more than 95.00%; all elements’ report percentages were 100%; the qualifying rate of element anomaly re-examination was at least 97.5%; the detection limits of analytical methods used all met the standard requirement on 1∶50 000 geochemical samples in DZ/T0130.4−2006. Precision of methods: the mean ΔlgC detected with Level-1 national standard substance was within –0.099~+0.099. Accuracy of methods: the mean ΔlgC detected with Level-1 national standard substance was within –0.099~+0.099. The detection limit, precision and accuracy of the analytical methods selected met the quality-related requirements in the Additional Rules for Regulating Sample Analysis Technologies of Geochemical Reconnaissance Surveys (Scale 1∶50 000).
Above-mentioned figures concerning quality-related parameters indicate that this examination fully complied with the quality-related requirements in the Additional Rules for Regulating Sample Analysis Technologies of Geochemical Reconnaissance Surveys (Scale 1∶50 000) and DZ0130.4−2006.
5.2 Quality in Establishing the Resulting Database
The measured results database of the 1∶50 000 stream sediments in the 7 map sheets including Raofeng on the integrated survey area of the Shiquan-Xunyang gold ore zone, Shaanxi (Wan CX et al., 2009), was set up in accordance with the geochemical data model by using the software platform DGSS (Pang JF et al., 2017), properties and structures of all the elements analysed were completed by referring to the content and structure of the CGS’s solid mineral survey database (Zuo QC et al., 2018; Li CL et al., 2013), to ensure that the data structure and content were complete and sound. The generated measurement databases of 1∶50 000 stream sediments in the 7 map sheets have been reviewed and accepted by the experts from the Xi'an Center of China Geological Survey and the Development and Research Center of China Geological Survey, scoring 93, awarded “Excellence”, and have thus been handed over.
6. Conclusions
The scope of the work area involved in this database was the measurement of the 1∶50 000 stream sediments in the 7 map sheets including Raofeng in the integrated survey area of the Shiquan-Xunyang gold ore zone, Shaanxi, organized and implemented by the Xi'an Center and the Development and Research Center of China Geological Survey, covering 3 010 km2. It is the first time that unified sampling, analytical and testing methods have been used to analyze elements in a systematic way in the integrated survey area of the Shiquan-Xunyang gold ore zone, Shaanxi. It is also the first time that a geochemical databases have been established in a standardized way in the integrated survey area, so as to obtain valuable first-hand geochemical measurement information.
With the results from the database, 10 Au prospecting target areas and 12 Au prospective areas were delineated in the integrated survey area❶, and at the newly-discovered Bawanggou Au deposit from the Au-delineated prospecting target area at and around Shuanghekou, Hanyin County, Shaanxi, with a subsequent provincial fund for geological exploration, it was found that the Au resource (333+334) was 30 tons; in the Au-prospecting target area at and around Jiangjunshan, Ankang city, Shaanxi, the Zaoyang Au deposit was recently found, and a subsequent provincial fund created for geological exploration, the Au (333+334) resource is 20 tons. In addition, 4 new gold ore occurrences were discovered in Shaanxi by using the results from this database, and they are located in Yangou, Ningshan County; Liukeng, Hanbin District, Ankang City; Shiqiao and Zhanfang, Shiquan County, all of which have a certain prospecting potential. Furthermore, the results from the database have guided Shaanxi to find 2–4 new large-scale Au resource development bases.
Notes:
❶ Zhang Yongqiang, Sun Jian, Tan Le. 2018. Comprehensive result report of sub-projects from 2016 to 2018 on mineral investigation and prospecting prediction in the integrated survey area of the Shiquan-Xunyang gold ore zone, Shaanxi[R]. Ankang: Team No.1, Shaanxi Bureau of Geology and Mineral Resources Co.Ltd., Ankang, Shaanxi, 1−260 (in Chinese).
1 ➊河北省区域地质矿产调查研究所. 2005. 1︰25万亚热幅、普兰县幅(国内部分)区域地质调查报告[R]. -
![]()
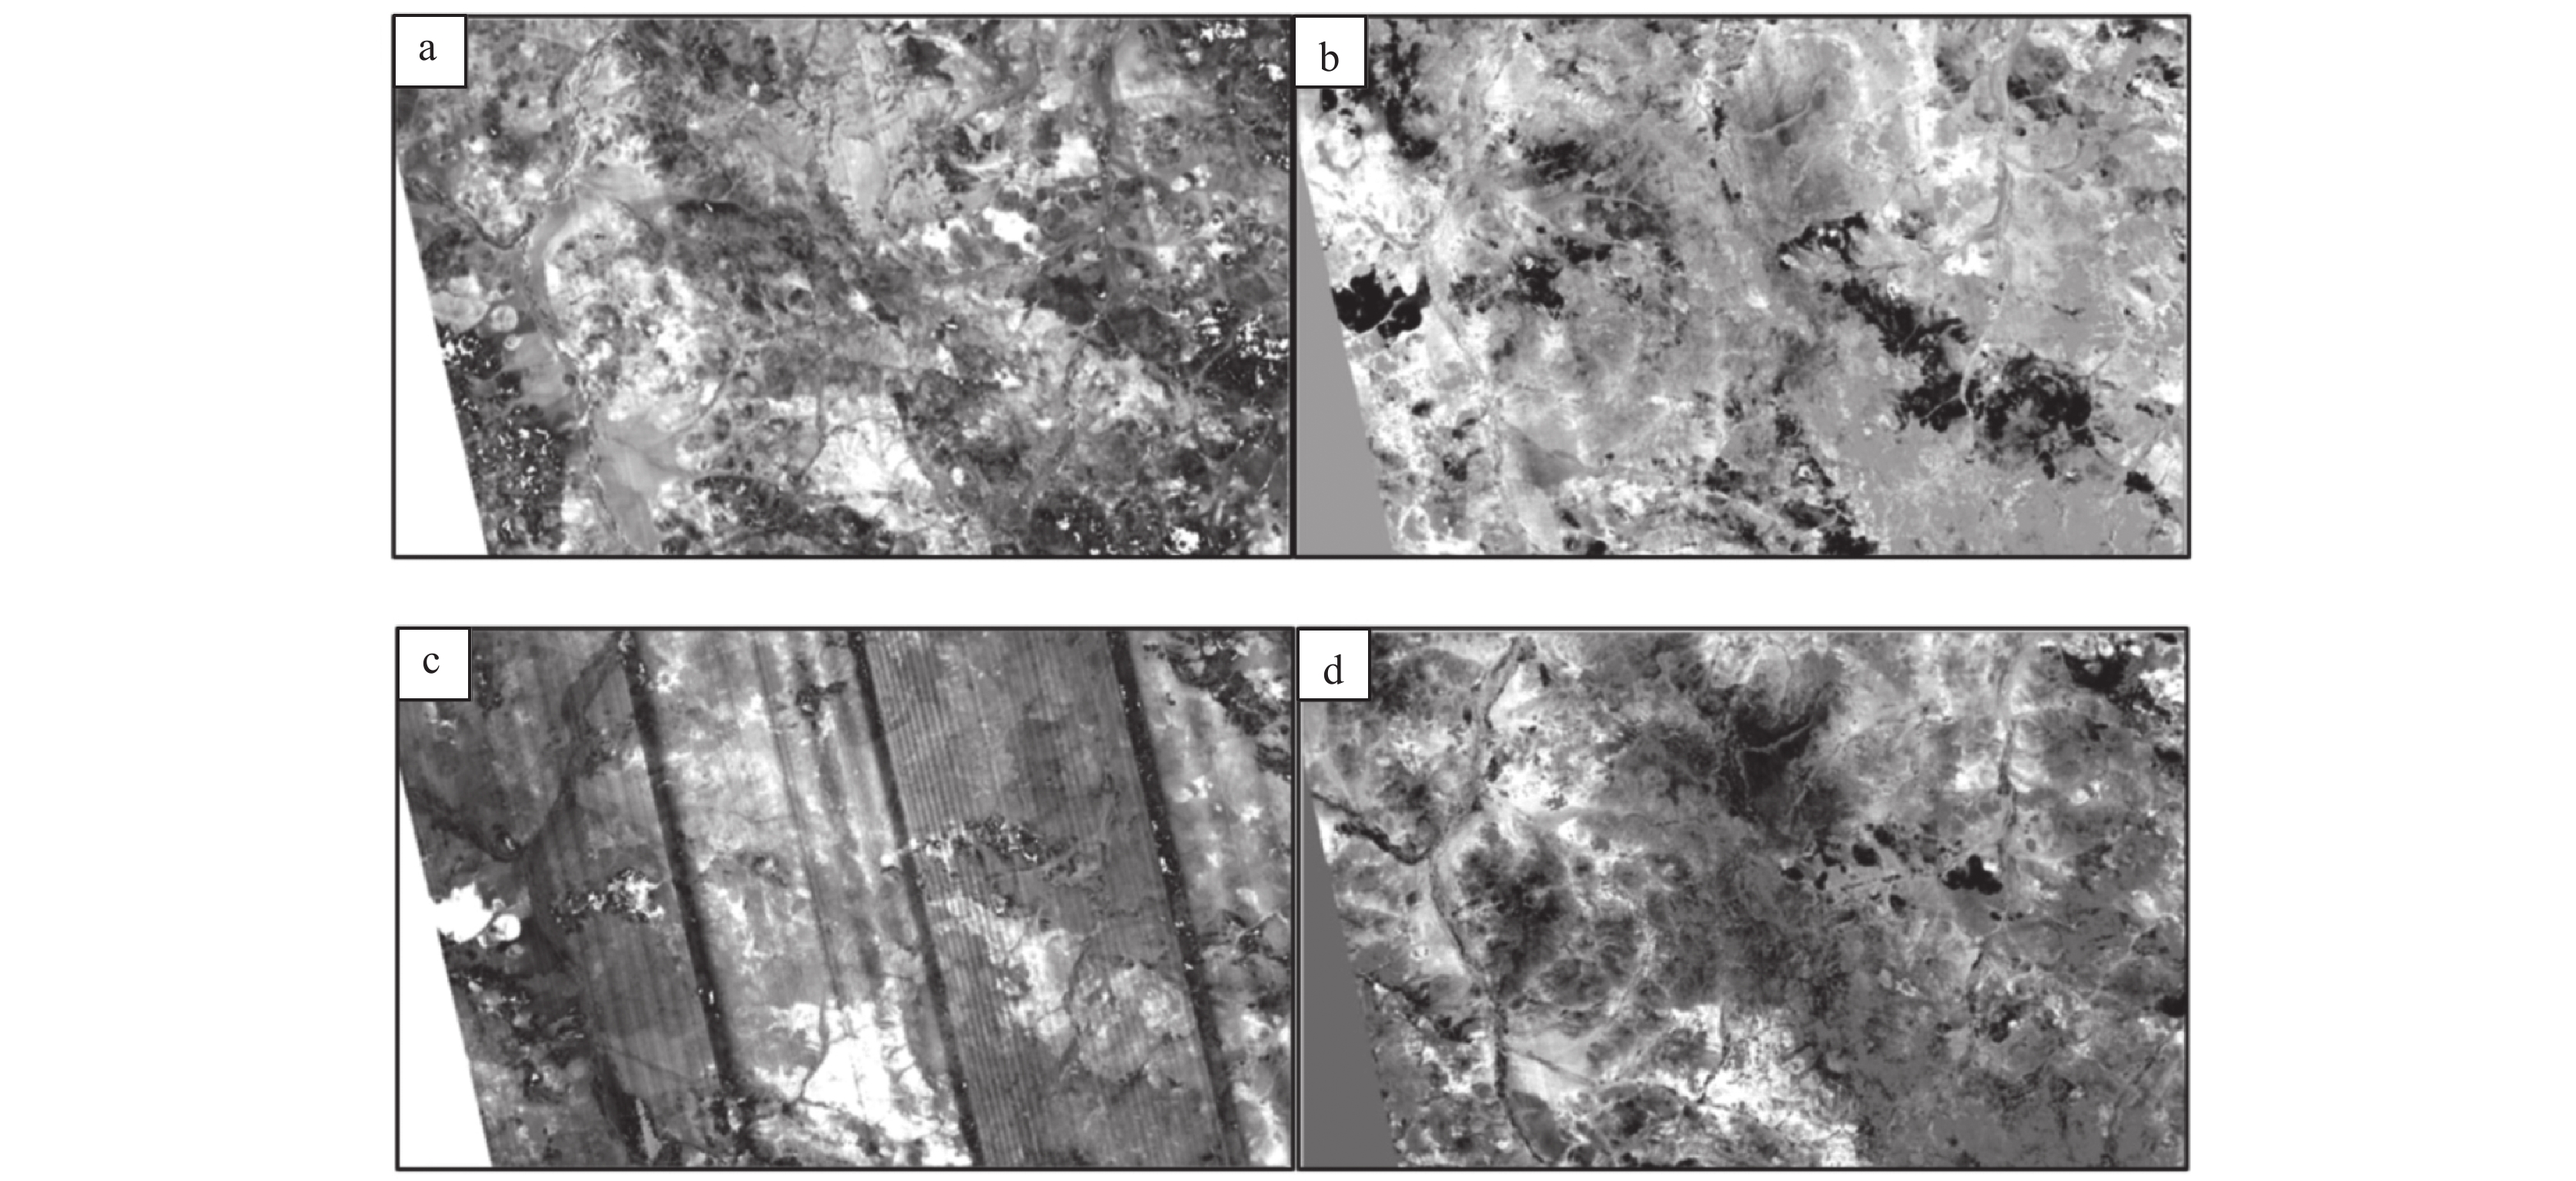
图 2 整体波段(a、b)和单波段(c、d)条带修复前后MNF对比
Figure 2. A comparison for MNF between the whole bands (a, b) and single band (c, d) before and after repairing stripe
![]()
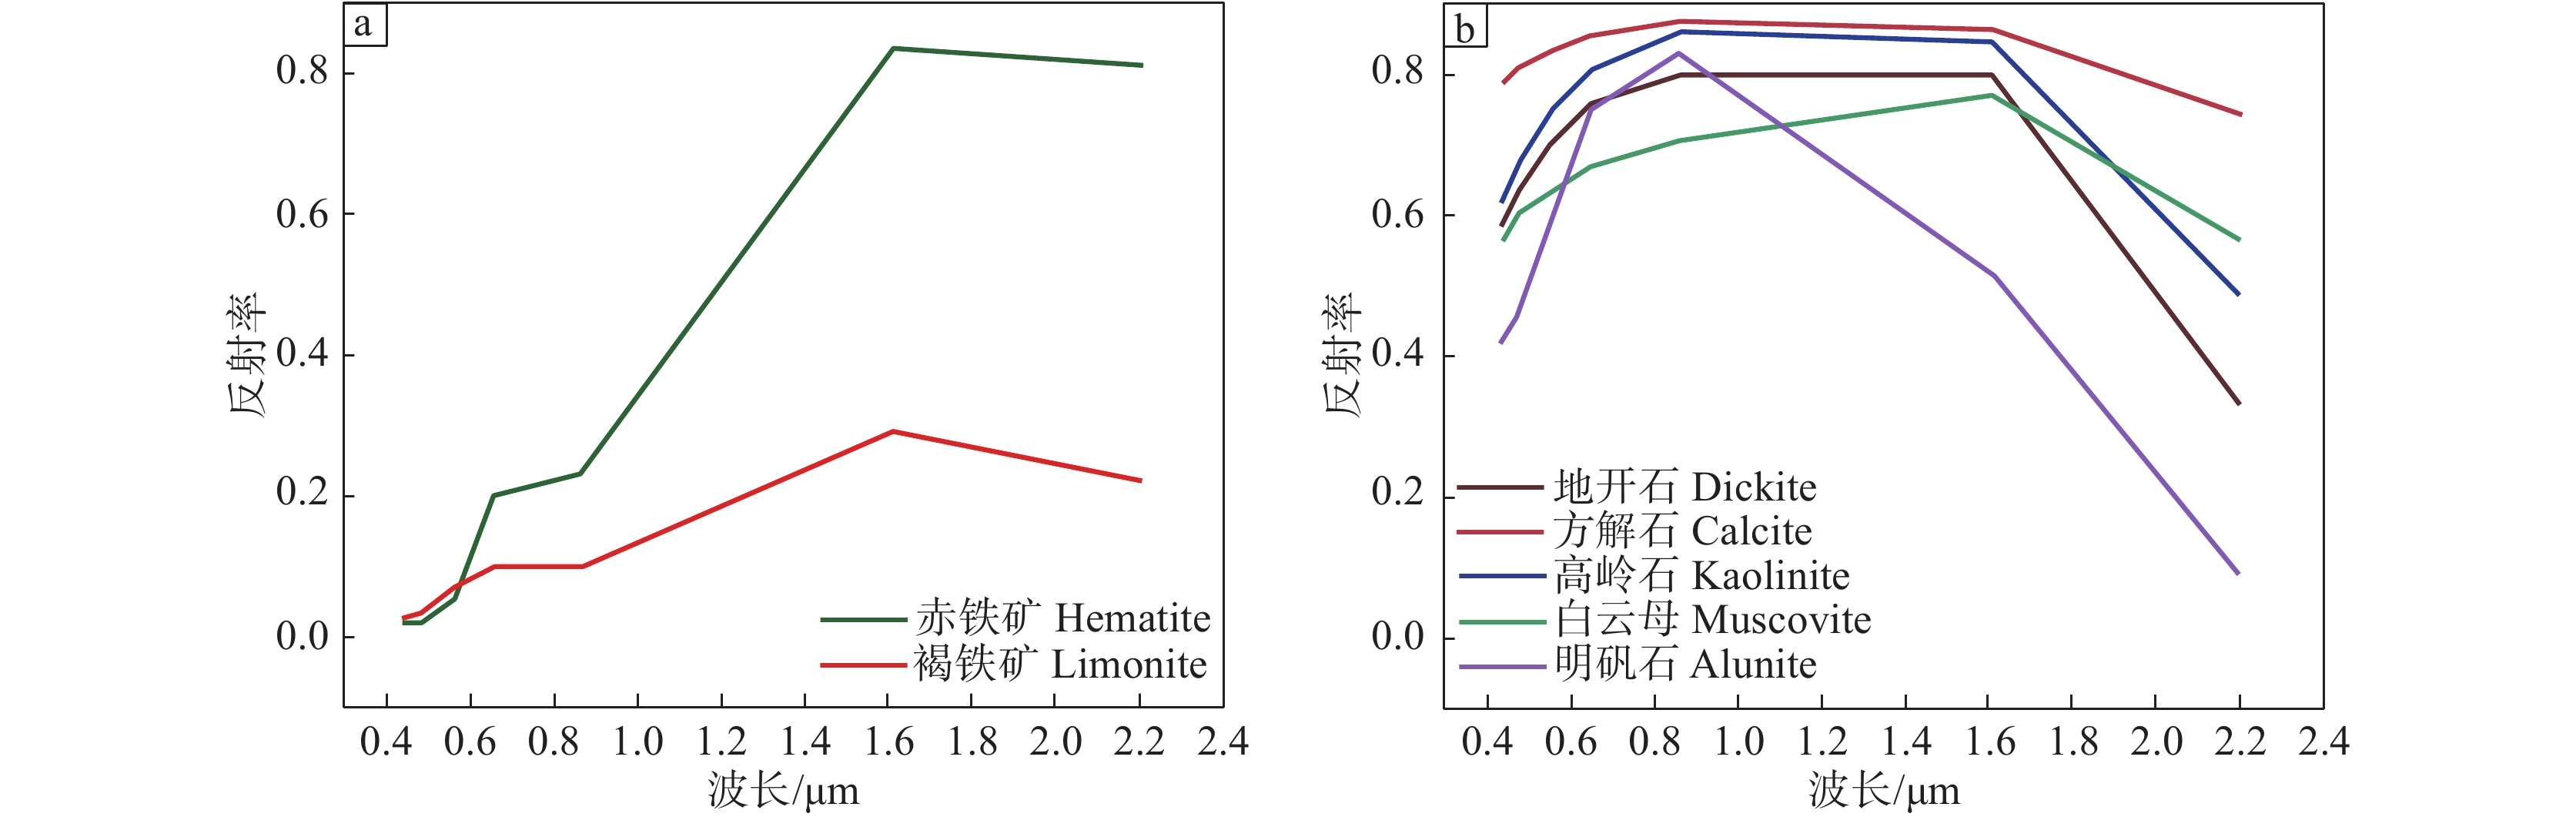
图 3 基于Landsat−8的铁染(a)与羟基(b)蚀变矿物重采样波谱曲线
Figure 3. Resampling spectrum curve of iron−stained (a) and hydroxyl (b) alteration minerals based on Landsat−8
![]()
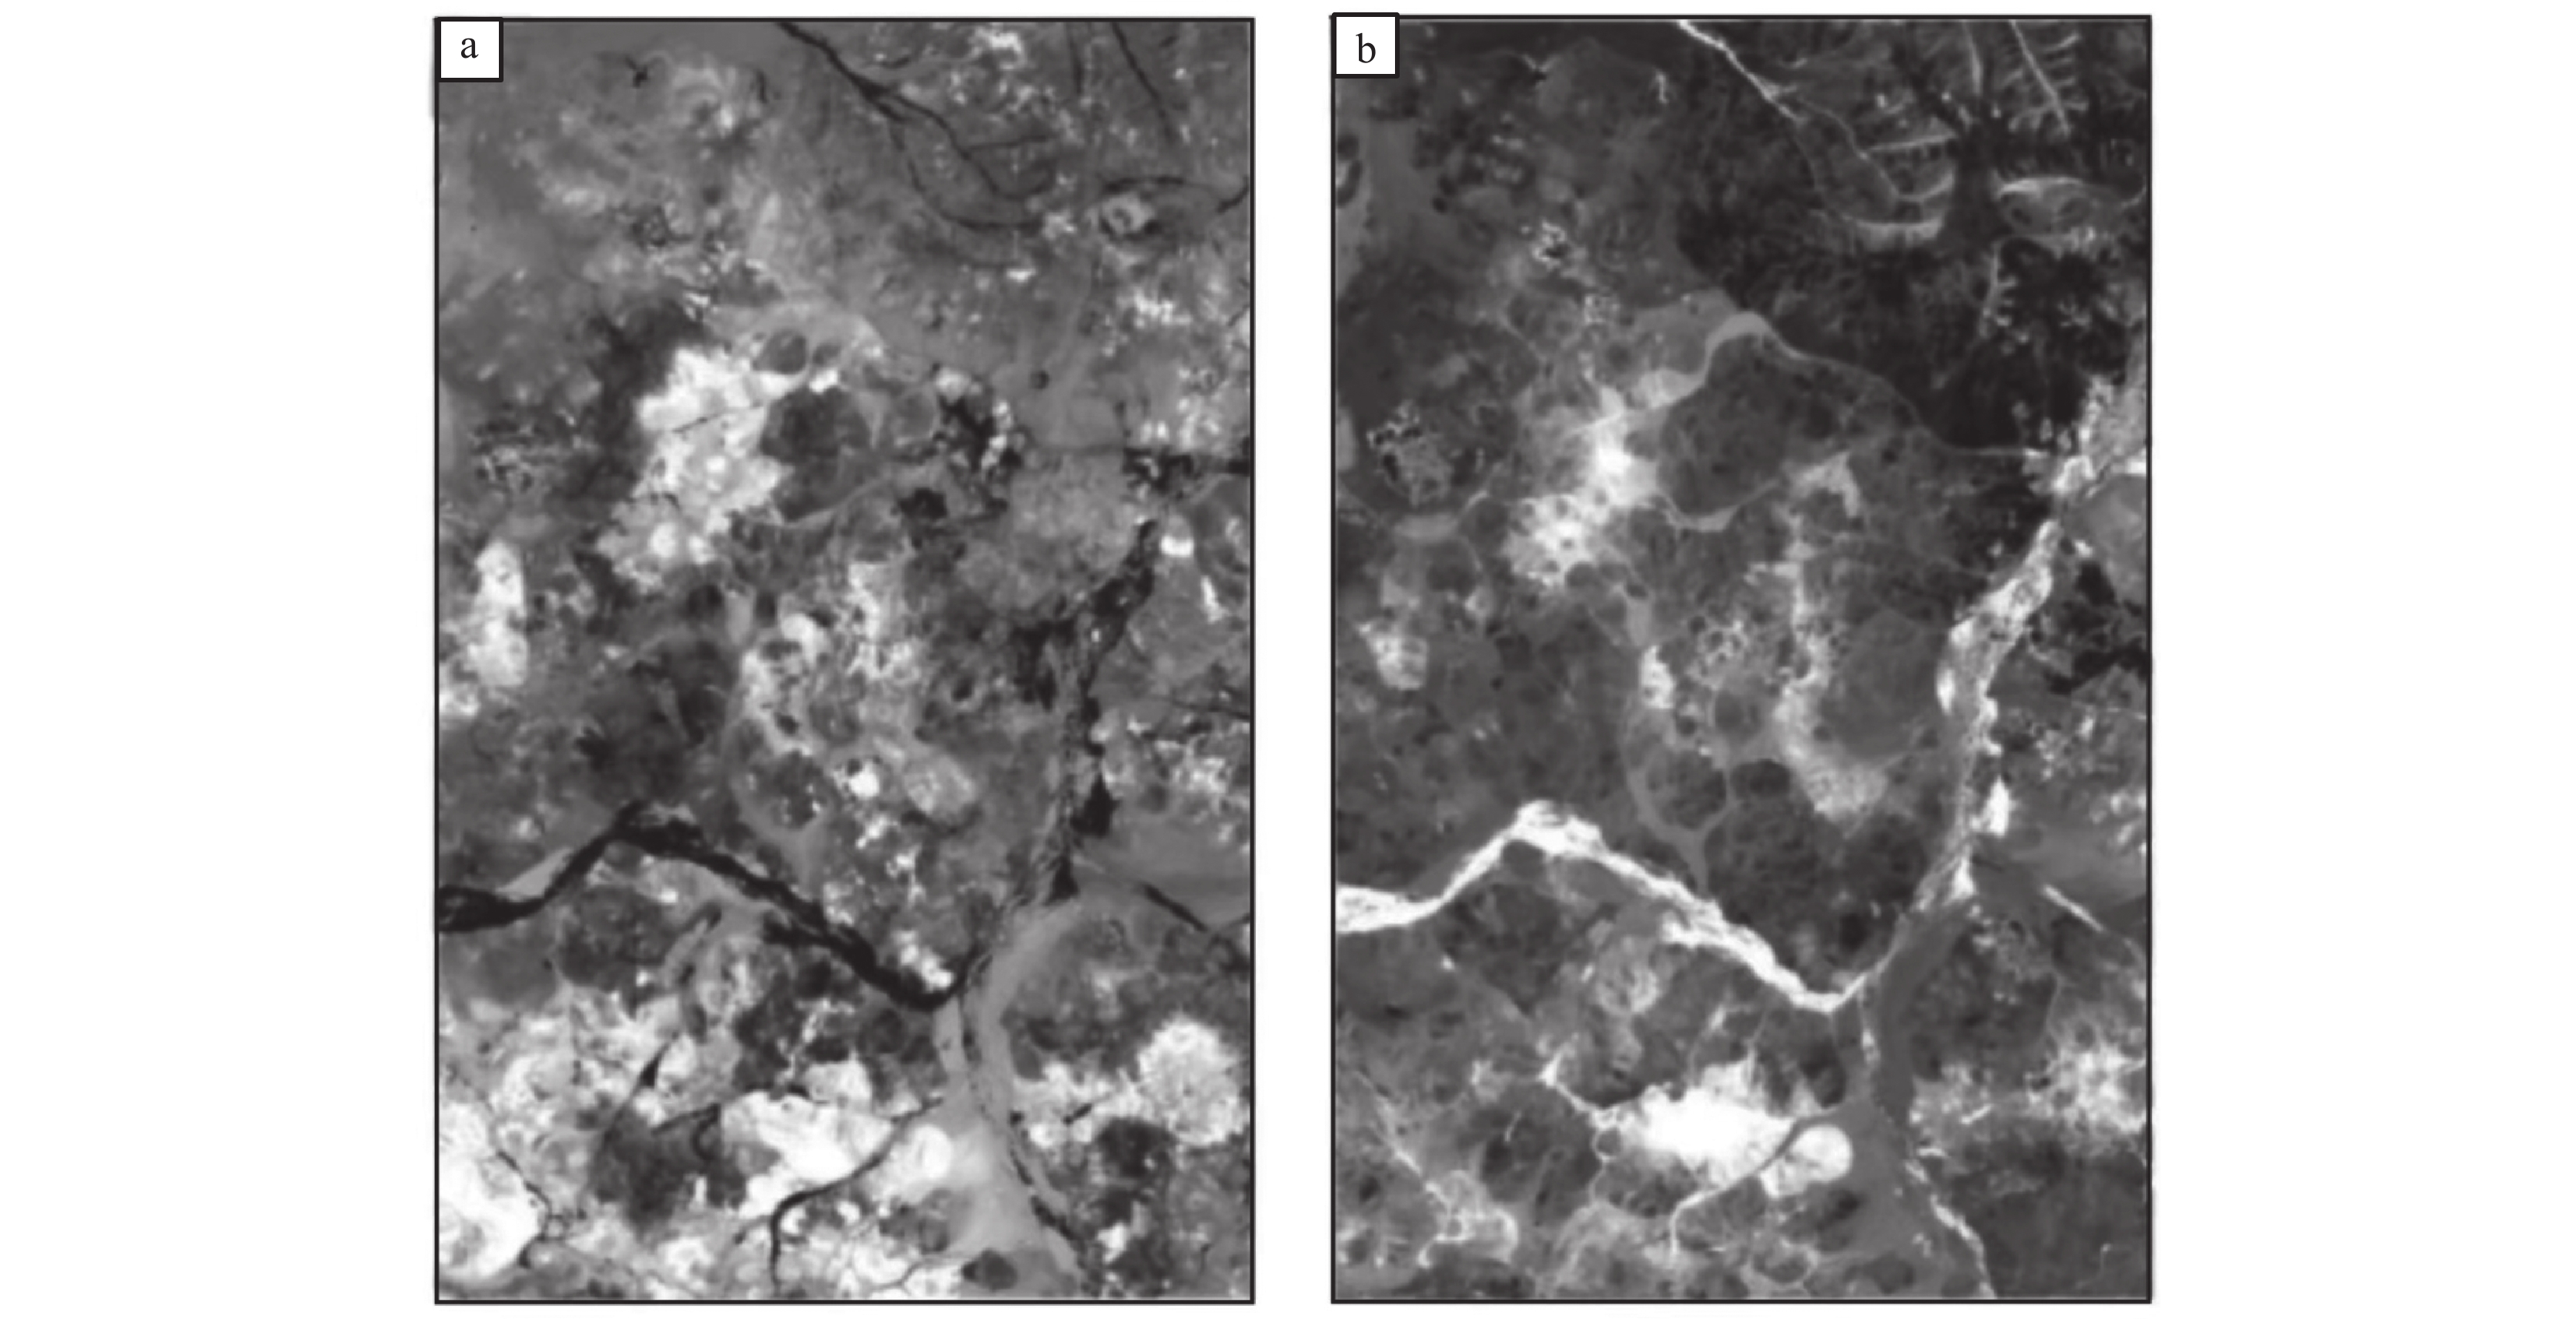
图 4 铁染蚀变信息(a)和羟基蚀变信息(b)比值法增强图像
Figure 4. Ratio of image to enhance alteration information with iron−stained (a) and hydroxyl (b)
![]()
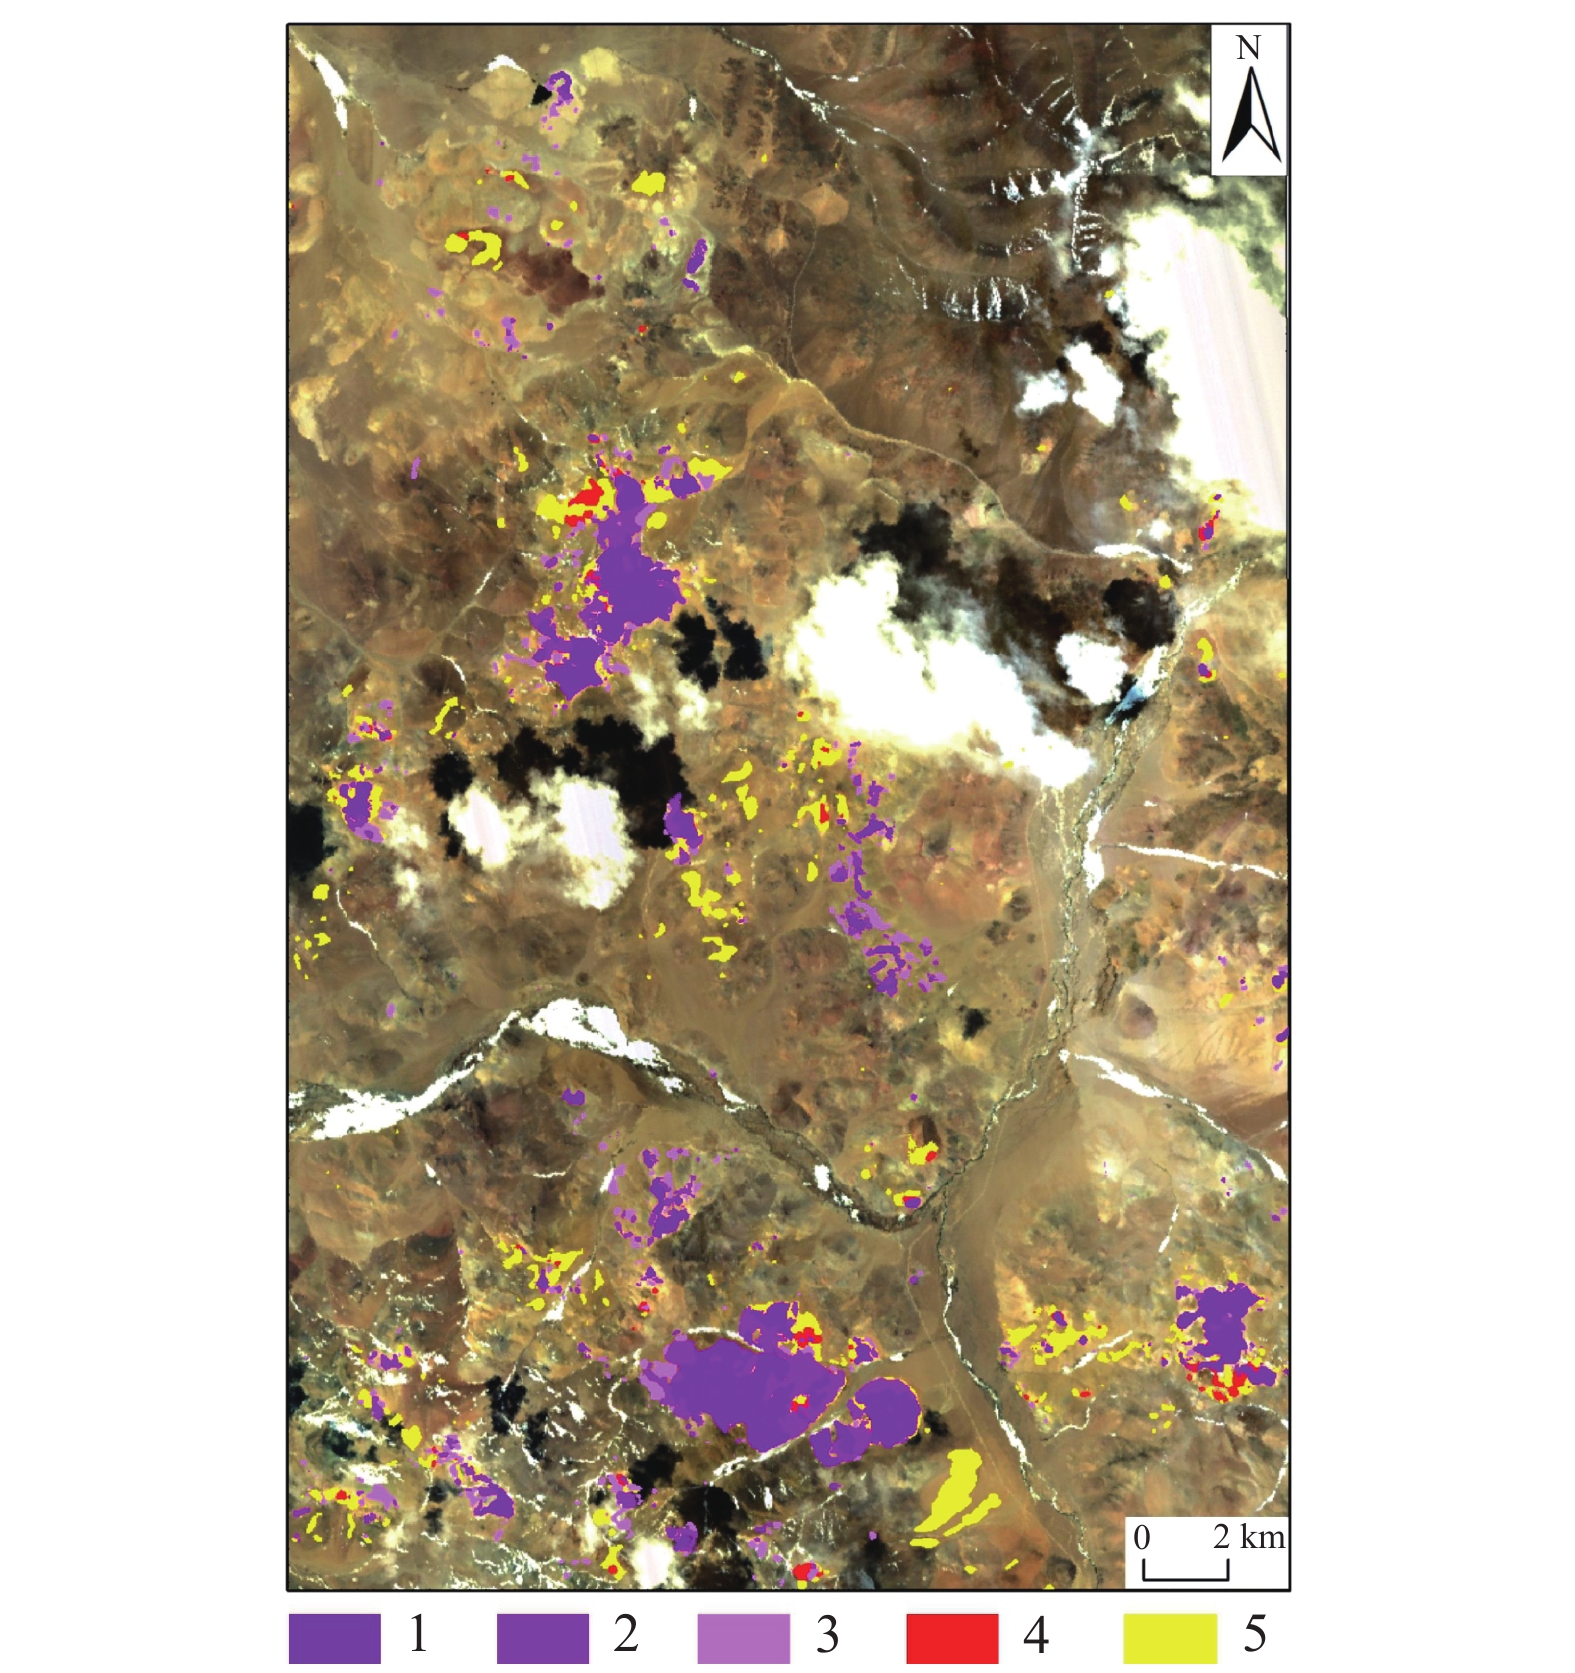
图 5 Landsat−8蚀变信息提取结果图
1—羟基一级;2—羟基二级;3—羟基三级;4—铁染一级;5—铁染二级
Figure 5. Results of alteration information extracted from Landsat−8
1–Hydroxy I; 2–Hydroxy II; 3–Hydroxy III; 4–Iron−stained I; 5–Iron−stained II
![]()
图 6 基于ASTER的典型铁染类(a)、铝羟基(b)、镁羟基(c)和碳酸盐类(d)蚀变矿物重采样波谱曲线
Figure 6. Resampling spectrum curve of typical iron−stained (a), aluminum hydroxyl (b), magnesium hydroxyl (c) and carbonate minerals (d) based on ASTER
![]()
图 7 ASTER蚀变信息提取结果图
1—铝羟基一级;2—铝羟基二级;3—镁羟基一级;4—镁羟基二级;5—碳酸盐一级;6—碳酸盐二级;7—铁染一级;8—铁染二级
Figure 7. Results of alteration information extracted from ASTER
1–Aluminum hydroxyl I; 2–Aluminum hydroxyl II; 3–Magnesium hydroxyl I; 4–Magnesium hydroxyl II; 5–Carbonate I; 6–Carbonate II; 7–Iron−stained I; 8–Iron−stained II
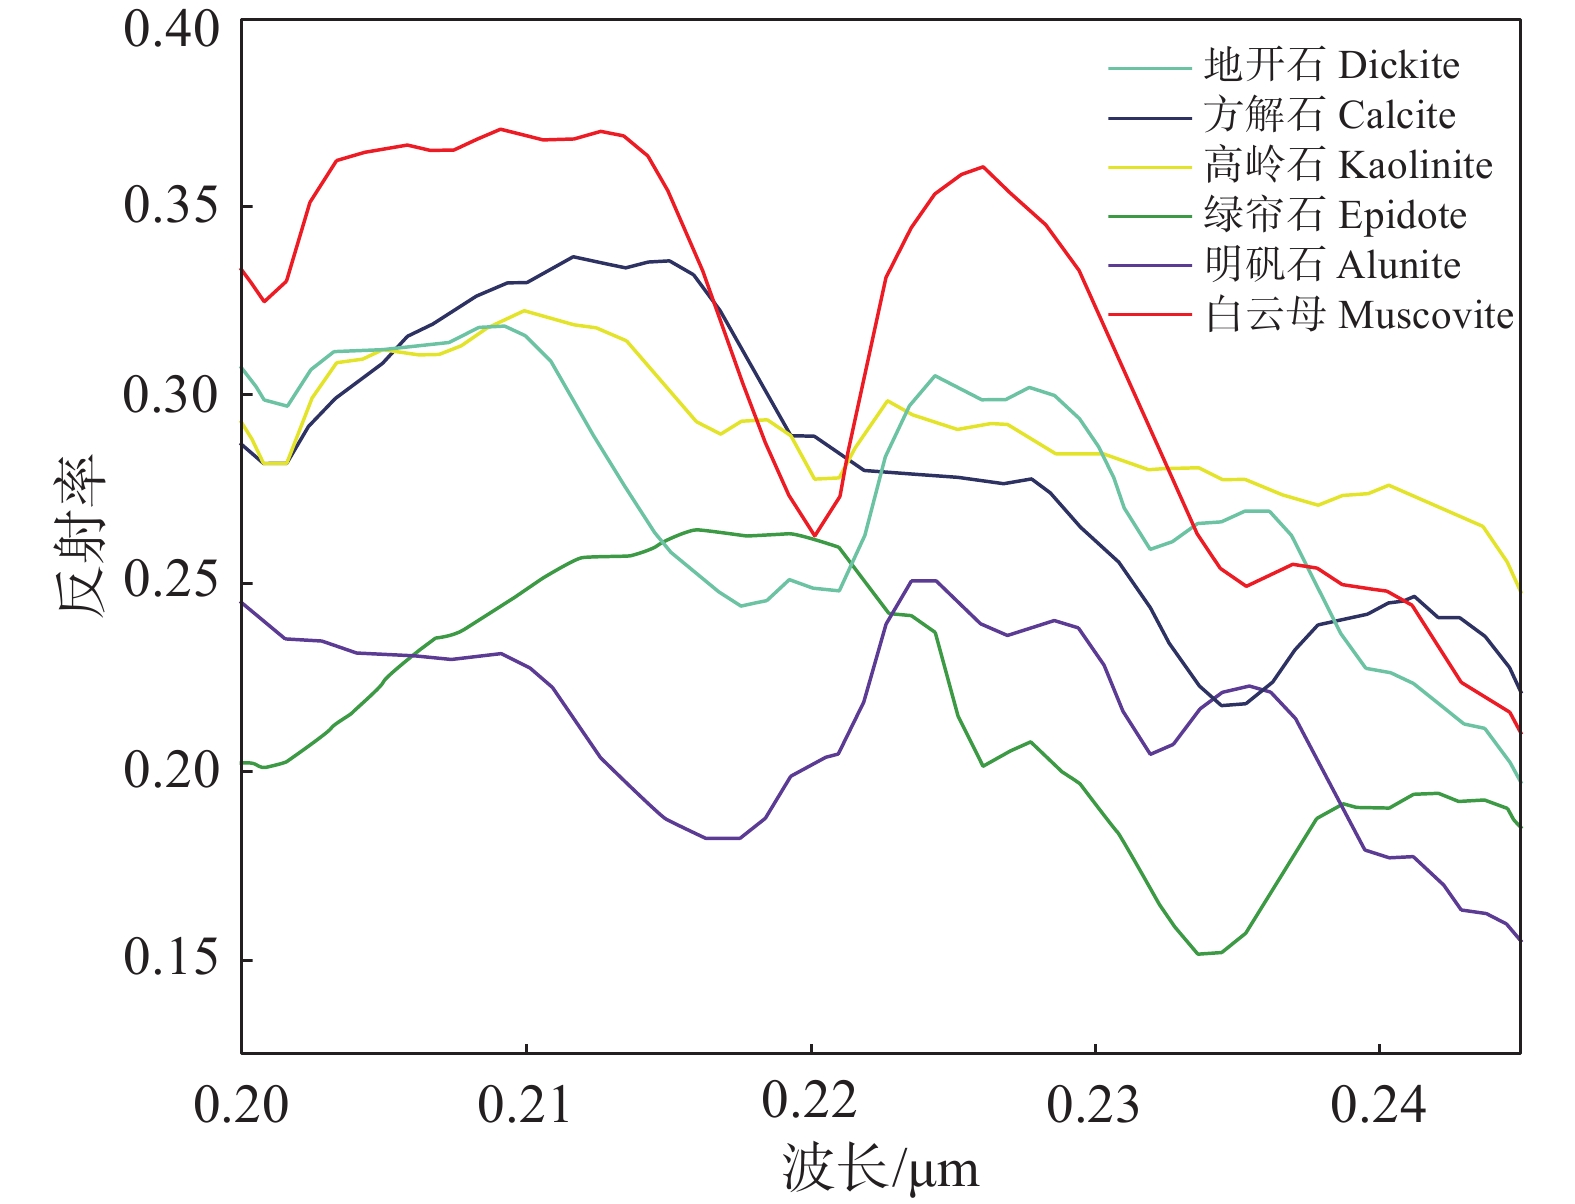
![]()
图 8 研究区蚀变矿物的参考影像光谱
Figure 8. Referenced image spectra of alteration minerals in the study area
![]()
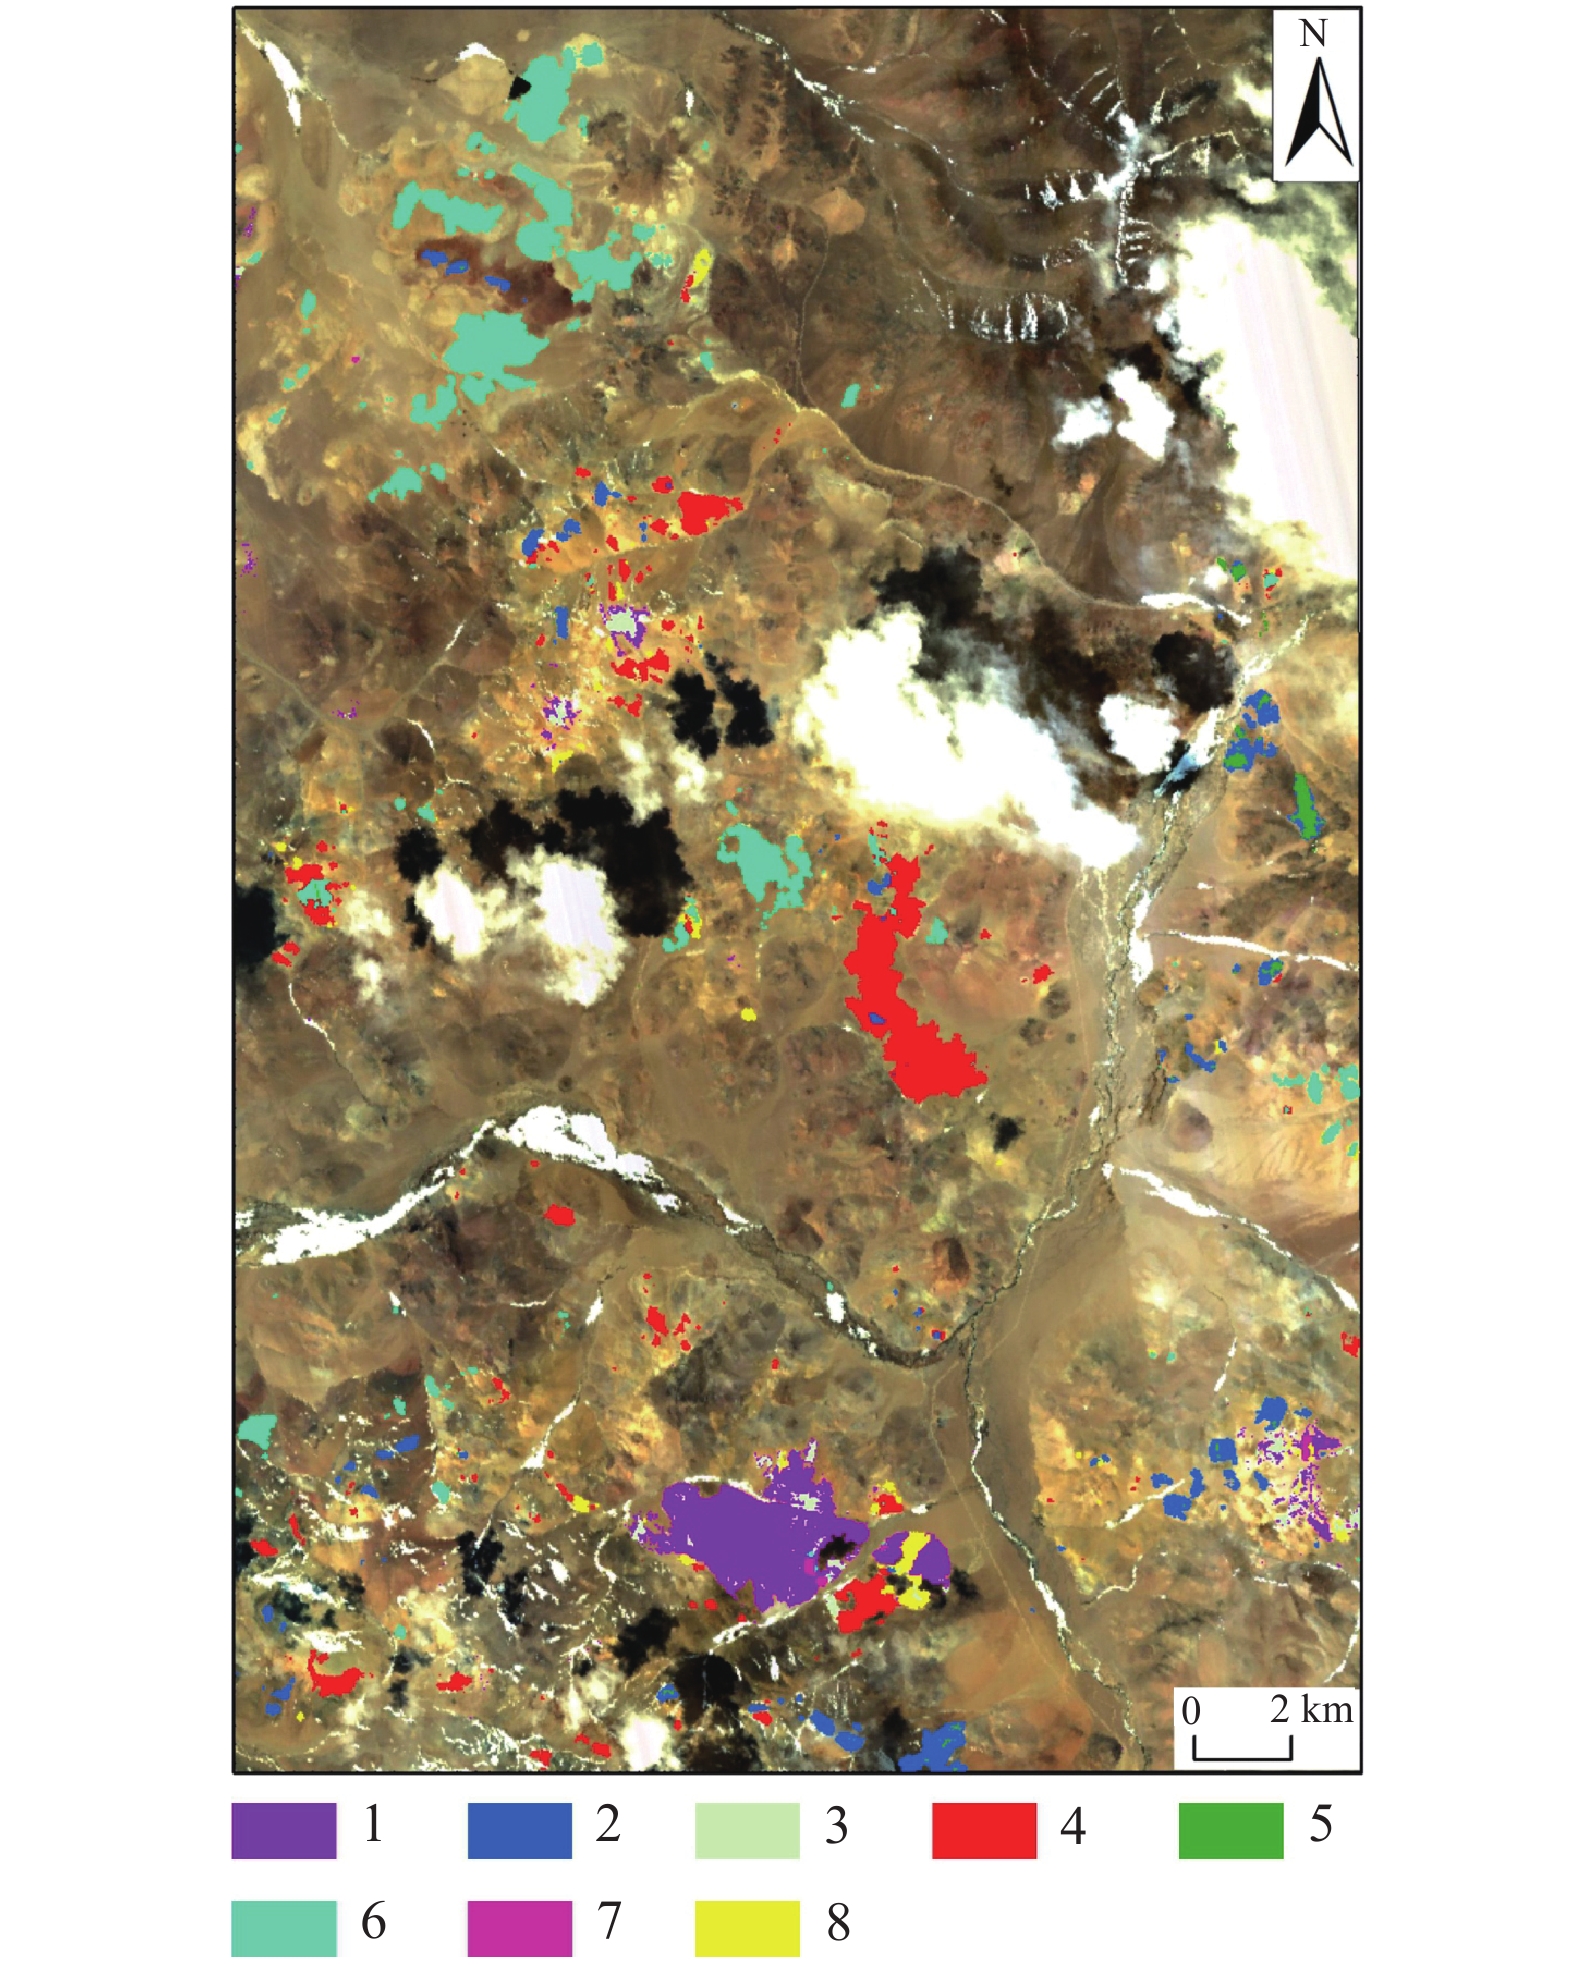
图 9 GF−5蚀变信息提取结果图
1—明矾石;2—方解石;3—地开石;4—普通白云母;5—绿帘石;6—高岭石;7—钠云母;8—多硅白云母
Figure 9. Results of alteration information extracted from GF−5
1−Alunite; 2−Calcite; 3−Dickite; 4−Muscovite; 5−Epidote; 6−Kaolinite; 7−Paragonite; 8−Phengite
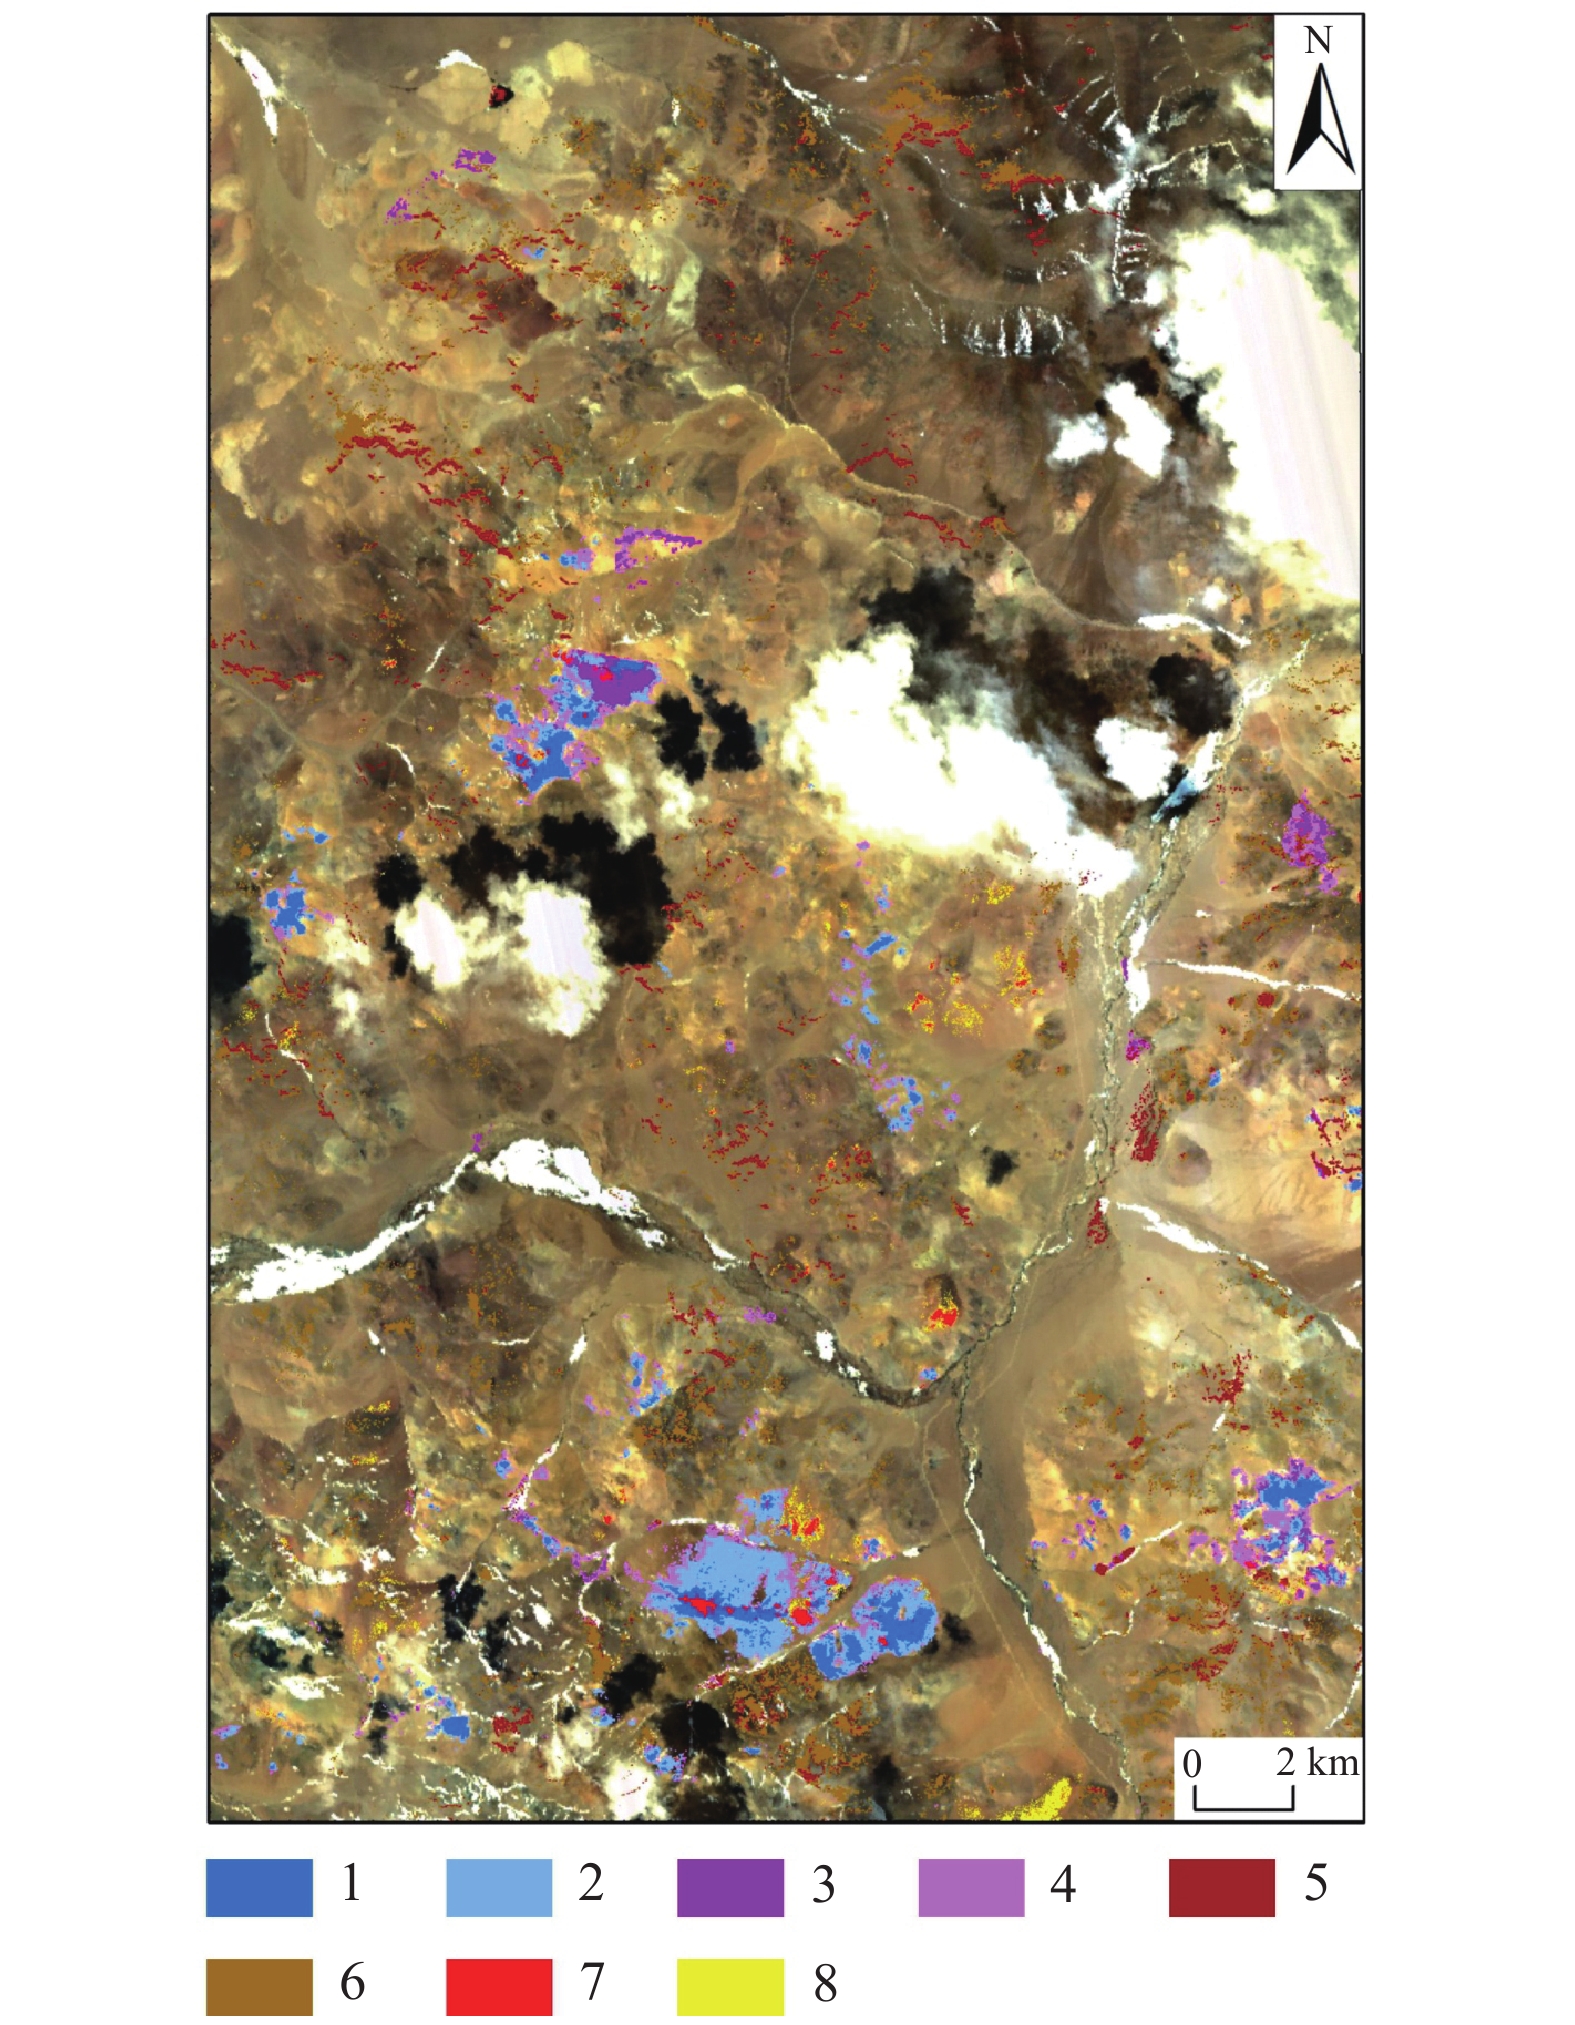
![]()
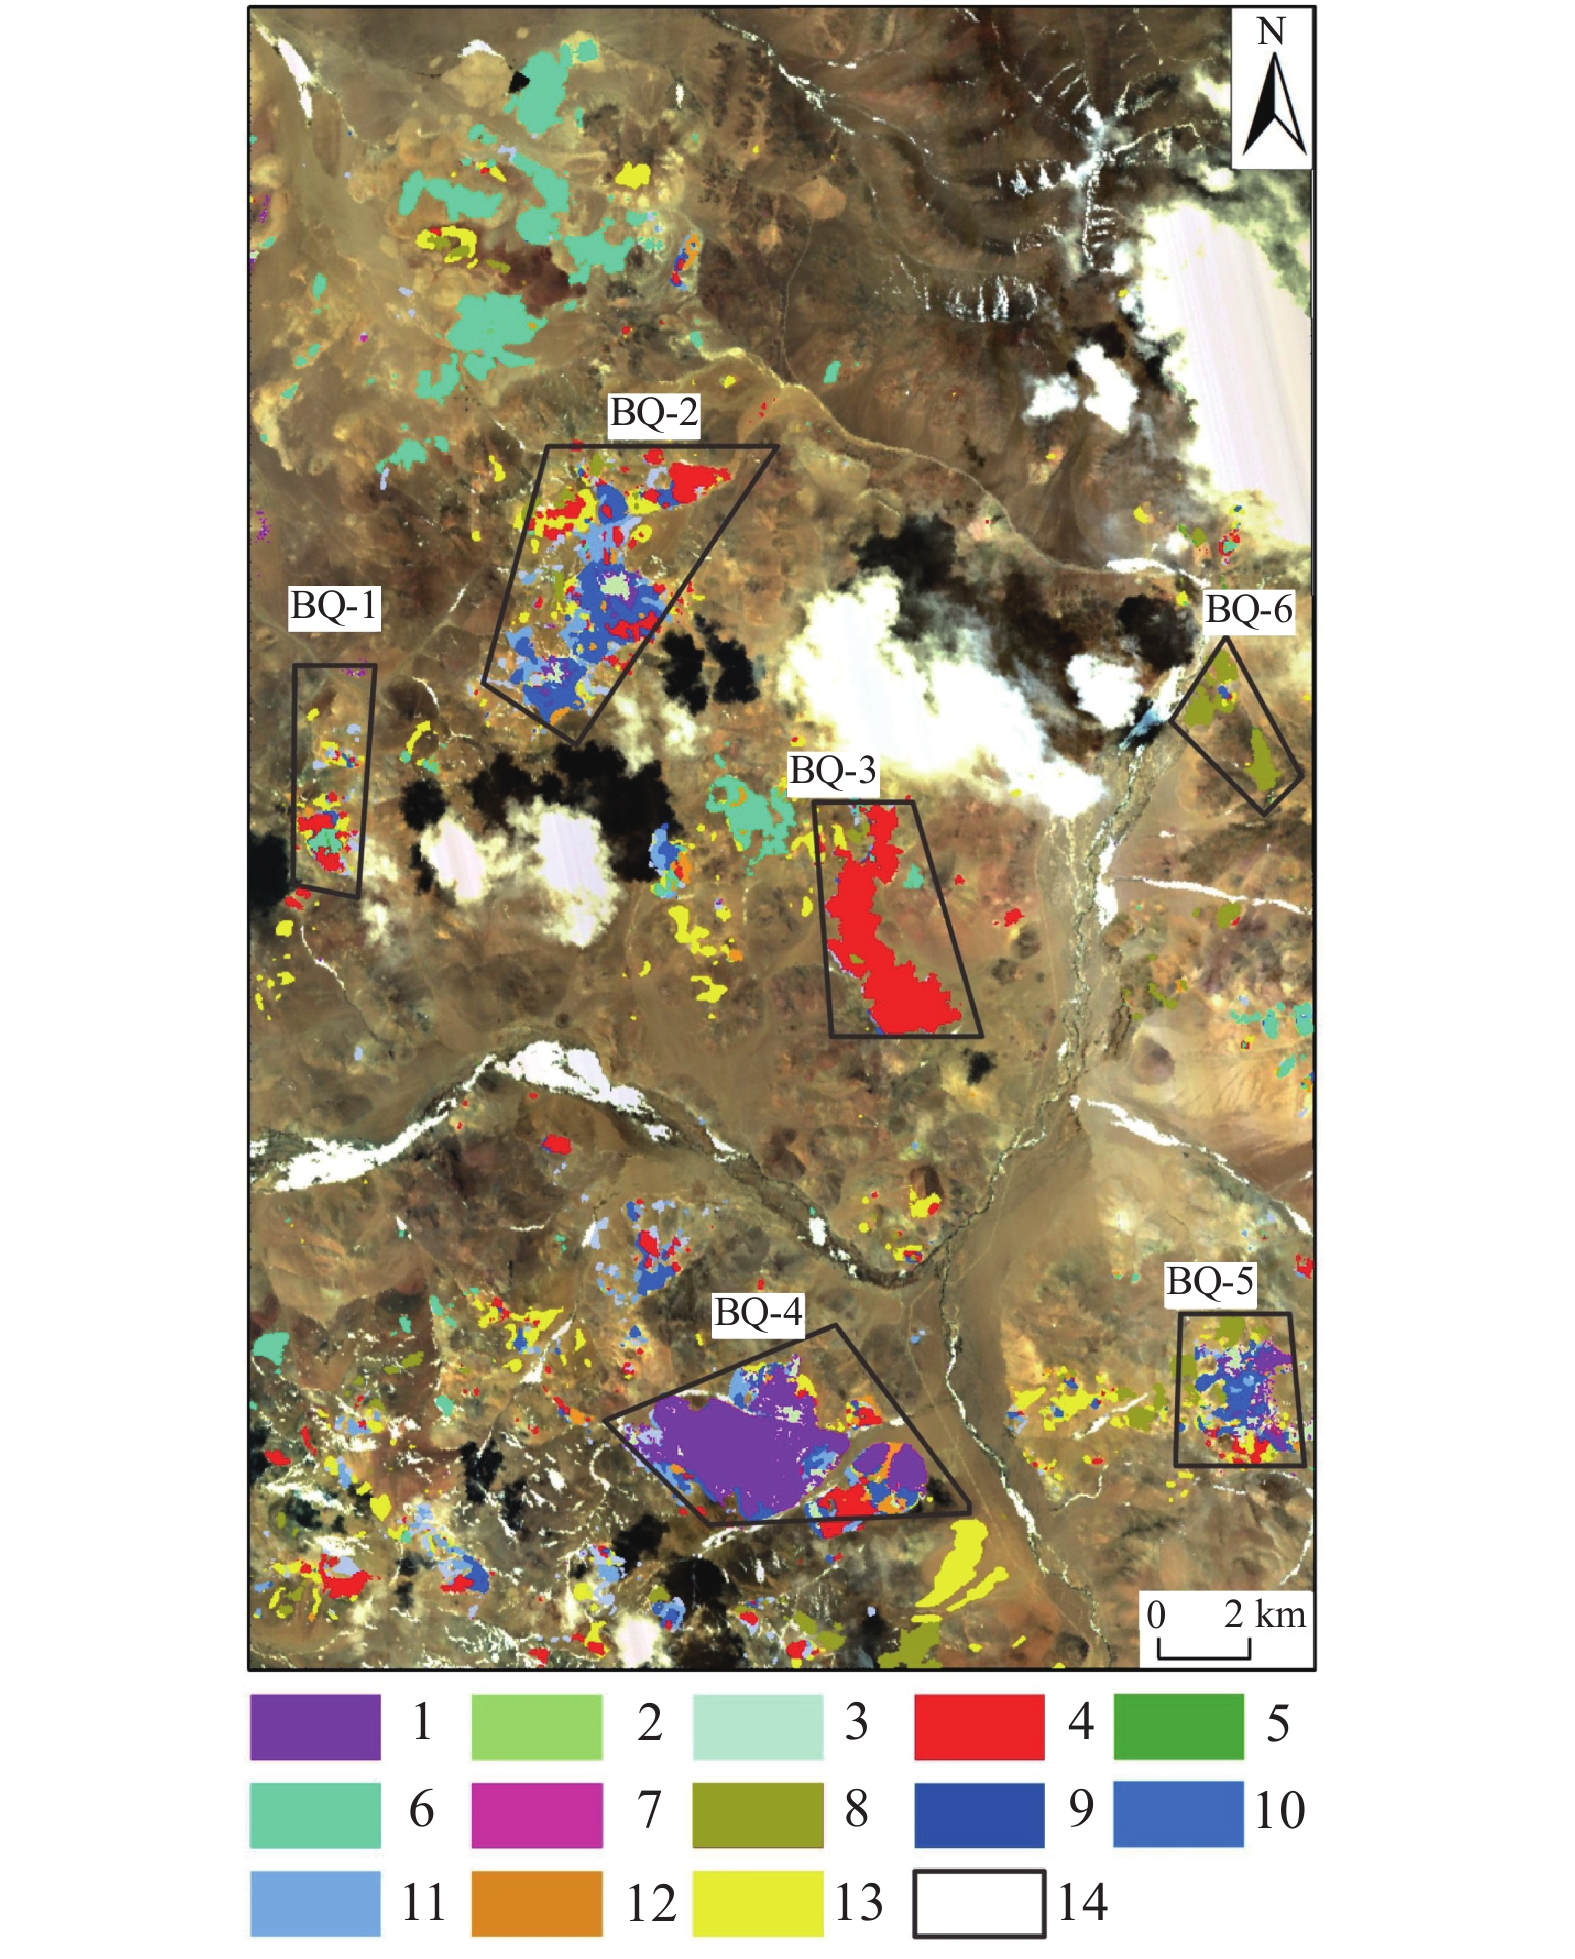
图 10 研究区蚀变信息结果及异常区分布图
1—明矾石;2—方解石;3—地开石;4—普通白云母;5—绿帘石;6—高岭石;7—钠云母;8—多硅白云母;9—羟基一级;10—羟基二级;11—羟基三级;12—铁染一级;13—铁染二级;14—异常区
Figure 10. Results of alteration information and anomalous area distribution
1−Alunite; 2−Calcite; 3−Dickite; 4−Muscovite; 5−Epidote; 6−Kaolinite; 7−Paragonite; 8−Phengite; 9−Hydroxyl I; 10−Hydroxyl II; 11−Hydroxyl III; 12−Iron−stained I; 13−Iron−stained II; 14−Anomalous areas
![]()
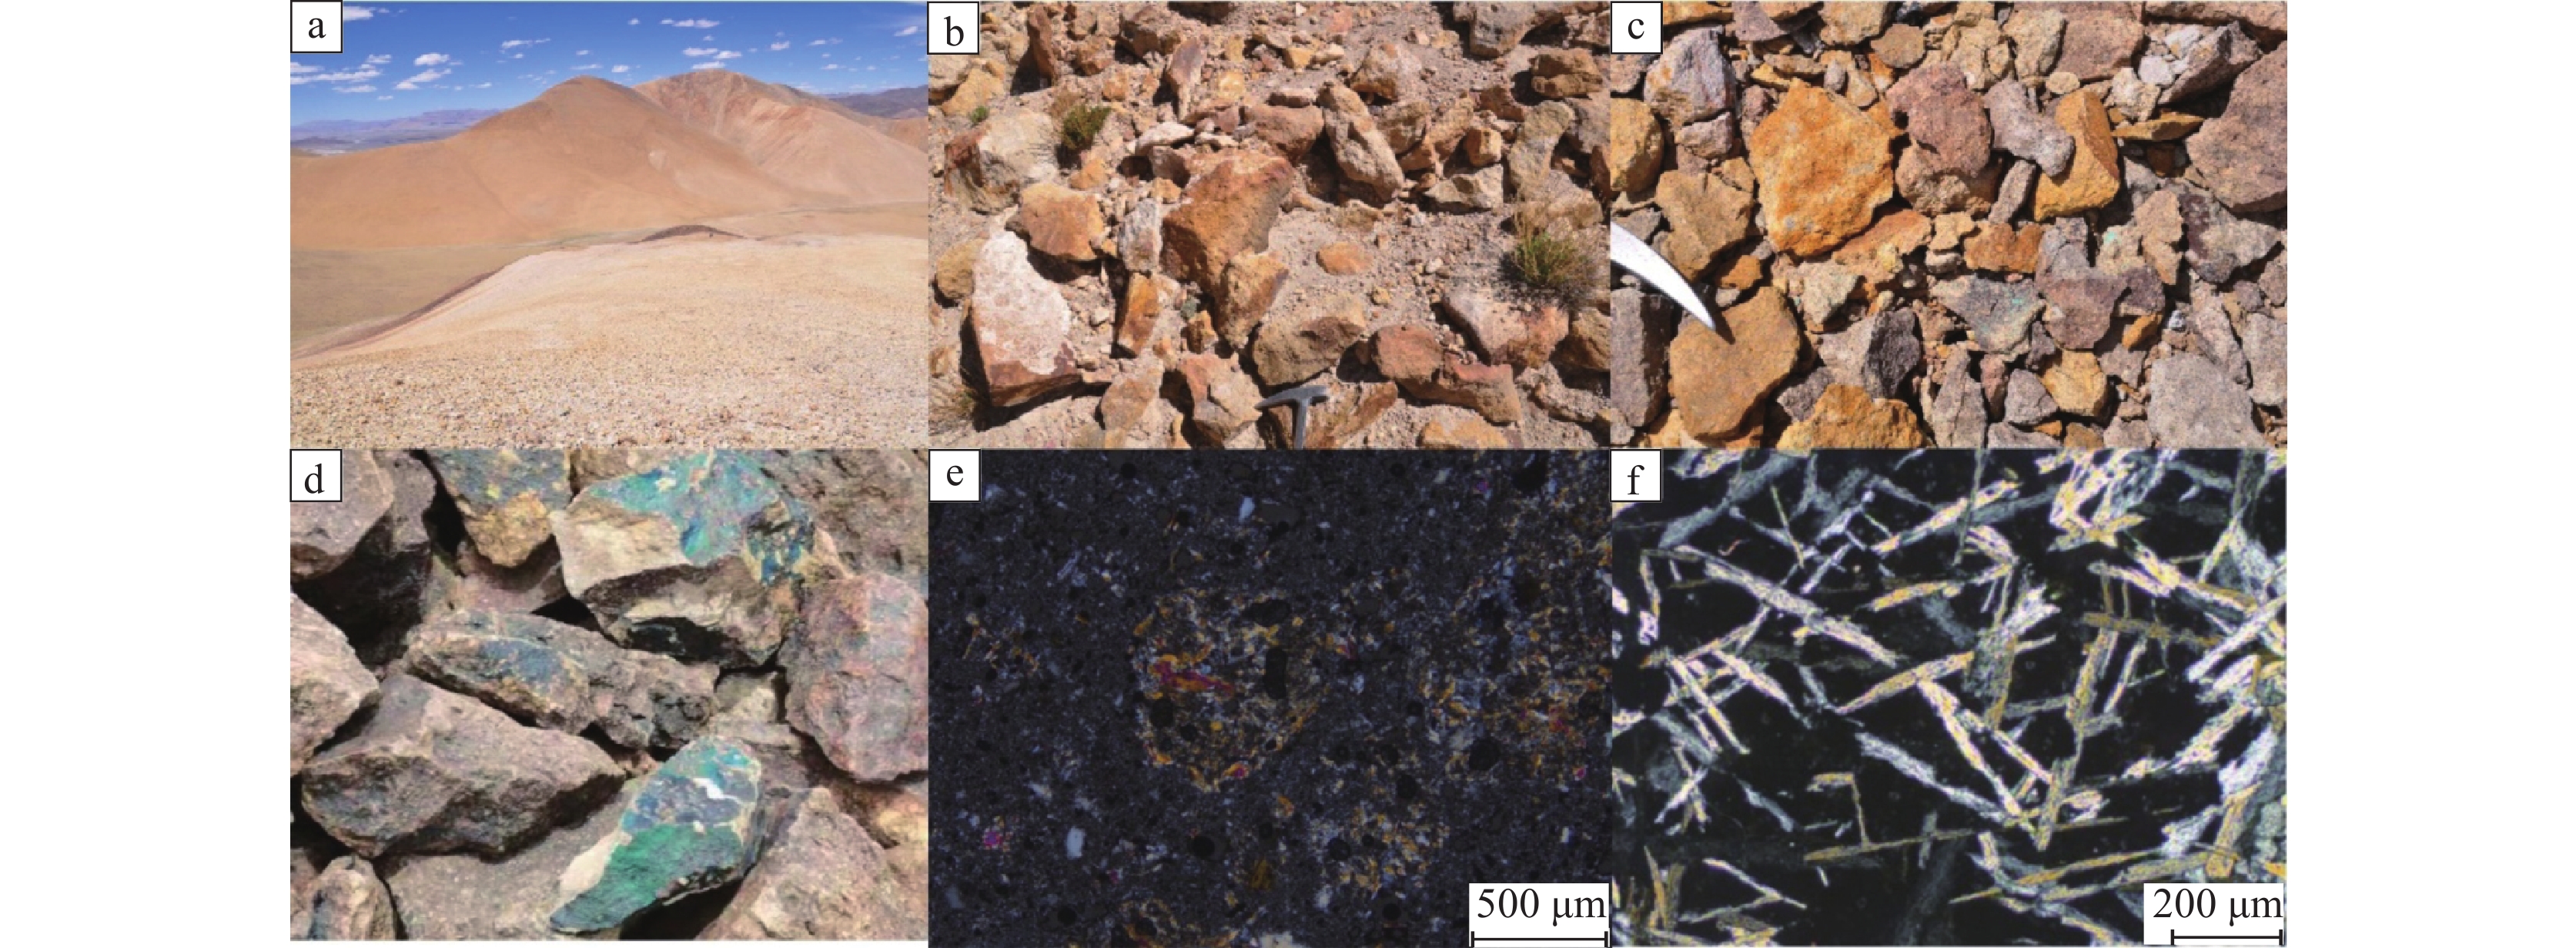
图 11 珠勒−芒拉地区野外照片及明矾石镜下特征
a—野外大规模褪色带;b、c—野外铁染蚀变异常;d—野外孔雀石化;e、f—BQ−异常区明矾石镜下特征
Figure 11. Field images and microscopic characteristics of alunite in Zhule−Mangla area
a−The large−scale fade zone in the field; b, c−The iron−stained anomaly in the field; d−Malachite found in the field; e, f−Microscopic characteristics of alunite in the anomalous area BQ−4
表 1 保留的波段及波长范围(共计290个波段)
Table 1 Bands remained and wavelength ranges (290 bands in total)
保留波段号(波段序号) 波长范围/nm 1~150(1~150) 390~1029 155~191(151~187) 1038~1342 202~245(188~231) 1435~1797 266~324(232~290) 1974~2463  下载: 导出CSV
表 2 ASTER数据Band1、3、4、8主成分得分
Table 2 Changes in principal components of band 1, 3, 4 and 8 based on ASTER data
主成分 Band1 Band3 Band4 Band8 PC1 −0.463516 −0.860375 −0.173869 −0.121149 PC2 −0.025923 0.252097 −0.774868 −0.579098 PC3 0.885530 −0.442635 −0.125650 −0.064204 PC4 −0.017808 0.016595 −0.594610 0.803646
下载: 导出CSV
表 3 ASTER数据Band7、8、9主成分得分
Table 3 Changes in principal components of band 7, 8 and 9 based on ASTER data
主成分 Band7 Band8 Band9 PC1 −0.628682 −0.557667 −0.542002 PC2 −0.759775 0.291838 0.581010 PC3 0.165833 −0.777070 0.607175
下载: 导出CSV
-
[1] Chen Chao, He Chunxiao, Shi Shanqiu, Zhou Shaoguang. 2016. Research on remote sensing images classification based on decision tree[J]. Geospatial Information, 14(8): 50−51, 60, 5 (in Chinese with English abstract).
[2] Chen Q, Zhao Z F, Zhou J Xi, Zhu R F, Xia J S, Sun T, Zhao X, Chao J Q. 2022. ASTER and GF−5 satellite data for mapping hydrothermal alteration minerals in the Longtoushan Pb−Zn deposit, SW China[J]. Remote Sensing, 14(5): 1253. doi: 10.3390/rs14051253
[3] Dai Jingjing, Wang Runsheng. 2013. Spectral characteristics of typical transparent mineral groups[J]. Geological Science and Technology Information, 32(2): 8−14 (in Chinese with English abstract).
[4] Fang Caili, Zhao Yaliang. 2012. Research on destriping algorithm for hyperspectral images[J]. Computer Engineering and Applications, 48(12): 158−162 (in Chinese with English abstract).
[5] Fang Sen, Jiao Shuhong. 2019. Multi−endmember hysperspectral image unmixing based on group optimization[J]. Applied Science and Technology, 46(6): 20−24, 52 (in Chinese with English abstract).
[6] Gao Ke, Song Yang, Liu Zhibo, Yang Huanhuan, Lin Bin, Li Faqiao. 2024. Constraints on metallogenic age from cryptoexplosive breccia in Naruo Cu(Au) deposit, Xizang[J]. Geology in China, 51(2): 385−398 (in Chinese with English abstract).
[7] Gao Yang, Xi Ge, Chen Chun Xia, Xiu Liancun, Zheng Zhizhong, Yan Peisheng, Dong Jinxin, Yan Baikun, Liu Jiahang, Zhao Yuhao, Yu Zhengkui. 2023. The application of a small airborne hyperspectral imaging spectrometer on remote sensing geology and lithology interpretation in alpine canyon regions[J]. Geology in China, 50(4): 1032−1043 (in Chinese with English abstract).
[8] Guha A, Saw A K, Mukherjee A, Verma C B, Kumar K V, Rao P V N, Diwakar P G. 2022. Eigen vector based analysis of Landsat OLI principal components and constrained energy minimization maps for discriminating iron enriched zones in banded iron formation (BIF) in Sidhi, Madhya Pradesh[J]. Geocarto International, 37(7): 1880−1898. doi: 10.1080/10106049.2020.1801861
[9] Huang W X, Zhang L M, Si X L, Xu H Y, Chen H Y, Li X, Zhao Y H. 2020. On−orbit performance evaluation of on−board calibration component of GF−5 visible and infrared multispectral image[J]. Acta Optica Sinica, 40(20): 2029001. doi: 10.3788/AOS202040.2029001
[10] Jain R, Sharma R U. 2019. Airborne hyperspectral data for mineral mapping in Southeastern Rajasthan, India[J]. International Journal of Applied Earth Observation and Geoinformation, 81: 137−145. doi: 10.1016/j.jag.2019.05.007
[11] Jiang Qi, Dai Jingjing, Wang Denghong, Tian Shufang. 2021. Application of optical remote sensing to identifying granite pegmatite lithium deposits[J]. Mineral Deposits, 40(4): 793−804 (in Chinese with English abstract).
[12] Kumar C, Chatterjee S, Oommen T, Guha A. 2020. Automated lithological mapping by integrating spectral enhancement techniques and machine learning algorithms using AVIRIS−NG hyperspectral data in Gold−bearing granite−greenstone rocks in Hutti, India[J]. International Journal of Applied Earth Observation and Geoinformation, 86: 102006. doi: 10.1016/j.jag.2019.102006
[13] Lian Dunmei, Guo Na, Hu Zhenghua, Long Tuojiang, Yuan Shan, MiMa Wangjiu. 2020. Relationship between spectral characteristics of sericite and mineral composition and mineralization of Zhuxi Copper−Tungsten deposit in Jiangxi[J]. China Tungsten Industry, 35(5): 20−34 (in Chinese with English abstract).
[14] Liu H Z, Wu K, Xu H G, Xu Y. 2021. Lithology classification using TASI thermal infrared hyperspectral data with convolutional neural networks[J]. Remote Sensing, 13(16): 3117. doi: 10.3390/rs13163117
[15] Liu Shuai, Xing Guanglong. 2020. Multi−dimensional convolutional network collaborative unmixing method for hyperspectral image mixed pixels[J]. Journal of Geodesy and Geoinformation Science, 49(12): 1600−1608 (in Chinese with English abstract).
[16] Liu Tingyue, Dai Jingjing, Zhao Yuanyi, Tian Shufang, Ye Chuanyong. 2021. Remote sensing inversion of lithium concentration in salt lake using LightGBM: A case study of northern Zabuye salt lake in Tibet[J]. Acta Geologica Sinica, 95(7): 2249−2256 (in Chinese with English abstract).
[17] Lü Xinbiao, Zhu Jiang, Cao Xiaofeng, Chen Chao, Wu Chunming, Hu Qincheng. 2012. Magmatismand its metallogenetic effects duringthe Paleozoic−Triassiccontinental crustal construction in the Liuyuan area, south Beishan, NW China[J]. Geological Scienceand Technology Information, 31(5): 119−127, 135 (in Chinese with English abstract).
[18] Ouyang Yuan, Liu Hong, Li Guangming, Ma Dongfang, Zhang Linkui, Huang Hanxiao, Zhang Jinghua, Zhang Tengjiao, Liu Xiao, Zhao Yinbin, Li Fu. 2023. Mineral search prediction based on Random Forest algorithm: A case study on porphyry−epithermal copper polymetallic deposits in the western Gangdise meatallogenic belt[J]. Geology in China, 50(2): 303−330 (in Chinese with English abstract).
[19] Pi Yuanzheng, Chu Dong, Guan Xiaobin, Shen Huanfeng. 2020. Strip noise removal in GF−5 images considering the difference in land and water[J]. Journal of Remote Sensing, 24(4): 360−367 (in Chinese with English abstract).
[20] Rui Zongyao, Lu Yan, Li Guangming, Wang Longsheng, Wang Yitian. 2003. Looking forward to the prospects of porphyry copper deposits in Tibet[J]. Geology in China, 30(3): 302−308 (in Chinese with English abstract).
[21] Su Wei, Jiang Fangfang, Zhu Dehai, Zhan Junge, Ma Hongyuan, Zhang Xiaodong. 2015. Extraction of maize planting area based on decision tree and mixed−pixel unmixing methods[J]. Transactions of the Chinese Society of Agricultural Machinery, 46(9): 289−295, 301 (in Chinese with English abstract).
[22] Sun L, Khan S D, Sarmiento S, Lakshmikantha M R, Zhou H W. 2017. Ground−based hyperspectral imaging and terrestrial laser scanning for fracture characterization in the Mississippian Boone formation[J]. International Journal of Applied Earth Observation and Geoinformation, 63: 222−233. doi: 10.1016/j.jag.2017.08.008
[23] Sun Yongbin, Wang Ruijun, Wei Benzan, Wang Bing, Dong Shuangfa, Li Cunjin, Li Mingsong. 2018. The application of hyperspectral remote sensing ground−air integrated prediction method to the copper gold deposit prospecting in Kalatag area, Xinjiang[J]. Geology in China, 45(1): 178−191 (in Chinese with English abstract).
[24] Sun Yu, Liu Jiajun, Zhao Yingjun, Zhai Degao, Liu Zhenjiang, Zhang Fangfang, Qin Kai, Tian Feng, Kang Xiangyang, Pei Chengkai, Liu Pengfei. 2022a. Extraction of alteration minerals based on the airborne hyperspectral CASI−SASI data and the application to the Xiaojinwozi area in Dunhuang city, Gansu province[J]. Geology and Prospecting, 58(3): 653−664 (in Chinese with English abstract).
[25] Sun Yu, Liu Jiajun, Zhao Yingjun, Zhai Degao, Liu Zhenjiang, Zhang Yafeng, Zhang Fangfang, Tian Feng, Qin Kai. 2022b. Alteration mineral mapping based on the GF−5 hyperspectral data and its geological application: An example of the Huaniushan area in Guazhou County of Gansu Province[J]. Geology in China, 49(2): 558−574 (in Chinese with English abstract).
[26] Sun Yunzhu, Jiang Guangwei, Li Yunduan, Yang Yong, Dai Haishan, He Jun, Ye Qinghao, Cao Qiong, Dong Changzhe, Zhao Shaohua, Wang Weihe. 2018. GF−5 satellite: Overview and application prospects[J]. Spacecraft Recovery and Remote Sensing, 39(3): 1−13 (in Chinese with English abstract).
[27] Tang J X, Yang H H, Song Y, Wang L Q, Liu Z B, Li B L, Lin B, Peng B, Wang G H, Zeng Q G, Wang Q, Chen W, Wang N, Li Z J, Li Y B, Li Y B, Li H F, Lei C Y. 2021. The copper polymetallic deposits and resource potential in the Tibet Plateau[J]. China Geology, 4(1): 1−16.
[28] Tian Chenhua, Yang Liqiang, He Wenyan, Zhang Shaoying, Liu Shentai, Wu Cai. 2022. Characteristics of short wave infrared spectroscopy of sericite group minerals and their implications for exploration in the Yulong porphyry copper deposit, Tibet[J]. Sedimentary Geology and Tethyan Geology, 42(1): 40−49 (in Chinese with English abstract).
[29] Tian Qinglin, Pan Wei, Li Yao, Zhang Chuan, Chen Xuejiao, Yu Changfa. 2019. Extraction of alteration information from hyperspectral core imaging based on wavelet packet transform and weight spectral angle mapper[J]. Remote Sensing for Land and Resources, 31(4): 41−46 (in Chinese with English abstract).
[30] van Ruitenbeek F J A, Debba P, van der Meer F D, Cudahy T, van der Meijde M, Hale M. 2006. Mapping white micas and their absorption wavelengths using hyperspectral band ratios[J]. Remote Sensing of Environment, 102(3−4): 211−222. doi: 10.1016/j.rse.2006.02.012
[31] Wang Chongchang, Xue Rongrong, Zhao Shihu, Liu Shuhan, Wang Xia, Li Hongzhou, Liu Ziqin. 2021. Quality evaluation and analysis of GF−5 hyperspectral image data[J]. Geography and Geo−information Science, 37(1): 33−38, 125 (in Chinese with English abstract).
[32] Wang Xi, Cheng Sanyou, Lin Haixing, Chen Jing, Xiao Liang. 2022. Research on alteration information extraction in Saishiteng area of Qinghai based on Aster and Landsat8 data[J]. Geological Review, 68(1): 262−280 (in Chinese with English abstract).
[33] Wei Shaogang, Song Yang, Tang Juxing, Gao Ke, Feng Jun, Li Yanbo, Hou Lin. 2016. Geochronology, geochemistry and petrogenesis of quartz diorite porphyrite from the Sena copper (gold) deposit, Tibet[J]. Geology in China, 43(6): 1894−1912 (in Chinese with English abstract).
[34] Wei Xiangpo, Yu Xuchu, Fu Qiongying, Liu Bing, Xue Zhixiang. 2016. Spectral matching classification approach and experiment combined with spectral angle cosine and spectral correlation coefficient[J]. Geography and Geo−Information Science, 32(3): 29−33, 2 (in Chinese with English abstract).
[35] Ye Fawang, Meng Shu, Zhang Chuan, Xu Qingjun, Liu Hongcheng, Wu Ding. 2018. Minerageny study of high−Al, medium−Al−and low−Al sericites identified by airborne hyperspectral remote sensing technology[J]. Acta Geologica Sinica, 92(2): 395−412 (in Chinese with English abstract).
[36] 陈超, 赫春晓, 石善球, 周绍光. 2016. 一种基于决策树方法的遥感影像分类研究[J]. 地理空间信息, 14(8): 50−51,60,5. doi: 10.3969/j.issn.1672-4623.2016.08.017 [37] 代晶晶, 王润生. 2013. 常见透明矿物类波谱特征研究综述[J]. 地质科技情报, 32(2): 8−14. [38] 房彩丽, 赵雅靓. 2012. 高光谱图像条带噪声去除算法研究[J]. 计算机工程与应用, 48(12): 158−16. doi: 10.3778/j.issn.1002-8331.2012.12.032 [39] 房森, 焦淑红. 2019. 分组寻优的多端元高光谱图像解混方法. 应用科技, 46(6): 20−24, 52. [40] 高轲, 宋扬, 刘治博, 杨欢欢, 林彬, 李发桥. 2024. 西藏拿若铜(金)矿床隐爆角砾岩对成矿时代的约束[J]. 中国地质, 51(2): 385−398. [41] 高扬, 奚歌, 陈春霞, 修连存, 郑志忠, 颜培胜, 董金鑫, 闫柏琨, 柳稼航, 赵宇浩, 俞正奎. 2023. 小型机载高光谱成像仪在高山峡谷地区遥感地质岩性解译应用[J]. 中国地质, 50(4): 1032−1043. [42] 姜琪, 代晶晶, 王登红, 田淑芳. 2021. 光学遥感在识别花岗伟晶岩型锂矿床中的应用[J]. 矿床地质, 40(4): 793−804. [43] 连敦梅, 郭娜, 胡正华, 龙沱江, 袁珊, 米玛旺久. 2020. 江西朱溪铜钨矿床绢云母光谱特征与矿物成分、矿化的关系研究[J]. 中国钨业, 35(5): 20−34. [44] 刘帅, 邢光龙. 2020. 高光谱图像混合像元多维卷积网络协同分解法[J]. 测绘学报, 49(12): 1600−1608. [45] 刘婷玥, 代晶晶, 赵元艺, 田淑芳, 叶传永. 2021. 基于LightGBM的盐湖锂浓度遥感反演研究—以西藏扎布耶盐湖北湖为例[J]. 地质学报, 95(7): 2249−2256. [46] 吕新彪, 朱江, 曹晓峰, 陈超, 吴春明, 胡庆成. 2012. 北山南部柳园地区古生代−早中生代大陆地壳增生过程中的岩浆活动与成矿效应[J]. 地质科技情报, 31(5): 119−127, 135. [47] 欧阳渊, 刘洪, 李光明, 马东方, 张林奎, 黄瀚霄, 张景华, 张腾蛟, 柳潇, 赵银兵, 李富. 2023. 基于随机森林算法的找矿预测—以冈底斯成矿带西段斑岩−浅成低温热液型铜多金属矿为例[J]. 中国地质, 50(2): 303−330. [48] 皮原征, 储栋, 管小彬, 沈焕锋. 2020. 顾及水陆差异的高分五号影像条带去除[J]. 遥感学报, 24(4): 360−367. [49] 芮宗瑶, 陆彦, 李光明, 王龙生, 王义天. 2003. 西藏斑岩铜矿的前景展望[J]. 中国地质, 30(3): 302−308. [50] 苏伟, 姜方方, 朱德海, 展郡鸽, 马鸿元, 张晓东. 2015. 基于决策树和混合像元分解的玉米种植面积提取方法[J]. 农业机械学报, 46(9): 289−295, 301. [51] 孙永彬, 王瑞军, 魏本赞, 汪冰, 董双发, 李存金, 李名松. 2018. 高光谱遥感地空综合预测方法在新疆卡拉塔格地区铜金矿床找矿中的应用[J]. 中国地质, 45(1): 178−191. doi: 10.12029/gc20180115 [52] 孙雨, 刘家军, 赵英俊, 翟德高, 柳振江, 张方方, 秦凯, 田丰, 康向阳, 裴承凯, 刘鹏飞. 2022a. 航空高光谱CASI−SASI数据蚀变矿物信息提取与应用—以甘肃省敦煌市小金窝子地区为例[J]. 地质与勘探, 58(3): 653−664. [53] 孙雨, 刘家军, 赵英俊, 翟德高, 柳振江, 张亚峰, 张方方, 田丰, 秦凯. 2022b. 基于GF−5高光谱数据的蚀变矿物填图及地质应用—以甘肃省瓜州县花牛山地区为例. 中国地质, 49(2): 558−574. [54] 孙允珠, 蒋光伟, 李云端, 杨勇, 代海山, 何军, 叶擎昊, 曹琼, 董长哲, 赵少华, 王维和. 2018. “高分五号”卫星概况及应用前景展望[J]. 航天返回与遥感, 39(3): 1−13. [55] 田成华, 杨立强, 和文言, 张少颖, 刘申态, 吴才. 2022. 西藏玉龙斑岩铜矿床绢云母族蚀变矿物短波红外光谱特征及对勘查的指示意义[J]. 沉积与特提斯地质, 42(1): 40−49. [56] 田青林, 潘蔚, 李瑶, 张川, 陈雪娇, 余长发. 2019. 基于小波包变换和权重光谱角制图的岩心高光谱蚀变信息提取[J]. 国土资源遥感, 31(4): 41−46. [57] 王崇倡, 薛荣荣, 赵世湖, 刘书含, 王霞, 李鸿洲, 刘梓钦. 2021. GF−5卫星高光谱影像数据质量评价与分析[J]. 地理与地理信息科学, 37(1): 33−38, 125. doi: 10.3969/j.issn.1672-0504.2021.01.006 [58] 王曦, 程三友, 林海星, 陈静, 肖良. 2022. 基于Aster和Landsat8数据在青海赛什腾地区蚀变信息提取研究[J]. 地质论评, 68(1): 262−280. [59] 韦少港, 宋扬, 唐菊兴, 高轲, 冯军, 李彦波, 侯淋. 2016. 西藏色那铜(金)矿床石英闪长玢岩年代学、地球化学与岩石成因[J]. 中国地质, 43(6): 1894−1912. [60] 魏祥坡, 余旭初, 付琼莹, 刘冰, 薛志祥. 2016. 光谱角余弦与相关系数测度组合的光谱匹配分类方法与实验[J]. 地理与地理信息科学, 32(3): 29−33, 2. doi: 10.3969/j.issn.1672-0504.2016.03.006 [61] 叶发旺, 孟树, 张川, 徐清俊, 刘洪成, 武鼎. 2018. 航空高光谱识别的高、中、低铝绢云母矿物成因学研究[J]. 地质学报, 92(2): 395−412. doi: 10.3969/j.issn.0001-5717.2018.02.013 -
期刊类型引用(6)
1. 韩双宝,周殷竹,郑焰,周金龙,李长青,韩强强,李甫成. 银川平原地下水化学成因机制与组分来源解析. 环境科学. 2024(08): 4577-4588 .  百度学术
百度学术
2. 张卓,郭华明,韩双宝,牛笑童. 沉积物中砷的赋存特征及对地下水砷富集的控制:以内蒙古河套盆地为例. 中国地质. 2024(04): 1331-1341 . 本站查看
3. 吴光伟,李浩林,王庆兵,顾莎,郭梓烽,刘中业. 鲁西北平原地下水高氟与高碘成因分析. 岩矿测试. 2023(04): 793-808 . 百度学术
4. 张卓,柳富田,陈社明. 氢氧、锶钙和锂硼同位素在高氟地下水研究中的应用. 华北地质. 2023(03): 49-56 . 百度学术
5. 李红超,单强,马丙太,赵德刚. 基于逻辑回归分析的焦化行业地下水有机污染物分布特征及影响因素研究. 华北地质. 2023(04): 47-54 . 百度学术
6. 邢世平,郭华明,吴萍,胡学达,赵振,袁有靖. 化隆—循化盆地不同类型含水层组高氟地下水的分布及形成过程. 地学前缘. 2022(03): 115-128 . 百度学术
其他类型引用(2)


计量
- 文章访问数: 2666
- HTML全文浏览量: 1308
- PDF下载量: 532
- 被引次数: 8
